Article Text

Abstract
Objective To identify contributing factors associated with rapid spikes and declines in Chicago youth homicide from 2009 to 2018.
Setting City of Chicago, Illinois, US 2009–2018.
Participants Homicide count data come from the National Violent Death Reporting System. The study included information on 2271 homicide decedents between the ages of 15 and 24 who died between 1 January 2009 and 31 December 2018. Of these decedents, 92.9% were male; 79.1% were non-Hispanic black; and 94.9% died from a firearm injury.
Primary and secondary outcome measures (A) Temporal shifts in monthly homicide rates and (B) temporal associations between social, environmental and economic conditions/events and fluctuations in homicides.
Results We found statistically significant shifts in homicide rates over time: a 77% rise in monthly youth homicide rates per 100 000 persons from 2015 to 2016 (4.3 vs 7.5); dropping back to pre-2015 rates (4.3) by mid-2017. There was a temporal co-occurrence between the rapid rise in youth homicides and absence of a state budget. Conversely, we found a temporal co-occurrence of the sharp decline in homicides with the reinstatement of a state budget. Adjusting for seasonality, we found death rates were greater in the months without a budget compared with months with a budget (1.48, 95% CI 1.29 to 1.70).
Conclusions Our findings suggest that state funding may be a potential protective factor against youth homicide.
- public health
- epidemiology
- non-accidental injury
Data availability statement
Data are available upon reasonable request. Please contact corresponding author to request data.
This is an open access article distributed in accordance with the Creative Commons Attribution Non Commercial (CC BY-NC 4.0) license, which permits others to distribute, remix, adapt, build upon this work non-commercially, and license their derivative works on different terms, provided the original work is properly cited, appropriate credit is given, any changes made indicated, and the use is non-commercial. See: http://creativecommons.org/licenses/by-nc/4.0/.
Statistics from Altmetric.com
Strengths and limitationsof this study
Addresses the significant public health problem of firearm homicide and tests associations with a modifiable condition, that is, the absence and re-establishment of a state budget and a corresponding spike and decline in Chicago youth homicide rates.
Employs a novel application of run chart analysis methods and expanded data.
Identifies potential association between state funding as a protective factor against youth violence and enhancement of public safety.
Inability to consider or control for every potential factor that may have influenced youth rates over the study time period. It is possible that factors outside our consideration influenced the rapid increase and decline in youth homicides during the study period.
Limited data documenting the various ways the budget impasse directly affected youth and welfare services.
Introduction
Homicide is a leading cause of death for US youth (ages 15–24 years old), with an average annual fatality rate of 11 per 100 000 persons from 2007 to 2017.1 The city of Chicago, Illinois, has a persistent youth homicide problem and recently experienced marked oscillations in youth homicides rates.2–4 Youth between the ages of 15 and 24 are over-represented among homicide decedents in Chicago. In 2015, Chicago youth between the ages of 15 and 24 years made up 13.9% (378 766)5 of the city’s population but accounted for 39.3% of Chicago homicide deaths.6 Identifying factors associated with local fluctuations can inform prevention strategies. This study uses statistical process control charts in a novel way to evaluate youth homicide trends and associations with social and environmental contextual factors in Chicago over time. Our objective was to identify possible contributing factors behind rapid spikes and declines in Chicago youth homicide over a 10-year period from 2009 to 2018.
Methods
Patient and public involvement
This study used secondary data and did not include involvement of living subjects including patients.
Data sources
Homicide data were drawn from the Illinois Violent Death Reporting System, part of the National Violent Death Reporting System (NVDRS).7 NVDRS data come from death certificate and coroner/medical examiner, toxicology and autopsy reports and are used extensively in homicide research.8 Data for rate calculations were drawn from the American Community Survey 5-year population estimates and decile census data.5 To identify potential environmental and social factors contributing to youth homicide in Chicago, we reviewed literature on homicide spikes. We consulted child health, violence prevention and policy experts and asked them to retrospectively generate a list of potentially relevant conditions/events occurring during this time period (table 1). For information on fiscal implications of the budget impasse, we examined state and local ‘welfare’ (cash assistance, Supplemental Nutrition Assistance Program (previously known as food stamps) and housing) spending in Illinois and Chicago from 2009 onwards using an online interactive chart building tool available through USgovernmentspending.com.9 We also reviewed reports on the impact of the budget impasse on human service organisations in Illinois and interviewed a Chicago public safety expert (N Kerr, personal communication, October 2020) working in violence prevention during the study time period.
List of social/environment/economic conditions and events
The study includes all homicides of subjects aged 15–24 year olds in Chicago between 1 January 2009 and 31 December 2018. This age group was chosen based on the standardised age categories for teenagers and young adults in the US Census.5 This age group is of particular interest because it is a specific human developmental period encompassing biological maturation changes, cognitive development and a transition period of social roles, suggesting unique vulnerabilities and opportunities for violence prevention.10 We limited our study to youth within the city limits of Chicago, Illinois, as this city is an epicentre of youth violence in the region and has an entrenched history of youth violence since the 2000s, which continues to the present.
Statistical analysis
We applied standard statistical process control methods (U-charts) to identify significant temporal shifts in monthly homicide rates. This method allows for identification of significant shifts in the mean of variables of interest.11 Run chart methodology requires a set amount of data points above or below the mean in order to make a determination that a significant shift in the data occurred. We examined 1-month time periods with significance determination set at six consecutive data points (months) above or below the mean. We set control limits at 3 σ in accordance with established standards.12 Next, we plotted conditions/events onto the run chart to identify possible temporal associations between conditions/events and fluctuations in homicides.
To assess the association between the state budget and homicide rates while controlling for season, we estimated a negative binomial regression model. Overall homicide count serves as the dependent variable and a binary budget variable (months with a budget vs months without a budget), season (coded as a four-level categorical variable with the following monthly groupings: December–January–February, March–April–May, June–July–August and September–October–November) and calendar year as the independent variables. The log of the monthly population estimate serves as the offset. We also repeated this model while using a trichotomous budget variable (initial budget period, period without budget and period with budget reinstated).
Results
During the 10-year period, there were 2271 homicides among Chicago youth 15–24 years old; 95% were due to firearms (table 2). In 2009, the annual homicide rate among this population was 51 per 100 000 persons with an average monthly rate of 4.3 per 100 000; at the peak in 2016, the annual rate was 90 per 100 000 with an average monthly rate of 7.5 per 100 000. In 2018, the annual rate returned to earlier levels at 51 per 100 000 with an average monthly rate of 4.3 per 100 000. Men and women had annual rates of 108.5 and 8.1 per 100 000, respectively. Annual rates per 100 000 by race were 130.6 for non-Hispanic black, 32.7 for Hispanic and 4.2 for non-Hispanic white.
Homicide data characteristics: Chicago, ages 15–24 years
The U-chart analysis demonstrates statistically significant shifts over time, including a 77% rise in monthly youth homicides in 2016 and then a drop back to near pre-2015 levels by mid-2017 (figure 1). We identified a temporal co-occurrence between the rapid rise in youth homicides and the absence of a state budget. Conversely, a temporal co-occurrence of the sharp decline in homicides occurred with the reinstatement of a state budget.
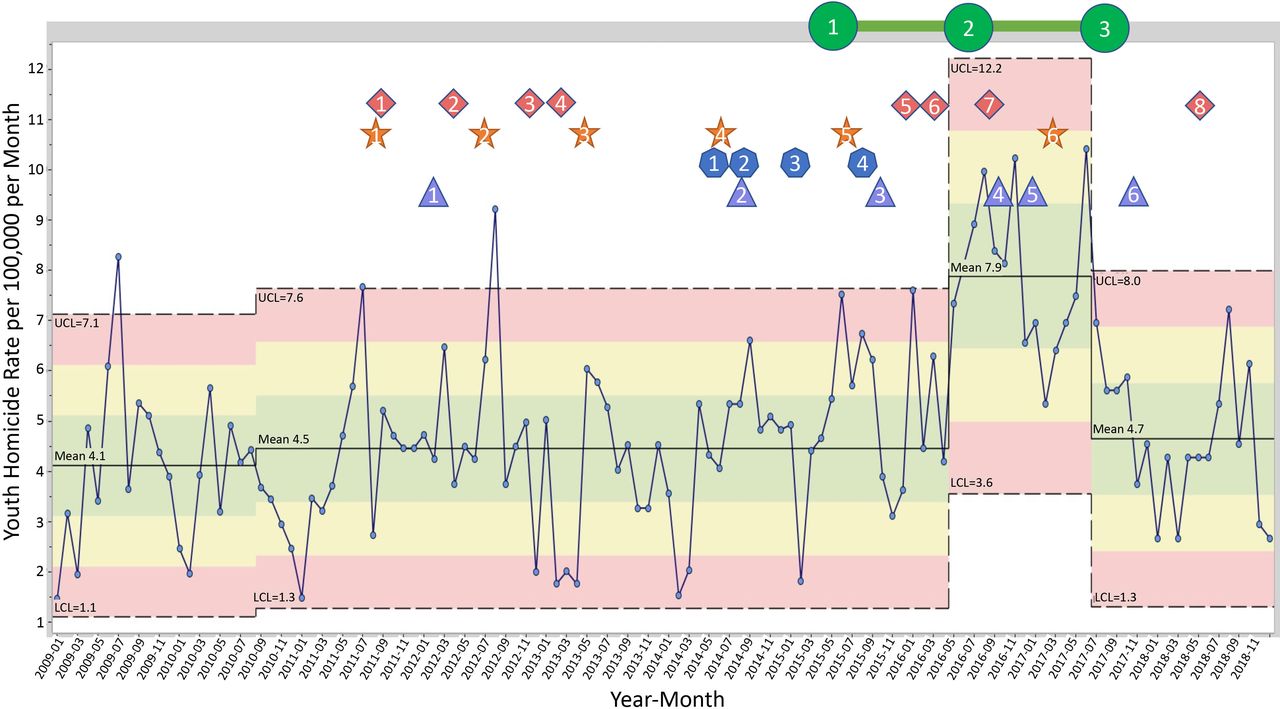
Run Chart: Chicago Youth Homicide Rate 2009-2018 with social and environmental events notated.
The regression model with binary budget periods found that compared with having a budget, non-budget months were associated with a significant 48% increased death rate (incidence rate ratio (IRR)=1.48, 95% CI 1.29 to 1.70), adjusting for season and year. The regression model with categorical budget periods found that, compared with the initial budget period, the no-budget period was associated with an increased risk of death (IRR=1.37, 95% CI 1.13 to 1.66). Also, the no-budget period was associated with an increased risk of death compared with the reinstated budget period (IRR=1.59, 95% CI 1.32 to 1.90). The predicted death rates per 100 000 persons across the three budget periods were first budget: 4.20 (95% CI 3.92 to 4.48), no budget: 6.69 (95% CI 5.99 to 7.39) and second budget: 4.57 (95% CI 3.95 to 5.19)
Discussion
In this study of Chicago youth homicides, we found that homicides are heavily concentrated among male and black youth. Importantly, we found an association between increases in youth homicide and the absence of a fully funded state budget. Our study included expanded data and applied methods adapted from quality improvement using statistical process control charts to identify statistically significant changes in youth homicides over time that account for changes beyond seasonal patterns to identify peaks and troughs in youth homicide.
Previous studies have demonstrated brief spikes in homicides, which frequently occur during summer months.13 Our study demonstrates that this spike extends beyond summer months. One study focusing on the recent spike in Chicago homicides found an association between implementation of a consent decree resulting in an 80% decline in ‘stop and frisk’ stops in Chicago and Chicago’s homicide surge.13 That seems a less plausible explanation as we note a rapid decline in homicides in the time period after the state budget was re-established. This is despite no demonstrated increase in stop and frisk stops during this time.14 15
A state-level study found an inverse relationship between state spending on social and public health services and homicide rates with greater state spending per capita in these areas resulting in reductions in the homicide rate.16 We note that annual local and state per capita ‘welfare’ spending in Illinois from 2009 to 2018 per capita was lowest during the budget impasse period. Chronic stress caused by extreme poverty (eg, food and housing insecurity, lack of access to health services) underlie many youth violence risk factors,17 and may be a contributor to the increased firearm homicides in Chicago youth. It is reasonable to expect that cuts to welfare spending including Supplemental Nutrition Assistance Programme (food stamps) and housing subsidies may lead to chronic stress and ultimately increase youth violence risk factors.
Welfare spending is not an exhaustive indicator of how the lack of a state budget may affect youth and their communities. Historically, the human services infrastructure has been mainly supported by government funding, and it makes sense that the lack of a state budget may have weakened the human services infrastructure in Illinois. Reports from a periodic survey by the United Way of Illinois documented the impact of the budget impasse on the human services sector. They reported significant cuts in criminal justice, youth development and other sectors’ programming and numbers of clients served.18–20 Further, a report by the State Comptroller’s Office documents a negative relationship between the lack of a state budget and services.21 It is reasonable to expect that cuts to these services such as youth activity programming, employment training, mental health services and other services may contribute to increased risk factors for youth violence.17 According to Acting Deputy Mayor for Public Safety at the City of Chicago and a former director of a community violence prevention/intervention initiative at a large community organisation, funding for violence interruption services became unstable and limited during the budget impasse period in 2016, resulting in staff layoffs and service disruptions.
Limitations
This study’s limitations include our inability to control for every potential factor that may have influenced youth homicide rates over the study time period. Instead, we focused on a carefully selected factors that are established risk factors or related to established risk factors for youth violence, including schools, economic conditions, and policing and police–community conflict. It is possible that factors outside our consideration influenced the rapid increase and decline in youth homicides during the study period.
Conclusions
Our study uses novel statistical modelling to provide additional insights into possible associated risk factors for youth homicide. The relationship between the absence of a state budget and increased firearm and total homicides is reinforced by the temporal co-occurrence of the re-establishment of the state budget and the decrease in youth homicides. Quantification of youth development and violence prevention service funding cuts reinforces the plausibility of the negative impact of the budget cut as a leading potential contributor to the spike and subsequent decline in homicides. This emphasises the importance on a policy level of consistent state budgets to support human services. This area deserves further exploration. Our findings demonstrate the potential association of state funding as a protective factor against youth violence and public safety.
Data availability statement
Data are available upon reasonable request. Please contact corresponding author to request data.
Ethics statements
Patient consent for publication
Ethics approval
This study does not involve human participants and was exempt from institutional board review because research involving deceased persons is not considered human subjects research.
Acknowledgments
The authors acknowledge the Illinois VIolent Death Reporting System (IVDRS) data abstractor team that worked diligently to abstract data used for this study. The research presented in this paper is that of the authors and does not reflect the official policy of the Centers for Disease Control and Prevention. Authors of this paper reported no financial disclosures.
Footnotes
Contributors MM led the conceptual development of the project and manuscript development. SM completed homicide data analysis. MCM contributed to statistical analysis using regression modelling and run chart methods. KS provided conceptual input to the manuscript. LKL provided conceptual and analytical input into the manuscript. EWF participated in conceptual design, data analysis and findings interpretation. MM accepts full responsibility for the overall content and conduct of the study. MM had access to the data, and controlled the decision to publish.
Funding The authors have not declared a specific grant for this research from any funding agency in the public, commercial or not-for-profit sectors.
Competing interests None declared.
Patient and public involvement Patients and/or the public were not involved in the design, conduct, reporting or dissemination plans of this research.
Provenance and peer review Not commissioned; externally peer reviewed.