Article Text

Abstract
Objectives To estimate the current disease burden, trends and future projections for diabetes mellitus (DM) and diabetic retinopathy (DR) in the IQVIA Medical Research Data (IMRD).
Participants/design/setting We performed a cross-sectional study of patients aged 12 and above to determine the prevalence of DM and DR from the IMRD database (primary care database) in January 2017, involving a total population of 1 80 824 patients with DM. We also carried out a series of cross-sectional studies to investigate prevalence trends, and then applied a double exponential smoothing model to forecast the future burden of DM and DR in the UK.
Results The crude DM prevalence in 2017 was 5.2%. The DR, sight-threatening retinopathy (STR) and diabetic maculopathy prevalence figures in 2017 were 33.78%, 12.28% and 7.86%, respectively, in our IMRD cross-sectional study. There were upward trends in the prevalence of DM, DR and STR, most marked and accelerating in STR in type 1 DM but slowing in type 2 DM, and in the overall prevalence of DR.
Conclusion Our results suggest differential rising trends in the prevalence of DM and DR. Preventive strategies, as well as treatment services planning, can be based on these projected prevalence estimates. Improvements that are necessary for the optimisation of care pathways, and preparations to meet demand and capacity challenges, can also be based on this information. The limitations of the study can be overcome by a future collaborative study linking DR screening and hospital eye services data.
- Diabetic retinopathy
- Ophthalmology
- Epidemiology
- Medical retina
Data availability statement
All data relevant to the study are included in the article or uploaded as online supplemental information. Data were part of a digital database and are not available to be shared. Analysis details are in the publication/appendices.
This is an open access article distributed in accordance with the Creative Commons Attribution Non Commercial (CC BY-NC 4.0) license, which permits others to distribute, remix, adapt, build upon this work non-commercially, and license their derivative works on different terms, provided the original work is properly cited, appropriate credit is given, any changes made indicated, and the use is non-commercial. See: http://creativecommons.org/licenses/by-nc/4.0/.
Statistics from Altmetric.com
Strengths and limitations of this study
This is an up-to-date study to give diabetes mellitus (DM) and diabetic retinopathy (DR) prevalence trends from 1998 to 2018.
This study forecasts the future DR disease burden up to 2030 to enable preparation for impending challenges.
Current prevalence of age 12 and over, diagnosed DM, DR, sight threatening retinopathy, diabetic macular oedema disease and treatment burden in UK.
This study has not, however, been adjusted for the risk factors for the incidence/prevalence of DM or DR.
A possible impact of coding errors and subjectivity in documentation cannot be precluded.
Introduction
DR is the fourth most common cause of blindness and visual impairment in high-income countries.1 Services are overburdened and optimisation requires accurate estimates of disease and the expected treatment burden.2 A recent systematic review of studies estimating the incidence of DR3 highlighted the paucity of contemporary evidence from developed countries on the disease burden and recommended that estimates should be based on populations with diabetes mellitus (DM) rather than the general population so as not to dilute the estimates. A recent attempt to forecast the UK-wide disease burden of DR was hindered by the need for reliable data.4
Previous studies have been conducted on the prevalence of DR,5–9 with the most recent UK-wide study being performed in 2014 based on Clinical Practice Research Datalink (CPRD). Two of these studies also explored trends in DR incidence and prevalence.6 9 A significant amount of heterogeneity in the populations studied, the classification of DR, the definition of its presence and severity was present in these studies. Studies of the forecasts of the future disease burden of DR would be useful both for preparing healthcare delivery systems for the future, and in preventing blindness in patients with DM. There is a Europe-wide forecast study with UK component based on pre 2009 data dealing with DR only.10 The disease burden estimate of DR will not be complete without a similar estimate for the diabetes burden. A UK-wide up-to-date study dealing with DM, DR and sight threatening retinopathy (STR) is needed.
A previous study on future projections of DM in the UK was found to underestimate prevalence.11 Moreover, evidence suggests that the rate of increase is not constant or uniform across DM subtypes (namely type 2 DM (T2DM) and T1DM, especially in children.12 The incidence rate of T1DM (pooled estimate of European centres, UK included) in children is expected to continue to rise at a rate of 3.4% per annum.13 Gonzalez et al14 reported an increasing prevalence of DM for the 10 years up to 2005. Public Health England (PHE) figures are available for 2019, based on the Quality Outcome Framework, except in Scotland where they are based on Scottish Diabetes Survey.15 However, these figures are limited to those over 17 years old. We aimed to estimate recent trends in the disease burden of DM, and to use this as a base on which to estimate the current disease burden for DR and STR in the UK. We then wanted to design, train, and validate a forecasting model to support future projections of these disease burdens. Since DR screening is offered after age 12 only, the population of interest to us was age 12 or over only.
Methods
Study design and data source
Several studies have already been performed on IQVIA Medical Research Data (IMRD) (previously The Health Improvement Network) and their findings have been extrapolated to UK and European population.16–21 This database has documented generalisability to the UK population.22
To study the trend, and to forecast the future burden of diagnosed DM, DR and STR, we used the IMRD database to conduct a series of yearly cross-sectional analyses on the first of each year from 1998 to 2018. In addition, a detailed cross-sectional study was carried out on the 1 January 2017 to estimate the prevalence of T1DM and T2DM in the whole UK population, and of DR in patients with T1DM and T2DM.
IMRD is a large UK general practice electronic database containing anonymised patient records from 787 general practices, with over 15 million patient records, of which around 3.7 million are active at a given time point (6.2% of the UK population). IMRD provides information on demographics, lifestyle, diagnoses and prescriptions, and is quality checked.23 Based on the demographic distribution observed in IMRD, it is considered generalisable to the UK population.22 IMRD has previously been used and validated to estimate prevalence trends of DM and DR, and to identify risk factors for DR.14 24–27
Study population
To ensure that only high-quality data were included, and that all important covariates were documented, general practices were eligible only if they showed acceptable mortality rates 1 year before the cross-sectional study date,23 and had been using the electronic medical record system for at least a year. Patients from eligible general practices must have been registered with their practice for at least 1 year and must be aged 12 years or above to be included in the study to match the Diabetic Eye Screening Programme criteria (DESP). For estimation of the prevalence of T1DM and T2DM, the whole registered population was included as the denominator population (per 1000). For estimation of STR and DR prevalence, patients with DM served as the denominator (per 100). Estimates are stratified by type of diabetes.
Case definition of diagnoses of DM and DR
Clinical diagnosis and symptoms in the IMRD database are recorded using the Read code classification system.28 Read codes were selected using a rigorous seven step process and selected search terms (online supplemental appendix 1,2). Read codes are given in online supplemental appendix 3. Patients with a Read code record of DM before the study entry date were identified. Patients with a record of DM were categorised as type 1 if they had at least one prescription record for insulin and no record for any oral glucose-lowering medication other than metformin in the database. The remaining patients with diabetes were categorised as type 2. Prevalence estimates calculated were verified against PHE estimates of DM.29
Supplemental material
The most severe DR Read code recorded before patient’s study entry was used to classify their DR or STR status. Stages of DR among those patients identified with DM were classified using the Royal College of Ophthalmology modified classification.30 However, patients with a retinopathy record were stratified into mutually exclusive categories of (1) Pre-STR including no retinopathy and background retinopathy, (2) STR and (3) Retinopathy unspecified as either pre-STR (background retinopathy) or STR. Pre-STR was further categorised into mutually exclusive categories: (1) R0 or (2) R1. STR was further categorised into mutually exclusive categories of (1) STR based on diagnostic codes and (2) STR that needed treatment or resulted in vision loss. Within STR we categorised preproliferative DR (R2) and proliferative DR (R3) as mutually exclusive groups. STR was further stratified into overlapping categories based on the presence of STR (R2/3) and maculopathy (M1). Treatment and vision loss codes included: (1) laser therapy, (2) vitreous injection and other vitreous procedures, (3) low vision or blindness.
Time trend analysis and forecasting models
A double exponential smoothing model was chosen to cover the level and trend, as this was yearly cross-sectional data with no seasonal/cyclical variation expected or observed31 not unlike Adams et al published model.32 The IMRD serial cross-sectional data for the prevalence of DM and DR (STR and any retinopathy) were split into two portions—1998–2013 (training data) and 2014–2018 (test data). The model was fitted to the training data and then prediction was carried out from 2014 to 2018. This was then compared with the test data for validation. Thereafter, the yearly prevalence of DR and STR were projected up to 2030 using the same model with 95% prediction intervals (PI). This was done using the statistical software R (2019).33 Prevalence rates were then converted into patient numbers, using projected population figures from the Office of National Statistics.34
IMRD data analysis for annual prevalence of DM and DR
Prevalence trends between the two decades before and after 2008 were compared for trend analysis. Patients identified as T1DM or T2DM on or before 1 January in each year analysed were identified as the numerators for calculating the prevalence of T1DM and T2DM. The prevalence was estimated by dividing the numerator population by the eligible registered population aged above 12 years (denominator) on 1 January for the corresponding year. Among these patients, those diagnosed with any retinopathy and those with STR were numerators for calculating the prevalence of DR and STR respectively. Prevalence estimates are provided for patients with T1DM and T2DM separately with 95% CIs. A description of patients aged 12 or above with a diagnosis of DM is also given for the year 2017. Baseline characteristics such as age, and age at diagnosis of diabetes were summarised as the mean (SD), and as frequency (percentage) for sex, Townsend deprivation quintile and ethnicity. These characteristics were also reported as stratified by type of DM. A detailed description of the proportion of DM patients (T1DM and T2DM aged 12 or above) with DR in the year 2017 categorised by DR severity is also presented. Estimates from IMRD were compared with estimates obtained from data from UK studies5–7 9 35 for verification and comparison.
Results
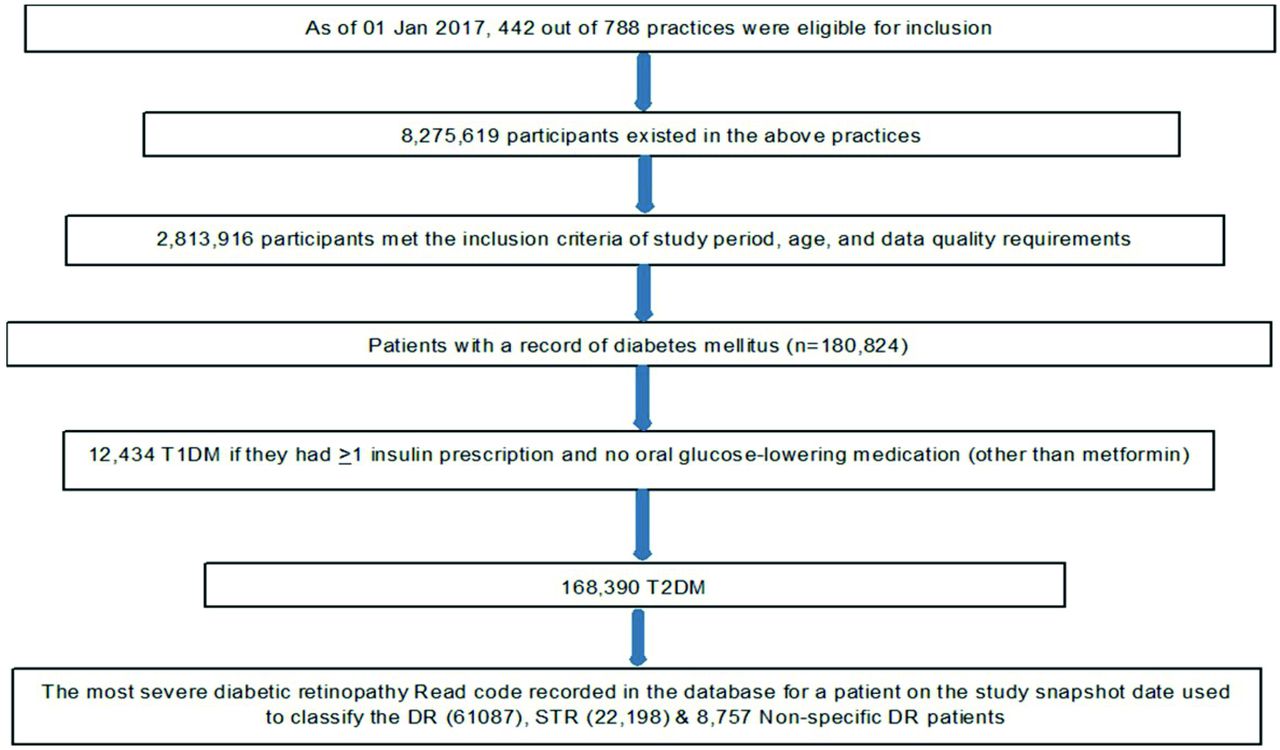
Figure 1 gives the Patients flow and case selection algorithm. As of 1 January 2017, 2 813 916 people were eligible to be included in the primary cross-sectional analysis. The demography characteristics of the sample are given in table 1. The mean age of patients with T1DM and T2DM as of 1 January 2017 was 42.5 (17.2) and 66.3 (13.0), respectively. The mean age at diagnosis of T1DM and T2DM were 21.4 (14.3) and 57.0 (13.1), respectively. Nearly 80% and 55% of patients, respectively, had their Townsend deprivation and ethnicity recorded in the IMRD database.

Patients flow and case selection algorithm. DR, diabetic retinopathy; STR, sight threatening retinopathy; T1DM, type 1 diabetes mellitus.
Demography of patients with DM in IMRD data on 1 January 2017
Prevalence trends
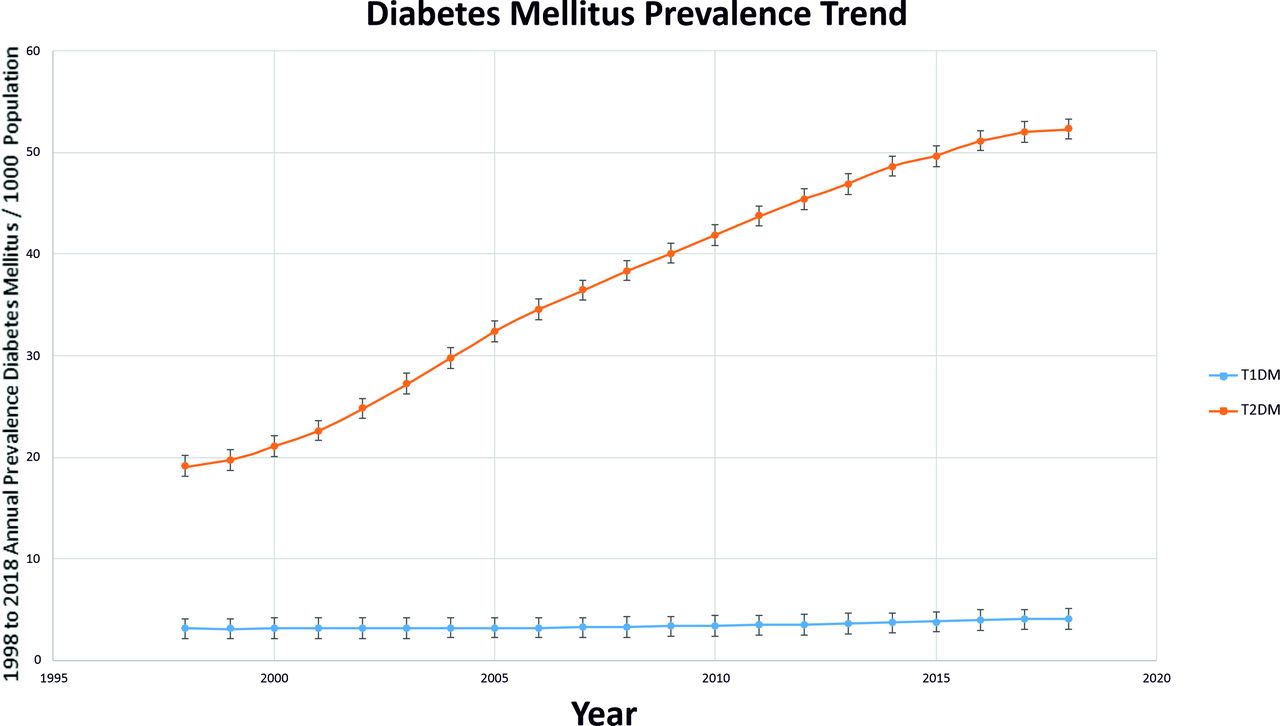
The results in figures 2 and 3 show an almost a global upward trend in the prevalence of both types of diabetes (T1DM and T2DM) and in DR (all types of DR/STR). The highest rise was seen in STR in those with T1DM (3.7 times increase in two decades). The second highest rise was in all types of DR in the T2DM population (2.8 times). Splitting this data by the decades (1998–2007 vs 2009–2018), the end of the first decade showed a higher increase in every category (diabetes as well as DR) as compared with the second decade, except in T1DM where it was higher in second decade (online supplemental appendix 4). T2DM increased more than T1DM between 1998 and 2018, but while the increase in T2DM prevalence slowed recently, the increase in T1DM prevalence accelerated significantly in the recent decade.

Prevalence trends of DM from year 1998 to2018. DM, diabetes mellitus; T1DM, type 1 diabetes mellitus; T2DM, Type 2 diabetes mellitus.

Annual prevalence (95% CI) of DR and STR from year 1998 to 2018. DR, Diabetic Retinopathy; T1DM, type 1 diabetes mellitus number; T2DM, type 2 diabetes mellitus; STR, sight threatening retinopathy.
Forecasting model
The forecasted annual UK prevalence values of T1DM, T2DM, DR and STR, with their 95% PI, are given in the online supplemental appendix 5. These suggest that the prevalence will increase by 24% (5% to 43%), 7% (–28% to 41%), 9% (–50% to 65%) and 17% (–21% to 54%), respectively by 2030. Corresponding estimates of the absolute numbers of people in the UK forecast to have these conditions are shown in table 2. These correspond to 0.36 (3−0.4), 4 (2.6–5.3), 1.6 (7–2.5) and 0.64 (0.42–0.86) million people, respectively, having each condition, respectively. We verified our UK forecast for 2019 and found the total figure (3800,920) to be close to the Quality Outcome Framework provided estimate of diagnosed DM of 3 809 119.
Future projections of diabetes and DR disease burden
2017 cross-sectional analysis
In the 2017 data analysis, 180 824 patients had a code for diabetes prior to this date of which 12 434 (6.9%) were identified as T1DM and 168 390 (93.1%) were identified as T2DM. Patients with DM were more likely to be men (56.2% vs 43.8%). The prevalence of DR in different stages of progression is given in table 3. Prevalence of any DR and STR among patients with DM aged 12 and above was 33.8% and 12.3%, respectively. When stratified by diabetes type, a higher proportion of patients with T1DM had a more severe form of retinopathy than patients with T2DM (prevalence of STR was 29.7% vs 11%), while prevalence of pre-STR (R0/R1 & M0) was higher among patients with T2DM (31.8% in T1DM vs 37.8% in T2DM). Each subcategory among STR population (R2/R3/M1 and their combinations), was present in higher proportion of patients with T1DM as compared with T2DM (R2: 3.7% vs 1.2%; R3: 12.1% vs 1.9%; and M1: 19.6% vs 7.0%, respectively). A higher proportion of patients with T1DM compared with T2DM also received treatment procedures (laser: 7.1% vs 1.3%; vitreous injection and procedures: 5.1% vs 1.1%). There was also a higher proportion of documented cases of visual impairment or vision loss among T1DM (3.1% vs 2.8%).
Diabetic Retinopathy in patients with DM in IMRD data on 1 January 2017
Discussion
Principal findings
We explored the disease burden associated with DM and DR in the UK from the past, present and future perspectives. Our study followed a tripartite structure, comprising of (1) a series of epidemiological studies throughout a 20-year span to document disease-specific trends, (2) training a forecasting model to predict the future disease burden to guide clinical practice and service development and (3) a detailed descriptive cross-sectional analysis in 2017 using a study population of 180 824 people with diabetes to explore contemporary prevalence estimates of different forms of DR.
Between 1998 and 2018, the prevalence of DR and STR increased. The prevalence of all DR in T2DM nearly tripled and STR almost quadrupled among patients with T1DM aged 12 and above. There was a parallel increase in the overall prevalence of DM. While the growth in the numbers of T1DM patients was less than that for patients with T2DM, stratifying the calculations by two decades showed a marked rise in the rate of increase in T1DM prevalence in the latter half of the whole period between 1998 and 2018. This was in sharp contrast to the trends in T2DM, STR and DR prevalence, which showed a higher rise in the decade between 1998 and 2007 but slowed down in the later decade between 2009 and 2018.
Our forecasting model showed that, in less than ten years, over 1.5 million people with diabetes will have some DR, almost two-thirds of a million of whom will have STR. With T1DM expected to rise faster and higher, it is also likely to correspond to a comparatively higher rise in STR, forcing a further increase in demand on services.
A key parameter when calculating the current and future prevalence of DR is the accuracy of estimates of the trend of the underlying condition, that is, the presence of DM. T1DM showed a smaller increase in the period starting from 1998, but this has accelerated since 2009. This is the most concerning recent trend considering that these are younger patients (mean age of diagnosis of 21.4 vs 57), having to live with the condition and its complications for more life years, and suffering from the more severe form of DR, with the consequent disability, treatment burden and treatment costs. There is a recent report of a 3.4% annual increase in the incidence rate of T1DM in children.13 Although there is an association between T1DM and obesity,36 it is believed that the cause may be multifactorial, including hygiene, viral factors and vitamin D deficiency among others.37
The diagnosed DM prevalence based on the 2017 IMRD cross-sectional survey is 5.2%. The detailed descriptive analysis in 2017 showed that, out of 180 824 people with diabetes, 33.8% had any DR as a complication, 12.3% had STR and importantly, 2.8% had blindness or vision loss. STR was 52% of total DR in T1DM and 34% of total DR in T2DM. In 2017, nearly one-third of all patients with T1DM were affected by a sight threatening form of DR. This analysis also confirmed the notion that, from the healthcare perspective, neither DM type is ‘benign’ with regards to DR risk, since DR severity is graver in T1DM, and absolute numbers of affected individuals are higher in T2DM.
Diabetic complications are mainly macrovascular damage (coronary artery disease, peripheral arterial disease and stroke) or microvascular damage to blood vessels in organs like kidney, foot and nerves.38 Tackling the first reduces mortality rate and might mean these patients living longer and consequently a higher prevalence of DR among higher risk patients. With greater efficacy and a rapid reduction of glycosylated haemoglobin (HBA1C), the new agents might induce progression of DR (early worsening).39 So, with increased prevalence there may be a disproportionate rise in more high-risk DR cases. There are conflicting reports on direct effect of newer medical treatments like Incretin based therapies on DR39 40 but the follow-up is limited at the moment.
Strengths and weaknesses of this study
This study reports up to date prevalence figures of DM, DR and STR, as well as trends from 1998 to 2018, in a clinically relevant form, which clinicians and managers leading hospital eye services can use in the management of services for diabetes and DR. Our work is based on a cross-sectional analysis of primary care data and is therefore closer to routine practice. Our findings have also been verified against PHE, DESP and other previously published figures.5–7 14 35 41 42 This is also the first observational IMRD based study to forecast the DM, DR and STR disease burden in the UK all together. While incorporating current evidence on the trend of underlying condition (DM), this study portrays a comprehensive analysis of the recent DR disease burden.
The findings of this study should be interpreted within the context of its limitations. In particular, the inability to incorporate evidence regarding the potential impact of glycaemia control and concomitant medications on the incidence of DR should be promptly acknowledged. Suboptimal glycaemic control is a well-established risk factor for microvascular complications (such as DR), whereas fenofibrate, an agent used in in some patients with diabetes may have a positive effect on the course of DR.
Additional limitations are possible coding errors, challenges of addressing missing data, changes in the diagnostic criteria of DM and the potential risk of an overestimation of vision failure. The findings of this study should be interpreted within that context. First, the possible impact of coding errors, as well as subjectivity in documentation across a retrospective nationwide database involving several practices in different areas, cannot be precluded. This potential risk was minimised through a strict Read code selection process. The prevalence of severe DR was higher for those of South Asian and mixed ethnicity,9 therefore, could have implications for local variations in its prevalence, and estimates could differ depending on the local ethnic mix. The potential impact of several concomitant medications on the course of DR was not captured in this study design. For the sake of future projections, estimates from individuals over 12 years old were applied to the whole population to calculate the final values, assuming that the number of DM patients under 12 is extremely low. Finally, we acknowledge that these projections are subject to the assumption that factors affecting the incidence, course and progression of the disease will remain stable over the next few years.
We wanted to verify our figures against data from DESP which screens everyone from age 1243 and Mathur et al work.9 Both these research studies used a cut-off of over 12 years for their estimates. We wanted our findings to be generalisable to the whole UK populations with diabetes including those under care of DESP and Hospital Eye Services. We also wanted it to be generalisable internationally where majority of world population with diabetes is within one pool, without access to screening services. Limitations of this age cut-off are that 2017 figures are not easily verifiable against PHE figures 2017 being over 17 years of age. So, verification against that estimate is a bit problematic and thus adds uncertainty to our UK forecast estimates.
Strengths and weaknesses in relation to other studies, discussing particularly any differences in results
Gonzalez et al14 reported an increasing prevalence of diabetes between the years 1996 and 2005 (10 years) based on THIN data analysis of patients aged 10–79 years old. They reported an overall increase of 54%. Our estimate between 1998 and 2005 (our data did not match the years) was 60%. In a CPRD based study, Zghebi et al42 found an overall increase of 64% in the patient population between 2004 and 2014, but this was limited to patients over 16 years old with T2DM. Our corresponding figures are 63%. Thus, our estimates fall midway between these two studies. Bagust et al presented a future forecast for UK, but is limited to T2DM and is an underestimation.11 It projected T2DM figures for 2036 to be 1.1 million.
The PHE estimate for prevalence of diabetes in UK in 2017 arrived at by Quality and Outcome Framework figures was 3.7 million (5.6%) in those aged 17 years and over41 and included diagnosed patients with diabetes. Our estimate of diagnosed patients with diabetes in 2017 of 3.4 million (crude prevalence of 5.2%) in over 12 years old population contrasts with the 2017 PHE figures. Similarly), PHE predicted the diabetes burden for 2025 to be 4.9 million for people aged over 16 years.44 It is not possible to make a direct comparison with our forecast of just under 4.3 million for 2025 because of our estimate being for people over 12 years of age but could mean the present study to be an underestimation. Alternatively, PHE figures could be an overestimation for 2017, because of the inbuilt assumptions in that model. Our estimate for 2019 matches the quality and outcome estimate of 3.8 million. International Diabetes Federation45 estimated total diabetes prevalent cases (20–79 years old) to be 2.7 million in 2017, which is an underestimation when compared with PHE and our study.
A recent DR prevalence study focused on lower risk patients with diabetes under screening services.9 The DR period prevalence in the Mathur’s study (2004 to 2014) was found to be 48.4% for patients with T1DM and 28.3% for patients with T2DM, contrasting with point prevalence (2017) of 56.4% and 32.0% for patients with T1DM and T2DM, respectively, in our study. They also did not split the pathology into maculopathy and preproliferative categories and did not include treatment and vision failure.10,10 is the only study so far, that has projected DR till 2050. They estimated that 8.6 million people with diabetes (DR in 25% of the European population with T2DM and 50% with T1DM) will have diabetic eye disease inn 2050. The British studies included within this systematic review were based on diabetic screening services from pre-200946 and pre-2003 data.7 Case definitions and patient pathways have since changed. Consequently, their figures are a significant underestimation as compared with ours (710 510 vs 1 612 395 in 2030)
Other prevalence studies from the UK5–7 35 are compared with estimates from our study in detail for completeness in online supplemental appendix 6,7. Majority of these UK studies are quite old, come from the screening programme setting, and do not deal with all of the categories of DR due to changed case definitions. Keenan et al47 is a study based on work between 2007 and 2009 on hospital patients. They based their estimates of prevalence in eyes rather than patients, therefore, due to this heterogeneity, cannot be directly compared with our figures.
Meaning of the study: possible mechanisms and implications for clinicians or policymakers
Consecutive analyses over the course of over two decades provides information regarding the trend and severity of diabetic disease, and by a detailed analysis of different forms and severity groups, it captures the implications for the public health system. With the use of relevant outcomes, coupled with a prerequisite validation, the study provides a forecasting model which will be of use for clinicians and managers leading the professional services in planning the capacity to meet the increasing demand, and will guide public health strategy. Local demand can be calculated with the help of national figures provided by taking local factors into account.48
Out of the 33.8% of total DR in all patients with diabetes, 12.3% was made up of the STR. Those STR patients that actually needed treatment or experienced vision failure constituted a total of 5%. These figures reflect a high false-positive rate of referrals (50%–70% as reported earlier2 49 and needs to be considered in the future relationship between DESP and overburdened hospital eye services. Our estimated prevalence figures, in a clinically relevant form, will help the clinicians and managers leading hospital eye services to optimise capacity planning for the increased demand.
Unanswered questions and future research
PHE used a prevalence model to predict the disease burden of diabetes in 2016.48 The predictive factors they used were age, ethnicity, gender and deprivation index. To accommodate local variation in populations and practices, final calculations can be made using these predictive factors. The above-mentioned limitations of the study can be overcome by a future collaborative study linking DR screening and hospital eye services data, with figures based on patient numbers and not eyes, to prevent heterogeneity among studies. Forecasting capacity needs is an area that should be repeated periodically with the help of the forecasting model presented.
Conclusion
In our study, the estimates suggested a trend of differential rise in prevalence rates in T1DM and T2DM. Overall, there is a continuing rise in the numbers of patients with DM and DR needing care. Preventive strategies and service planning can be based on these projected prevalence estimates to meet demand over the next ten years. Future forecasting will need repeating periodically to capture any external factors causing a change in the present trend.
Data availability statement
All data relevant to the study are included in the article or uploaded as online supplemental information. Data were part of a digital database and are not available to be shared. Analysis details are in the publication/appendices.
Ethics statements
Ethics approval
The IMRD database has blanket approval by the NHS South East Multi-centre Research Ethics Committee (MREC) in 2003 (51). The study protocols were submitted to both the Scientific Review Committee and the Science, Technology, Engineering and Mathematics Ethical Review Committee at the University of Birmingham for review and approval, which were granted. Consent was not required.
References
Supplementary materials
Supplementary Data
This web only file has been produced by the BMJ Publishing Group from an electronic file supplied by the author(s) and has not been edited for content.
Footnotes
DM, MJP and KN are joint senior authors.
Contributors SH and KN designed the main study. AS performed data extraction. SH made the main contribution to the interpretation of data and wrote up the draft. RT designed and carried out the future projection model. AS, MJP, DM, KAT and KN made a contribution verbally or by critical revision of the draft. All authors approved the final version of the manuscript.
Funding The authors have not declared a specific grant for this research from any funding agency in the public, commercial or not-for-profit sectors.
Provenance and peer review Not commissioned; externally peer reviewed.
Supplemental material This content has been supplied by the author(s). It has not been vetted by BMJ Publishing Group Limited (BMJ) and may not have been peer-reviewed. Any opinions or recommendations discussed are solely those of the author(s) and are not endorsed by BMJ. BMJ disclaims all liability and responsibility arising from any reliance placed on the content. Where the content includes any translated material, BMJ does not warrant the accuracy and reliability of the translations (including but not limited to local regulations, clinical guidelines, terminology, drug names and drug dosages), and is not responsible for any error and/or omissions arising from translation and adaptation or otherwise.