Article Text

Abstract
Objectives To assess the degree of frailty in older people with different advanced diseases and its relationship with end-of-life illness trajectories and survival.
Methods Prospective, observational study, including all patients admitted to the Acute Geriatric Unit of the University Hospital of Vic (Spain) during 12 consecutive months (2014–2015), followed for up to 2 years. Participants were identified as end-of-life people (EOLp) using the NECPAL (NECesidades PALiativas, palliative care needs) tool and were classified according to their dominant illness trajectory. The Frail-VIG index (Valoración Integral Geriátrica, Comprehensive Geriatric Assessment) was used to quantify frailty degree, to calculate the relationship between frailty and mortality (Receiver Operating Characteristic (ROC) curves), and to assess the combined effect of frailty degree and illness trajectories on survival (Cox proportional hazards model). Survival curves were plotted using the Kaplan-Meier estimator with participants classified into four groups (ie, no frailty, mild frailty, moderate frailty and advanced frailty) and were compared using the log-rank test.
Results Of the 590 persons with a mean (SD) age of 86.4 (5.6) years recruited, 260 (44.1%) were identified as EOLp, distributed into cancer (n=31, 11.9%), organ failure (n=79, 30.4%), dementia (n=86, 33.1%) and multimorbidity (n=64, 24.6%) trajectories. All 260 EOLp had some degree of frailty, mostly advanced frailty (n=184, 70.8%), regardless of the illness trajectory, and 220 (84.6%) died within 2 years. The area under the ROC curve (95% CI) after 2 years of follow-up for EOLp was 0.87 (0.84 to 0.92) with different patterns of survival decline in the different end-of-life trajectories (p<0.0001). Cox regression analyses showed that each additional deficit of the Frail-VIG index increased the risk of death by 61.5%, 30.1%, 29.6% and 12.9% in people with dementia, organ failure, multimorbidity and cancer, respectively (p<0.01 for all the coefficients).
Conclusions All older people towards the end-of-life in this study were frail, mostly with advanced frailty. The degree of frailty is related to survival across the different illness trajectories despite the differing survival patterns among trajectories. Frailty indexes may be useful to assess end-of-life older people, regardless of their trajectory.
- geriatric medicine
- adult palliative care
- quality in health care
Data availability statement
The data supporting the findings from this study are available from the corresponding author (JA-N) on reasonable request.
This is an open access article distributed in accordance with the Creative Commons Attribution Non Commercial (CC BY-NC 4.0) license, which permits others to distribute, remix, adapt, build upon this work non-commercially, and license their derivative works on different terms, provided the original work is properly cited, appropriate credit is given, any changes made indicated, and the use is non-commercial. See: http://creativecommons.org/licenses/by-nc/4.0/.
Statistics from Altmetric.com
Strengths and limitations of this study
To our knowledge, this is the first study that evaluated the degree of frailty using a frailty index in older patients with different advanced illness trajectories.
This is a real-life study, using tools routinely applied in the Acute Geriatric Unit conducting this study, the NECPAL, to identify people with palliative care needs, and the Frail-VIG index, to measure the degree of frailty and personalisation of the interventions.
In this context, assessing frailty degree may contribute to establish a common language between geriatric and palliative knowledge, with the goal of providing a better care for older people with palliative care needs, specially those in the first end-of-life transition.
The use of a single computer system collecting the mortality status reported by all health providers prevented loss of patients and missing data, increasing the accuracy of the results.
The results from this study were obtained in a very old population and the Frail-VIG index lacks sufficient external validation, potentially limiting their generalisability and raising the need for further studies in younger populations.
Introduction
The model of care for patients with advanced chronic conditions is currently shifting towards a new paradigm, characterised by early identification of persons with any disease or chronic condition who would benefit from palliative care1 2—this corresponds to the first transition in palliative care. Despite the benefits of this early identification,3 the increasing number of people with palliative care needs, together with their high heterogeneity regarding age, needs, diseases and chronic illnesses, poses novel challenges for early identification and assessment of these patients.4 5 Indeed, the progression towards the end of life is conditioned by multiple variables and is strictly individual: not all people age in the same way nor reach the final situation with the same circumstances or needs.6
In the context of this new paradigm of ‘early palliative care’, some authors have pointed to frailty as a crucial concept for persons needing palliative care―particularly older people with multimorbidity―their caregivers and healthcare professionals, to learn to manage the uncertainty and complexity of these end-of-life situations.7–9 Given the relationship between mortality and frailty,10 the concept of frailty has been proposed as a criterion useful in the three key steps ensuring good palliative care,5 6 11 12 including (1) early identification of persons in end-of-life situation (particularly in cases of advanced frailty); (2) multidimensional assessment and situational diagnosis; and (3) drafting an advanced care plan and sharing decision-making.
Regardless of the proposed uses of frailty as an indicator, palliative care and geriatrics have traditionally used this concept, although with different perspectives.8 In the setting of palliative care, frailty has equated to the third end-of-life trajectory and defined as the gradual decline in physical function, typically associated with dementia.13 14 In contrast, from the geriatric perspective, frailty is rather a multidimensional clinical entity defined as a vulnerability state against stressing factors due to limited compensatory mechanisms.15 Of the multiple instruments developed to assess frailty, frailty indexes (ie, the ratio between accumulated deficits in a given person and the total possible deficits) may have utility in identifying people with frailty for end-of-life care across all disease groups.8 16
A better understanding of how to provide the best palliative care for frail older people has become an international priority17 and, considering the increased difficulty of identifying dying people in very old age (>85 years),18–20 the concept of frailty is increasingly acknowledged as a cornerstone in the assessment and care of persons in an end-of-life situation and needing palliative care.15 21 However, a consensus on how to use the concept of frailty to provide palliative care to end-of-life people (EOLp) remains to be established.15 22 23 In this study, aimed at improving the care of end-of-life older people, we assessed the degree of frailty in a geriatric cohort with different advanced diseases and its relationship with end-of-life illness trajectories and survival.
Methods
Study design and participants
This was a prospective, observational study, including all patients admitted to the Acute Geriatric Unit (AGU) at the University Hospital of Vic (Barcelona, Spain) during 12 consecutive months (January 2014–January 2015). The University Hospital of Vic is a 200-bed acute care hospital covering a population area of 156 000 inhabitants. Admission criteria to the AGU, which were the criteria for inclusion in this study, were age ≥85 years, cognitive decline and/or end-of-life situation; no exclusion criteria were defined. The methods, including study design, variables, data sources and study size, have been described in a previous study.24 Of the patients included in this study (ie, those admitted to the AGU), those identified as non-end-of-life were included in a control group of patients aged ≥85 years and/or with cognitive decline. The results of this subanalysis are reported according to the Strengthening the Reporting of Observational Studies in Epidemiology (STROBE) recommendations.25 All patients and family relatives of patients with advanced dementia situation (Global Deterioration Scale (GDS)≥6) signed the written informed consent for participation before any data were recorded.
Patient and public involvement
This research was done without patient involvement. Patients were not invited to comment on the study design and were not consulted to develop patient relevant outcomes or interpret the results. Patients were not invited to contribute to the writing or editing of this document for readability or accuracy.
Variables and data sources
Frailty was assessed using the Frail-VIG index, a tool consisting of 22 questions to assess 25 deficits commonly associated with age and adverse health outcomes, based on the cumulative deficit model of frailty. Fifteen of the 22 questions refer to chronic conditions, including geriatric conditions and syndromes. The Frail-VIG index (‘VIG’ is the Spanish/Catalan abbreviation for CGA (Comprehensive Geriatric Assessment)) is a continuous variable expressed as a score ranging from 0 to 1. To simplify the representation of the survival curves, Frail-VIG index scores were expressed as a categorical variable classified into four groups according to the degree of frailty: no frailty (Frail-VIG index score <0.2), mild frailty (Frail-VIG index score 0.2–0.35), moderate frailty (Frail-VIG index score 0.36–0.5) and advanced frailty (Frail-VIG index score >0.5). In addition to its predictive value, previous studies have shown the content, construct, criteria and convergent-divergent construct validity of the Frail-VIG index.24 26–28 EOLp were identified using the NECPAL (NECesidades PALiativas, palliative care needs) tool, a validated tool for the early identification of the need for palliative care among individuals with limited life expectancy.29–31 EOLp were classified into the three archetypal end-of-life trajectories according to the severity and/or progression criteria for their main underlying disease: cancer, organ failure (including chronic pulmonary disease, chronic heart disease, serious chronic liver disease and serious chronic renal disease) and dementia (including other chronic neurological diseases). People with palliative care needs without a predominant advanced disease were identified as ‘multimorbidity’ group or trajectory, since all had two or more underlying chronic conditions.
After inclusion of the last patient in the study (ie, last admitted patient in the AGU before 15 January 2015) and before starting data analysis in 2017, patients were followed for up to 24 months (2015–beginning 2017). Information regarding the patient status after the 24-month follow-up period was obtained from the Shared Medical Record in Catalonia (HC3), a sole electronic database accessible to all healthcare providers in Catalonia that allows healthcare professionals to reliably determine whether a patient is ‘active’ (alive) or deceased (including date of death).32
Statistical analysis
Qualitative variables were presented as frequencies and percentages, whereas quantitative variables were presented as the mean and SD. Qualitative variables were compared using the Pearson’s χ2 test. In the complete cohort, the concordance between Frail-VIG index score and survival was evaluated using the C-statistics, and the Kaplan-Meier estimator was used to plot survival curves for the four frailty degree subgroups, which were compared using the log-rank test. In the group of people identified as end-of-life, survival curves for each illness trajectory were plotted using the Kaplan-Meier estimator and were compared using the log-rank test. A Cox proportional hazards model with the interaction between Frail-VIG index score and illness trajectories was calculated. Details of the construction of the Cox proportional hazards model and calculation of the HRs are provided in the online supplemental material file. The assumption of proportional hazards was checked using the Schoenfeld residuals and a goodness-of-fit test.
Supplemental material
The Receiver Operating Characteristic (ROC) curves were used to assess the ability of the Frail-VIG index to predict survival at 1 and 2 years by measuring their area under the receiver-operating curve (AUC) for the different illness trajectories. The significance level for all analyses was set at a two-sided α=0.05. The descriptive statistics analysis of the variables was performed using the SPSS software program version 24 (IBM), and the survival analysis was performed using the survival and pROC packages from the R project (https://www.r-project.org).
Results
Patient characteristics and end-of-life status
The study included 590 patients with a mean (SD, range) age of 86.4 (5.6, 48–105) years, of whom 339 (57.5%) were female. Based on the Frail-VIG index scores, 543 (92%) patients showed some degree of frailty, with 111 (18.8%), 207 (35.1%) and 225 (38.1%) patients showing mild, moderate and advanced frailty, respectively. Of the 590 patients included, 53 (8.9%) died during hospitalisation, and 330 (55.9%) and 260 (44.1%) were identified as non-EOLp and EOLp, respectively. Of the 260 EOLp, 31 (11.9%), 79 (30.4%), 86 (33.1%) and 64 (24.6%) were classified in cancer, organ failure, dementia and multimorbidity illness trajectories, respectively.
Relationship between end-of-life status and patient characteristics
EOLp and non-EOLp had similar mean age and sex frequencies, but differed in the distribution among the four frailty groups: all EOLp (260) and 283 (85.8%) of the 330 non-EOLp were frail to some extent, with 252 (96.9%) and 180 (54.5%) showing moderate or advanced frailty in the EOLp and non-EOLp groups, respectively. Table 1 summarises the frequencies of EOLp and non-EOLp across the various frailty categories and their main demographic characteristics.
Classification of study patients according to the Frail-VIG index scores, demographic characteristics and end-of-life status (N=590)
Correspondingly, median Frail-VIG index scores were significantly higher in EOLp compared with non-EOLp: 0.56 and 0.36, respectively (p<0.001). In EOLp, the predominant frailty degree was persistently advanced for all end-of-life trajectory categories: cancer, organ failure, dementia and multimorbidity (range 68%–75%) (table 2). All EOLp in the multimorbidity trajectory (n=64) were classified in the moderate and advanced frailty groups.
Classification of end-of-life people according to demographic characteristics, Frail-VIG index scores and end-of-life trajectory (n=260), n (%)
Relationship between frailty degree and survival
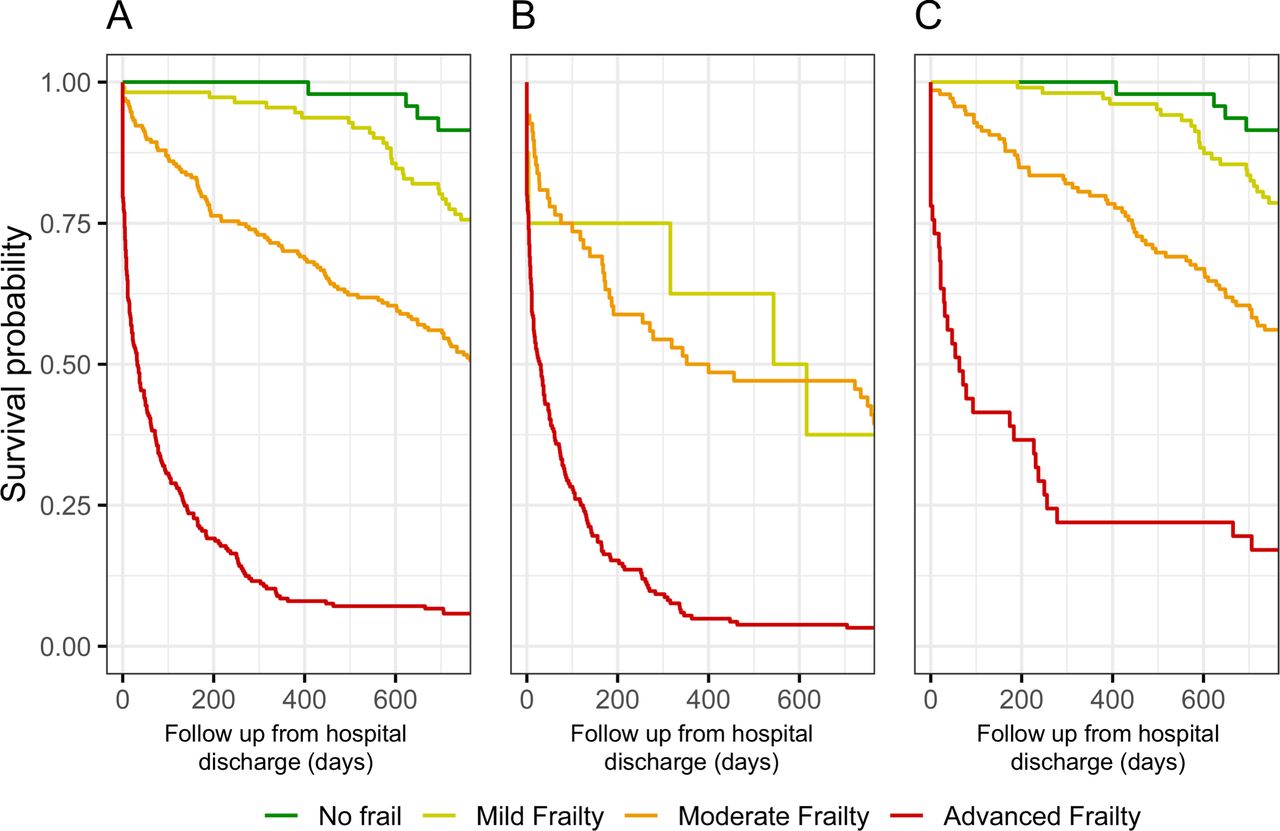
Of the complete cohort (EOLp and non-EOLp), 338 (57.3%) study patients died during the 2-year follow-up period. Mortality was significantly higher in EOLp than in non-EOLp: 220 (84.6%) and 118 (35.7%), respectively (p<0.001). The log-rank test comparing the survival curves of each frailty degree revealed significant differences in the overall population (χ2=423, p<0.0001), EOLp (χ2=69.9, p<0.0001) and non-EOLp (χ2=122, p<0.0001) (figure 1). Correspondingly, the C coefficient for concordance between the survival time and the Frail-VIG score was 0.8, indicating that higher scores of the Frail-VIG index are associated with lower survival.

Survival according to the degree of frailty in (A) the total study patients, (B) end-of-life people and (C) non-end-of-life people.
Relationship between frailty degree and survival in EOLp
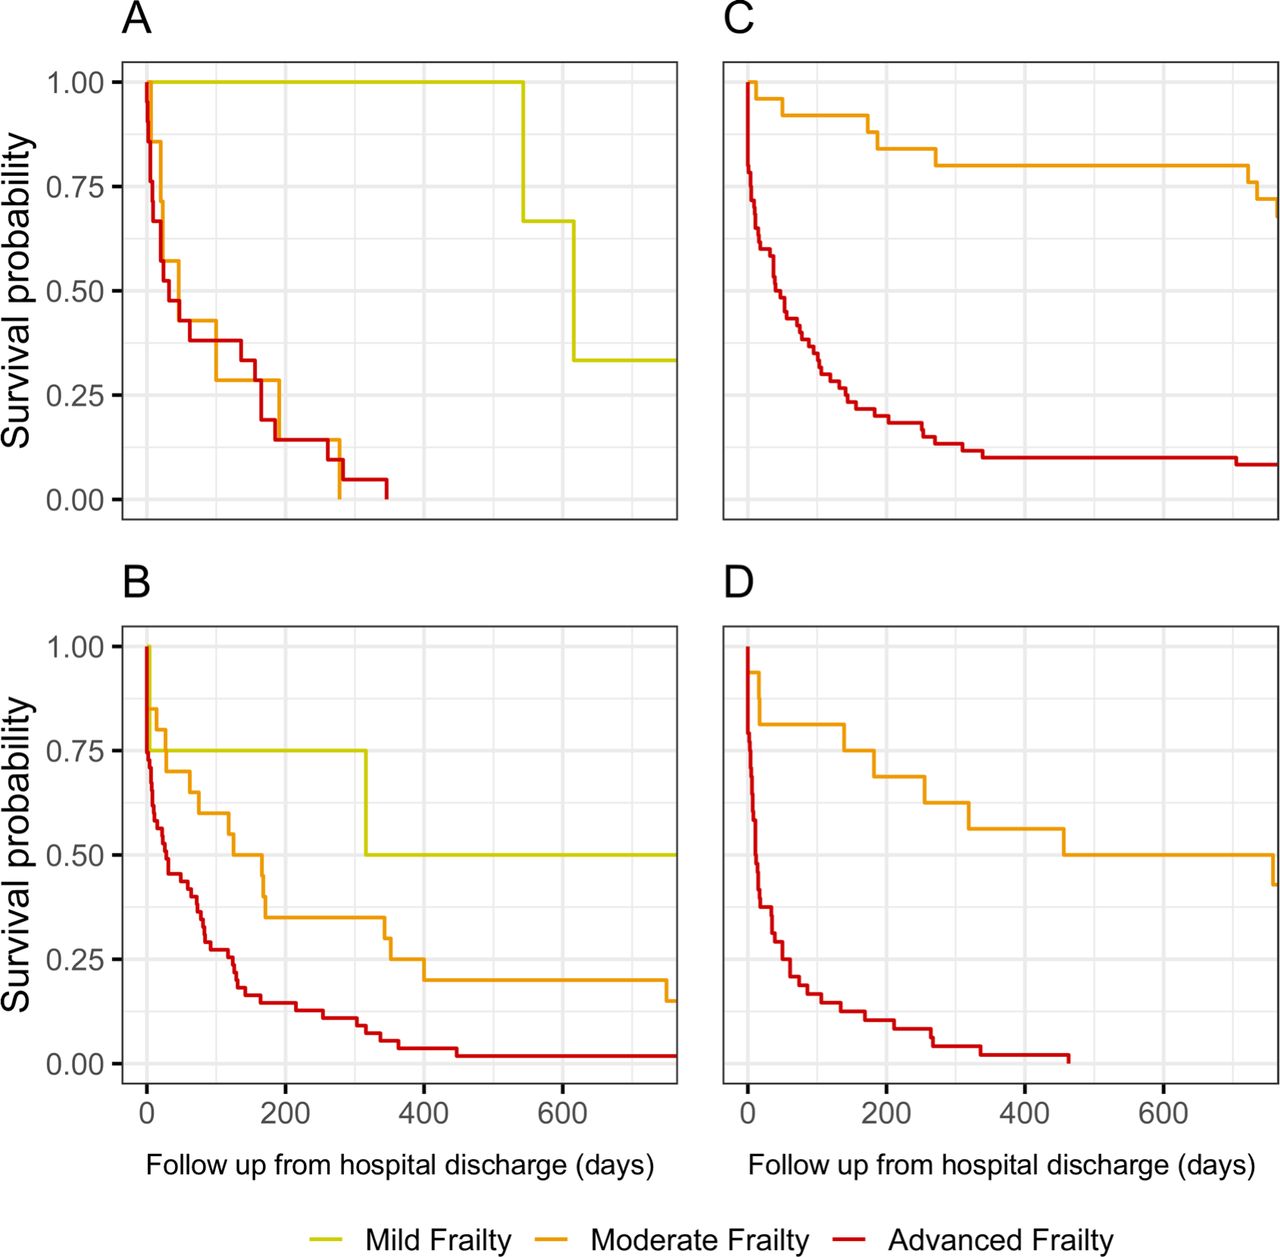
The frequencies of death at the end of the 2-year follow-up period for each trajectory in EOLp are presented in table 3. Survival curves, plotted using the Kaplan-Meier model for each frailty category (ie, mild, intermediate and advanced), differed among the different end-of-life trajectories, revealing different patterns of survival decline according to the frailty degree (figure 2).
Status of end-of-life people according to the Frail-VIG index scores and end-of-life trajectory after the 2-year follow-up (n=260), n (%)

Survival according to the degree of frailty and end-of-life trajectory: (A) cancer, (B) organ failure, (C) dementia and (D) multimorbidity.

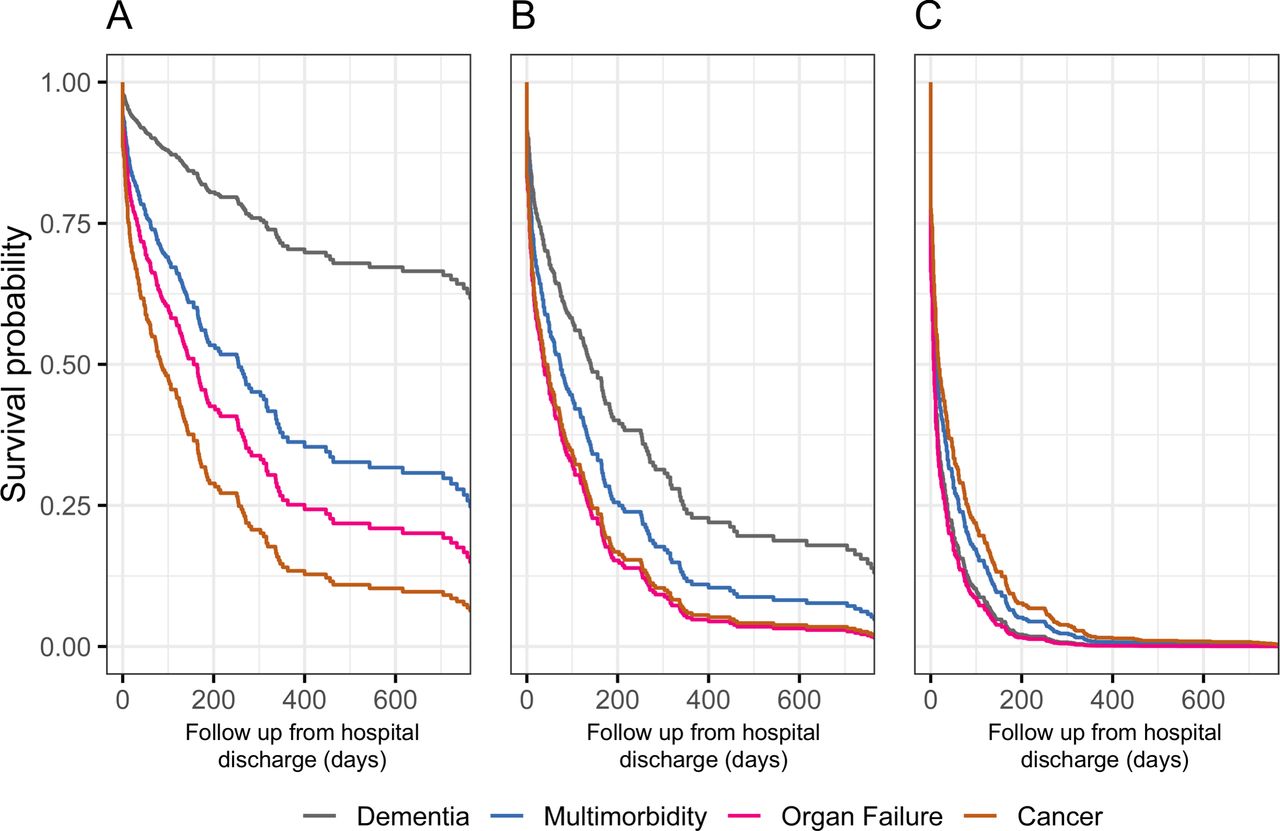
Survival probability of end-of-life people in the different illness trajectories according to Frail-VIG index value: Frail-VIG index 0.44 (15th percentile) (A), Frail-VIG index 0.56 (median) (B) and Frail-VIG index 0.68 (90th percentile) (C).
A Cox regression model with the interaction between Frail-VIG index and illness trajectories revealed that the effect of the frailty degree on survival was associated with illness trajectories (p<0.01 for all the coefficients), even though the influence of illness trajectory progressively decreased as the frailty degree increased (Figure 3 and online supplemental table S1). Sex and age were excluded as covariates due to their lack of statistical significance (online supplemental table S2 and S3). The proportional hazard assumption was supported by the Schoenfeld residuals (p>0.1 for both global and each covariate tests). The estimated HRs were 1.61 for people with dementia (95% CI 1.43 to 1.81), 1.30 for people with organ failure (95% CI 1.18 to 1.43), 1.30 for people with multimorbidity (95% CI 1.18 to 1.42) and 1.13 for people with cancer (95% CI 1.02 to 1.25) (online supplemental table S4 and S5). These results show that for each additional deficit of the total of 25 deficits assessed (ie, a 0.04 increase in the Frail-VIG index), the risk of death increased by 61.5%, 30.1%, 29.6% and 12.9% in people with dementia, organ failure, multimorbidity and cancer, respectively.
The ROC analysis of the Frail-VIG index for the EOLp showed an AUC of 0.87 (95% CI 0.83 to 0.92) after 1 year and 0.87 (95% CI 0.84 to 0.92) after 2 years of follow-up. Of the 184 EOLp with advanced frailty (Frail-VIG index score >0.5), 178 (96.7%) had died at 2 years of follow-up. The AUC differed among each of the four end-of-life trajectories: cancer (1 and 0.93), organ failure (0.86 and 0.90), dementia (0.92 and 0.92) and multimorbidity (0.91 and 0.94), after 1 and 2 years of follow-up, respectively. Despite these differences, the AUC remained high irrespective of the illness trajectory. Regarding the sensitivity and specificity of the Frail-VIG index as prognosis factor of mortality, the most sensitive and specific cut-off was 0.5 at both 1 and 2 years after follow-up, showing a sensitivity of 0.81 and 0.85 and a specificity of 0.83 and 0.81, respectively.
Discussion
In this prospective, observational study including 590 patients admitted at an AGU, we found that all older patients were frail towards the end of life (the prevalence of moderate-to-advanced frailty was 97% among people within an end-of-life trajectory and 55% outside it). Furthermore, advanced frailty was the predominant frailty category (ranged 68%–75%) for all end-of-life trajectories: cancer, organ failure, dementia and multimorbidity. Overall, the Frail-VIG index had a high capacity to predict death at 1 and 2 years (AUC 0.87), although to a different extent for the end-of-life categories cancer, organ failure, dementia and multimorbidity (AUC was always >0.86 for mortality at either 1 or 2 years). This finding confirms the hypothesis that the degree of frailty is related to prognosis regardless of the illness trajectory.
The characteristics and outcomes of the cohort assessed in this study, which included all patients admitted to an AGU, were similar to those previously reported. All the persons assessed in this study had a Frail-VIG index score <0.8, similar to previous studies showing that the theoretical maximum score is 0.7. According to these studies, the accumulation of two-thirds of all possible deficits (Frailty index score >0.7) results in death due to the person’s inability to overcome more deficits, a phenomenon defined as system failure.33 34 Likewise, similar to previous studies in other populations, the mortality rate at 1–2 years in our cohort was nearly 100% for the EOLp with frailty index score >0.5.34 35
Furthermore, we provide evidence showing that the degree of frailty significantly influenced survival irrespective of the advanced illness and end-of-life trajectory. In spite of this general influence, the survival curves according to the frailty degree followed different patterns for the four end-of-life trajectories, enabling the description of different frailty or deficit accumulation end-of-life trajectories according to the main disease, specially in the absence of advanced frailty. As the frailty degree increased, differences between trajectories decreased, resulting in a trend towards a compression of survival curves in advanced frailty situations where mortality is very high irrespective of the main advanced illness and end-of-life trajectory. Thus, in EOLp with cancer, mortality rates were high regardless of the frailty degree (moderate or advanced), leading to the hypothesis, similar to recent studies, that patients with cancer have a catastrophic accumulation of deficits.36 In contrast, EOLp with dementia showed different mortality rates according to their frailty degree and died progressively, likely due to the natural history of the disease, suggesting a slower accumulation of deficits. People with multimorbidity and advanced frailty shows a survival profile similar to people with cancer, while those with moderate frailty have a survival rate more similar to people with dementia. Finally, persons with an organ disease would accumulate deficits in episodes, even though prospective studies with serial frailty indexes would be required to test this hypothesis.
In this regard, similar to recent studies describing different trajectories according to the evolution of the social, spiritual or psychological situation of EOLp,3 prospective studies following the degree of frailty using electronic frailty indexes have described three different trajectories (ie, rapidly rising frailty, moderately increasing frailty and stable frailty).36 Even though more studies would be required to describe different end-of-life frailty trajectories, the fact that each end-of-life trajectory resulted in different mortality curves supports a dynamic view of EOLp.
The traditional association of frailty to the ‘third end-of-life trajectory’ (ie, dementia)13 14 has probably been influenced by the lack of specific prognostic instruments for persons in this trajectory, unlike those in the cancer37 38 or organ disease39 40 trajectories. Our results regarding the high prevalence of frailty in all end-of-life trajectories support the validity of the concept that frailty may be present in all trajectories beyond the dementia trajectory. In addition to expanding the concept of frailty, our study underscores the need to consider a further development of the end-of-life trajectories. Of the 260 people who were identified as people in end-of-life situation, 24.6% did not have severity criteria for a single disease, although all of them had at least two chronic conditions. The identification of this cluster of people with advanced frailty and multimorbidity can help provide them early palliative care, and the benefits derived from it.41 42
Frailty indices based on a Comprehensive Geriatric Assessment, such as the Frail-VIG index, may help professionals address one of the current challenges in palliative care18 19 43: the identification, assessment and management of older people (ie, aged >80 years) with palliative care needs.20 44 First, assessment and quantification of frailty degree, which is suitable to synthesise the results of a multidimensional evaluation, can be useful to validate the identification of people in an end-of-life situation12; second, due to its ability to discriminate between different degrees of severity, frailty indexes can be very useful to healthcare professionals for the situational diagnosis of the first and second end-of-life transition,6 12 and monitorisation of EOLp evolution45 46; and finally, quantification of frailty would enable palliative care customisation47 48 and engage people, caregivers and healthcare professionals in sharing decision-making and advance care planning.
The results of this study should be interpreted in the context of some limitations, particularly regarding the generalisability of the results. First, the recruitment strategy based on an AGU solely enriched our study sample with older patients, likely precluding the applicability of these study results to younger patients. Second, the analysis of EOLp frailty across the various end-of-life trajectory categories importantly reduced the number of patients in each group, thus limiting the statistical power of these analyses. However, despite the reduced number of patients in some groups, our analysis yielded statistically significant results. In spite of its limitations, to our knowledge, this study is the first to evaluate the degree of frailty using a frailty index in very old patients identified as EOLp. Frailty was evaluated in a cohort of geriatric patients, including EOLp and non-EOLp, and the data for this study were collected during routine geriatric assessment, as opposed to previous studies that used electronic health record data to evaluate the degree of frailty.49 Moreover, the single computer information system of Catalonia (HC3) that collects the medical records and mortality status of all patients reported by all health providers prevented loss of patients up to follow-up.32 Consequently, the lack of missing data due to the HC3 system, along with the use of standard and validated tools to identify EOLp (NECPAL) and to measure frailty (Frail-VIG index), increased the accuracy of the results obtained from this study. The early identification of people needing palliative care and the more accurate definition of the various end-of-life trajectories opened the door to a novel perspective of palliative care.50 In this regard, the use of frailty as an overarching concept in the assessment of all people in an end-of-life situation—at least of those with a multimorbid profile—might contribute to go one step further in this novel approach to palliative care.
Conclusions
Our results showed that all EOLp were frail (mostly with advanced frailty) irrespective of the end-of-life trajectory. Their degree of frailty, measured using the Frail-VIG index, influenced mortality. This indicates a close relationship between frailty, end-of-life status and mortality for all people who die. Measuring frailty using a frailty index could be useful in routine practice for healthcare professionals to understand the heterogeneous nature of people needing palliative care and tailor their care to the patient’s needs. The survival pattern of people with multimorbidity could support the description of a composite illness trajectory for this patient group.
Data availability statement
The data supporting the findings from this study are available from the corresponding author (JA-N) on reasonable request.
Ethics statements
Ethics approval
All patients and family relatives of patients with advanced dementia situation (GDS≥6) signed the written informed consent for participation before any data was recorded. The study protocol was approved by the Ethics Committee of the University Hospital of Vic (2,014,850 PR80). This study was conducted in accordance with the Helsinki Declaration and the local Personal Data Protection Law (LOPD 15/1999).
Acknowledgments
The authors would like to acknowledge i2e3 Biomedical Research Institute for providing medical writing assistance.
References
Supplementary materials
Supplementary Data
This web only file has been produced by the BMJ Publishing Group from an electronic file supplied by the author(s) and has not been edited for content.
Footnotes
Twitter @jordiamblas, @scottamurrayed
Contributors JA-N, AT, JCM and XG-B were responsible for the conception and design of the study. JA-N coordinated and substantially contributed to the data collection. JCM and RO performed the statistical analysis. All authors (JA-N, SAM, AT, JCM, SM, RO, NL-V, JE, SJS and XG-B) were involved in interpretation of data. JA-N wrote the initial draft of the manuscript and all the other authors (SAM, AT, JCM, SM, RO, NL-V, JE, SJS and XG-B) critically revised the manuscript. All authors (JA-N, SAM, AT, JCM, SM, RO, NL-V, JE, SJS and XG-B) have provided approval for the final version of the manuscript submitted for publication and agree to be accountable for all aspects of the work.
Funding This study was funded by the Instituto de Salud Carlos III (ISCIII) 17/02240 grant.
Competing interests None declared.
Provenance and peer review Not commissioned; externally peer reviewed.
Supplemental material This content has been supplied by the author(s). It has not been vetted by BMJ Publishing Group Limited (BMJ) and may not have been peer-reviewed. Any opinions or recommendations discussed are solely those of the author(s) and are not endorsed by BMJ. BMJ disclaims all liability and responsibility arising from any reliance placed on the content. Where the content includes any translated material, BMJ does not warrant the accuracy and reliability of the translations (including but not limited to local regulations, clinical guidelines, terminology, drug names and drug dosages), and is not responsible for any error and/or omissions arising from translation and adaptation or otherwise.