Article Text

Abstract
Objectives To identify recent trends in chronic kidney disease (CKD) prevalence in England and explore their association with changes in sociodemographic, behavioural and clinical factors.
Design Pooled cross-sectional analysis.
Setting Health Survey for England 2003, 2009/2010 combined and 2016.
Participants 17 663 individuals (aged 16+) living in private households.
Primary and secondary outcome measures Prevalence of estimated glomerular filtration rate (eGFR) <60 mL/min/1.73 m2 and albuminuria (measured by albumin–creatinine ratio) during 2009/2010 and 2016 and trends in eGFR between 2003 and 2016. eGFR was estimated using serum creatinine Chronic Kidney Disease Epidemiology Collaboration and Modification of Diet in Renal Disease equations.
Results GFR <60 mL/min/1.73 m2 prevalence was 7.7% (95% CI 7.1% to 8.4%), 7.0% (6.4% to 7.7%) and 7.3%(6.5% to 8.2%) in 2003, 2009/2010 and 2016, respectively. Albuminuria prevalence was 8.7% (8.1% to 9.5%) in 2009/2010 and 9.8% (8.7% to 10.9%) in 2016. Prevalence of CKD G1-5 (eGFR <60 mL/min/1.73 m2 or albuminuria) was 12.6% (11.8% to 13.4%) in 2009/2010 and 13.9% (12.8% to 15.2%) in 2016. Prevalence of diabetes and obesity increased during 2003–2016 while prevalence of hypertension and smoking fell. The age-adjusted and gender-adjusted OR of eGFR <60 mL/min/1.73 m2 for 2016 versus 2009/2010 was 0.99 (0.82 to 1.18) and fully adjusted OR was 1.13 (0.93 to 1.37). There was no significant period effect on the prevalence of albuminuria or CKD G1-5 from 2009/2010 to 2016 in age and gender or fully adjusted models.
Conclusion The fall in eGFR <60 mL/min/1.73 m2 seen from 2003 to 2009/2010 did not continue to 2016. However, absolute CKD burden is likely to rise with population growth and ageing, particularly if diabetes prevalence continues to increase. This highlights the need for greater CKD prevention efforts and continued surveillance.
- epidemiology
- chronic renal failure
- public health
This is an open access article distributed in accordance with the Creative Commons Attribution Non Commercial (CC BY-NC 4.0) license, which permits others to distribute, remix, adapt, build upon this work non-commercially, and license their derivative works on different terms, provided the original work is properly cited, appropriate credit is given, any changes made indicated, and the use is non-commercial. See: http://creativecommons.org/licenses/by-nc/4.0/.
Statistics from Altmetric.com
Strengths and limitations of this study
The study is based on robust survey methodology using standardised protocols over time and taking into account complex survey design to reduce response bias.
Prevalence may be underestimated as residential care and hospitalised patients were excluded.
Single measures of serum creatinine and albumin to creatinine ratio so no chronicity established.
Introduction
Chronic kidney disease (CKD), defined and staged using estimated glomerular filtration rate (eGFR) and indicators of kidney damage such as albuminuria,1 is a global public health problem with high economic cost, morbidity and mortality.2–4 The Global Burden of Disease study has shown rising global impact, largely due to population growth and ageing.4
It is important to assess trends in CKD to inform prevention and healthcare planning. There are variable data on CKD time trends. In the UK, CKD G3-5 prevalence fell in England between 2003 and 2009/2010 while remaining stable in Scotland between 2004 and 2009/2010.5 6 US studies using the National Health and Nutrition Examination (NHANES) found an increase in CKD prevalence from 1988 to 2004, followed by stabilisation between 2003/2004 and 2011/2012.7 8 Other studies found CKD prevalence increased in Japan from 1974 to 2002 and in Finland between 2002 and 2007; remained stable in Norway from 1995 to 2008 and decreased in Korea from 2005 to 2007.9–12 These differences in time patterns may reflect true changes, random variation or be a result of methodological and analytical differences across studies. Some projection studies have suggested an increase in CKD burden in the coming decade and beyond, which may be expected given the continued rise in obesity and diabetes prevalence, and ageing population.13–15
There is a lack of studies assessing CKD prevalence in recent years. It is important to examine if the earlier fall in CKD prevalence in the UK has continued and to investigate changes in albuminuria prevalence, given its prognostic importance.16 This study extends previous analyses between 2003 and 2009/2010 to examine time trends in CKD prevalence in England using the nationally representative Health Survey for England (HSE) in 2016, and to what extent any changes were explained by demographic and risk factor changes.
Materials and methods
Study population
The HSE is an annual survey of a nationally representative sample of individuals living in private households in England. The survey, conducted by trained interviewers, collects detailed information on sociodemographic characteristics, physical health, lifestyle behaviours, mental health and well-being, and anthropometric measurements, in order to explore changes in the health and lifestyles of people in England. This is supplemented with clinical assessment by trained nurses (eg, for blood pressure (BP), medication) and with blood and urine sampling. Kidney function tests were measured in adults (aged 16+) in 2003 (serum creatinine from stored samples, 2009/2010 and 2016 (serum creatinine, cystatin C and urinary albumin/creatinine ratio (ACR)).
Survey participants were selected each year using a multistage stratified probability sampling design. Full details of the methodology including sample design, response rates and weighting can be found in the 2003, 2009, 2010 and 2016 Health Survey Reports.17–20 There were household response rates of 73%, 68%, 66% and 55% for the 2003, 2009, 2010 and 2016 HSE, respectively. A total of 14 836 adults were interviewed in the 2003 HSE, 4645 adults in 2009, 8420 in 2010 and 8011 in 2016.
The current study uses data from participants aged ≥16 years who had valid serum creatinine or valid urine creatinine and albumin test results. The population for the current study was 17 633 individuals which included 7844/14 836 (53%), 6053/13 065 (46%) and 3766/8011 (47%) individuals from the 2003, 2009/2010 and 2016 HSE, respectively for analyses using creatinine. Analyses for albuminuria used all available data at each time point and comprised 7633 and 4361 individuals from the 2009/2010 and 2016 HSE, respectively. Since HSE 2009 and 2010 were conducted at close time points, data from these surveys were combined to increase sample study sample size, allowing sufficient power to conduct the analyses, as was done in a previous study.5 Each survey year consisted of a new sample of participants and there was no double counting in our sample.
Kidney function measures
Serum creatinine was assayed using an isotope dilution mass spectrometry traceable enzymatic assay on a Roche Modular analyser in 2009/2010 and on a Roche Cobas analyser in 2016 in a single laboratory: the Clinical Biochemistry Department at the Royal Victoria Infirmary (RVI), Newcastle upon Tyne. Details of laboratory analysis, internal quality control and external quality assurance are provided in the 2009/2010 and 2016 documentation.18–20 The same methods were applied to the 2003 HSE samples. The 2003 HSE samples had been stored, frozen at −40°C and then thawed for measurement in 2010. A correction factor was applied to 2003 samples to account for the effect of freezing on creatinine levels.5 A conversion equation derived by scientists at the RVI was then applied to the corrected 2003 creatinine values, as well as 2009 and 2010 samples, to account for differences in analysers between earlier years and 2016 and allow direct comparisons. Serum creatinine concentration was used to estimate GFR using the Chronic Kidney Disease Epidemiology Collaboration (CKDEPI) equations.21 eGFR is categorised as <60 mL/min/1.73 m2 (CKD G3-5) and <45 mL/min/1.73 m2 (G3b-5). The CKDEPI equation was used as this is more accurate than the Modification of Diet in Renal Disease (MDRD) equation and is recommended for use in the UK.22
Albuminuria was measured on a single random urine sample at the RVI. Urine albumin was measured by immunoassay (on a Siemens Nephelometer analyser in 2009, on a Roche Modular analyser in 2010 and on a Roche Cobas analyser in 2016). Urine creatinine was measured by colorimetric assay (Jaffe method on an Olympus analyser, Jaffe method on a Roche Modular analyser and enzymatic method on a Roche Cobas analyser in 2009, 2010 and 2016, respectively). Conversion equations (derived at the RVI) were applied to 2009 and 2010 urinary albumin and creatinine values to account for changes in analysers between 2009/2010 and 2016. Albuminuria was defined as urinary albumin to creatinine ratio (uACR) >3 mg/mmol.23
CKD G1-5 was defined as eGFR <60 and/or albuminuria and categorised as moderate, high or very high risk based on combinations of eGFR and uACR in the Kidney Disease Improving Global Outcomes (KDIGO) classification system.23
Sociodemographic characteristics
Age was grouped into five categories: 16–34, 35–54, 55–64, 65–74 and 75+ years. Ethnicity was grouped into four categories: white, South Asian, black and other. Socioeconomic factors included occupation, car ownership and housing tenure. Occupation was classified using National Statistics Socioeconomic Classification (NS-SEC) and grouped into three categories: high (managerial and professional occupations), middle (intermediate occupations) and low (routine and manual occupations). Housing tenure was divided into two groups: owner and rented. Education was grouped as degree level (NVQ4/NVQ5/degree or equivalent), below degree and no qualification.
Clinical and behavioural variables
Clinical and behavioural factors included smoking (never, ex-smoker, current smoker) and body mass index (BMI; normal/underweight (<25 kg/m2), overweight (25–29.9 kg/m2), obese (≥30 kg/m2), waist circumference (low: <94 cm for men, <80 cm for women; high: 94–102 cm for men, 80–88 cm women; very high: >102 cm for men, >88 cm for women). For South Asian men, the waist circumference was classified as: low: <90; high: 90–102 and very high: >102 cm.24
Clinical variables included cholesterol level (high-density lipoprotein (HDL) and total cholesterol) from non-fasting blood samples; self-reported doctor-diagnosed diabetes, survey-diagnosed diabetes (glycated haemoglobin (HBA1c) ≥6.5% at nurse survey examination in those not reporting a diagnosis), total diabetes (doctor + survey diagnosed); self-reported doctor-diagnosed hypertension, survey-diagnosed hypertension (systolic BP ≥140 mm Hg and/or diastolic ≥90 mm Hg in those not reporting a doctor diagnosis or on medication for hypertension at the survey examination),19 and total (doctor + survey diagnosed) hypertension. Self-reported prescribed medication was any antihypertensive medication or lipid lowering agents.
Where blood pressure was not raised but antihypertensive medication data were missing, we assumed such participants did not have hypertension.
Statistics
Descriptive statistics were used to compare sociodemographic, clinical and behavioural characteristics, and kidney function measures over time, both between 2009/2010 and 2016 and a trend for 2003–2016. χ2 tests were used to test differences for categorical variables and Somers’ D rank tests were used to test for non-normally distributed continuous variables. Normally distributed variables, including total and HDL cholesterol levels, were compared using t-tests.
Multivariable logistic regression models (including age and gender) were used to examine associations between CKD G3-5 (eGFR <60 mL/min/1.73 m2) and time period (fitted as 2003, 2009/2010 and 2016), sociodemographic, clinical and behavioural variables. Similar models were applied to CKD G1-5 and albuminuria. We used complete case analysis for the primary modelling as the extent of missing data was below 10% for any variable.25 We repeated the analysis using all available data in each regression model, rather than complete case analysis.
All analyses were conducted using STATA V.14 SE and took account of the complex sampling method (including stratification and clustering due to the two-stage sampling design) and sampling weights (blood or urine as appropriate, which incorporate non-response at all stages including interview and nurse assessment to address differences in subpopulations and maintain national representativeness) through the use of the survey data commands.
Patient and public involvement (PPI)
We did not directly include PPI in this study.
Results
The study population consisted of 17 663 adults with serum creatinine test results and 11 994 adults with valid urinary creatinine and albumin test results.
Survey characteristics
Gender and car ownership distribution were similar, while the proportion of people with older age, highest level of education, higher NS-SEC and diabetes (both doctor and survey diagnosed) increased from 2003 to 2016 (table 1). There was a decrease in the proportion of people of white ethnicity, home owners, current smokers, doctor diagnosed and total hypertension. There were increases in median levels of glycated haemoglobin, HDL cholesterol, BMI and waist circumference and decreases in systolic and diastolic BP and total cholesterol over the time period, and the changes were present from 2009/2010 to 2016 (except for diastolic BP and BMI). There was an increase in the proportion of people with doctor-diagnosed CKD between 2009/2010 and 2016, though it remained low (table 1).
Change in proportion of sociodemographic, health and lifestyle variables between 2003, 2009/2010 and 2016
Kidney function measures
Table 2 shows that there were small increases in median serum creatinine levels and concomitant decreases in eGFR levels between 2003 and 2016, largely reflected in changes in the balance of eGFR <60–89 mL/min/1.73 m2 and >90 mL/min/1.73 m2. eGFR <60 mL/min/1.73m2 prevalence was 7.7% (95% CI 7.1% to 8.4%), 7.0% (6.4% to 7.7%) and 7.3% (6.5% to 8.2%) in 2003, 2009/2010 and 2016, respectively. Differences were not statistically significant. There was little change in eGFR <45 mL/min/1.73 m2.
Change in renal function markers between 2003, 2009/2010 and 2016
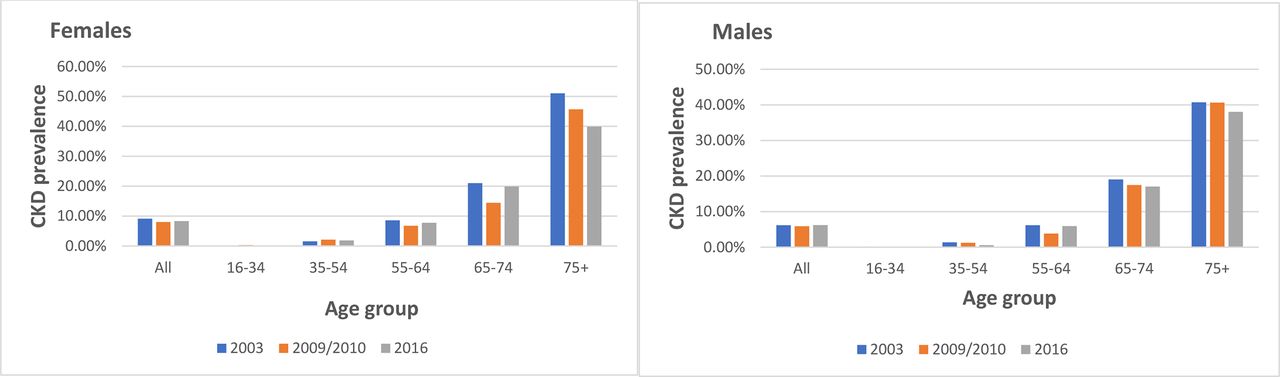
Figure 1 shows the pattern of eGFR <60 mL/min/1.73 m2 by age and gender from 2009/2010 to 2016. Women had a higher prevalence and consistent pattern of no change in any age group. The age pattern was more variable for men.

Changes in prevalence (weighted) of Chronic Kidney Disease (CKD) Epidemiology Collaboration serum creatinine estimated glomerular filtration rate <60 by age and gender 2009/2010–2016.
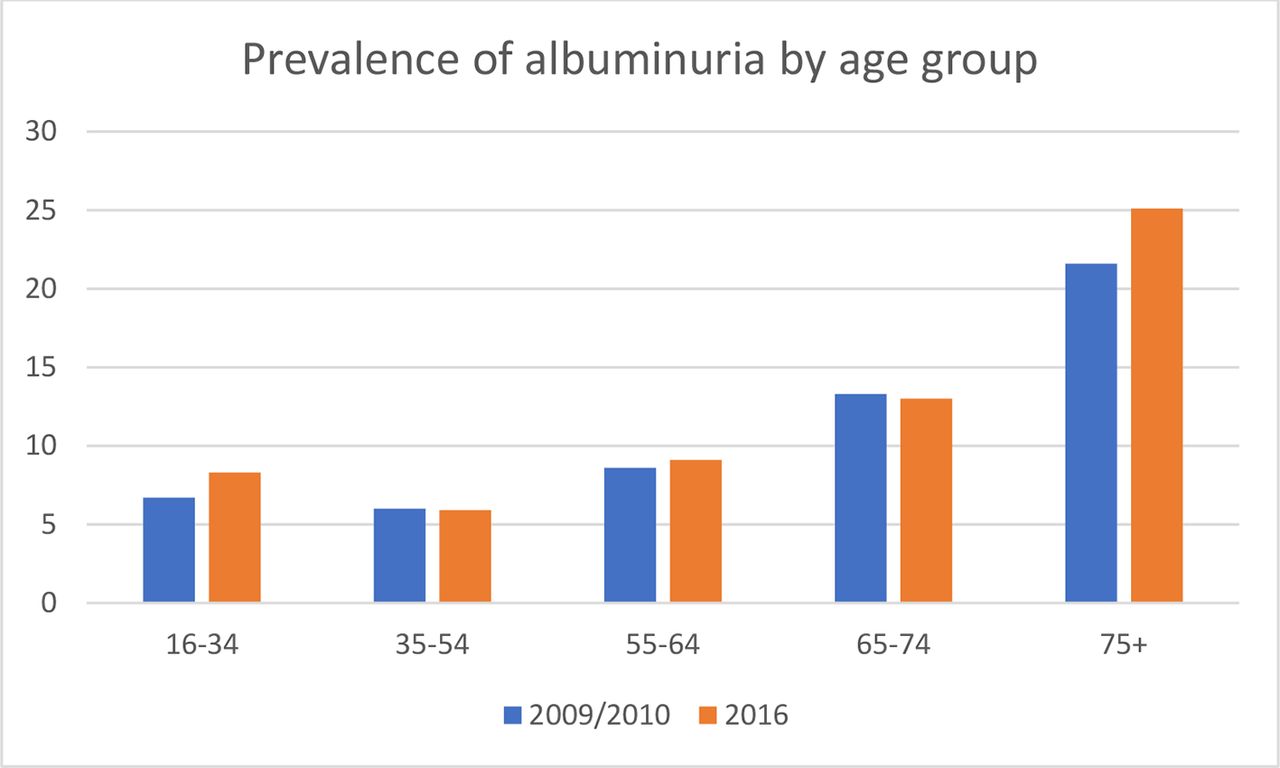
Albuminuria prevalence was 8.7% (8.1% to 9.5%) in 2009/2010 and 9.8% (8.7% to 10.9%) in 2016. This was not statistically significant and median urinary albumin levels fell (table 2). Albuminuria prevalence increased with age with a slight J shape (figure 2). In those with both urine and blood results across surveys, 88% of albuminuria was observed in people with eGFR >60 (85% in those aged 35 and over) and 16% had doctor diagnosed diabetes (21% in those over 35).
Changes in prevalence (weighted) of albuminuria by age group 2009/2010–2016.
Prevalence of CKD G1-5 was 12.6% (11.8% to 13.4%) in 2009/2010 and 13.9% (12.8% to 15.2%) in 2016 (table 2). There was no significant increase in CKD 1–5 prevalence overall or by any risk category, or by age group, diabetes status or obesity.
Multivariable analyses
Regression models showed no significant differences in risk of eGFR <60 mL/min/1.73 m2 for 2016 compared with 2009/2010 (table 3). The OR of having eGFR <60 mL/min/1.73 m2 in 2016 compared with 2009/2010 was 0.99 (0.82 to 1.18) in age- and gender-adjusted models and 1.13 (0.93 to 1.37) in fully adjusted models. There was no significant change in albuminuria prevalence in age-adjusted and gender-adjusted (OR: 1.05 (0.86 to 1.29)) or fully adjusted models (1.09 (0.88 to 1.36); table 4). The OR for having CKD 1–5 was 1.03 (0.87 to 1.21) in age-adjusted and gender-adjusted models and 1.10 (0.92 to 1.31) in fully adjusted models (table 5).
Prevalence of estimated glomerular filtration rate <60 mL/min/1.73 m2 by Chronic Kidney Disease (CKD) Epidemiology Collaboration creatinine equation over time with adjustment for sociodemographic, behavioural and clinical factors (N=16 118 in all models*)
Prevalence of albuminuria over time with adjustment for sociodemographic, behavioural and clinical factors (n=8312 in all models)
Prevalence of chronic kidney disease (CKD) 1–5 over time with adjustment for sociodemographic, behavioural and clinical factors (N=8326 in all models)
Sensitivity analyses using all available data for each model and outcome according to missing data found very similar results (online supplementary appendix 1). The period effect estimates in these models were consistent with the complete case models for all outcomes, though with narrower CIs due to the larger sample size and statistical power.
Supplemental material
Discussion
These nationally representative population-based studies in England have shown that the previous findings of a significant fall in CKD stage 3–5 prevalence from 2003 to 2009/2010 have not continued to 2016. There were no significant changes in prevalence of albuminuria and CKD G1-5 between 2009/10 and 2016.
Population risk factors for CKD changed in different directions in 2009/2010 to 2016, notably with increases in prevalence of diabetes, proportion at older age and decreases in hypertension and smoking. There were also changes in socioeconomic status and prevalence of ethnic minorities which could influence CKD prevalence.26 27The pattern of CKD prevalence is likely to reflect the balance of such countervailing CKD risk factors. Adjustment has been made for all these factors in assessing period changes in CKD prevalence.
A key finding for CKD prevention was the changes in population BP levels and hypertension prevalence which may partly be due to the decline in population salt consumption.28 29 Changes in BP management in patients with known hypertension may also be an important factor, which we did not directly address due to limited numbers in the surveys and incomplete antihypertensive medication details. The study period coincided with the introduction in 2006 of the Quality Outcomes Framework (QoF) in England (an incentivised system for performance management of patients with diabetes, hypertension and CKD), and the National Health Service (NHS) Health Check for 40–74 year olds (a national population programme with cardiovascular disease (CVD) risk factor assessment including BP measurement).30 31 A systematic review of the impact of QoF on long-term conditions found some limited evidence for improved care.32 The NHS Health Check led to small reductions in BP in non-randomised comparisons of NHS Health Check attendees and non-attendees and to increased prescription of antihypertensive agents.33 34
The increase in HDL cholesterol and decrease in total cholesterol over time may reflect the wider use of statins for the primary and secondary prevention of CVD. HDL was associated with reduced CKD prevalence in adjusted analyses, though the effect of statins in preventing CKD progression is uncertain.35–37
A countervailing driver that would increase population CKD levels is the rising prevalence of diabetes, both diagnosed and undiagnosed. For those with diagnosed diabetes, the National Diabetes Audit for 2016–2017 found slight improvement in HBA1c control (though it was poor overall in patients with type 1 diabetes, mirroring the QoF review findings.38 39 Urine ACR measurement was low in both types of diabetes and declined from 2011/2012 to 2016/2017 with large variation between general practices.38 The National CKD Audit also confirmed poor recording of uACR in patients with diabetes and CKD and found it to be even poorer in those with diagnosed hypertension.40 Lack of identification of albuminuria is of concern as it is a major risk factor for both CKD progression and incident CVD and there is effective treatment available with renin-angiotensin system (RAS) inhibition.41
To our knowledge, this study presents the most recent data on actual trends in CKD in a free-living general population. Murphy et al used serial US NHANES data from the late 1990s to 2012 and found that prevalence of CKD G3-4 and CKD G1-4 increased to the mid-2000s but then stabilised, overall and in age, gender, ethnic and diabetes subgroups except for non-Hispanic blacks.8 This was ascribed to improved management of both hypertension42 and diabetes despite rising diabetes prevalence per se.43 Hallan et al analysed the Health Survey of Nord –Trondelag (HUNT) from 1995–1997 to 2006–2008 and found that the prevalence of CKD G1-5 was stable, which was ascribed to improved BP control and to a lesser degree to lower total cholesterol (there was no change in HDL), and greater physical activity, offset by moderate increases in obesity and diabetes.11
The survey showed that estimated CKD prevalence was substantially higher than doctor-diagnosed CKD (the latter being 1.1%–1.8% for 2009/2010 and 2016, respectively). This may be due to lack of diagnosis (insufficient testing in the population), or patients have not been told or cannot recall being told by their doctor that they have CKD, as well as a small overestimation in the survey due to lack of confirmed chronicity.
Study strengths and limitations
Strengths of the study include the large, nationally representative population, as well as robust survey methodology using standardised protocols (including the same laboratory and use of conversion equations to account for changes in assays, analysers and methods over time). The complex survey design was taken into account and non-response blood/urine weights used to reduce response bias and ensure national representativeness. This is important, as overall HSE survey response rates have declined with time. Time trend analysis was able to take into account a range of sociodemographic, behavioural and clinical factors that were measured in a standardised way across the surveys. We were able to assess changes in uACR, which is often not measured in studies of CKD prevalence.
Limitations included the relatively short time period and fewer blood and urine samples in 2016, limiting the power of the study. Some data items were incomplete; there still is no consensus on exactly how multiple imputation should be used with survey weighted data especially when the weighting is complex and multistage as in HSE.44 Moreover, it is recommended that imputation is performed by the survey providers rather than secondary users. Another limitation was that the survey, as do all national health surveys, excluded those in residential care or hospitalised patients, which may include some individuals with CKD and therefore underestimates prevalence—especially of more severe CKD. On the other hand, CKD prevalence may have been overestimated as a single blood sample was tested in each survey, meaning chronicity of reduced eGFR levels could not be confirmed (as required by the KDIGO definition) and previous studies have found that fluctuations in creatinine can have a strong effect on CKD prevalence.45 Furthermore, an isolated low eGFR could represent an episode of acute kidney injury, though this is unlikely for participants of a health survey.A single uACR is also a poor indicator of albuminuria, as data from NHANES suggest a third of initially increased uACR results may be normal if repeat testing is performed.7 ACR was measured using a random sample rather than early morning urine which may increase prevalence (orthostatic proteinuria) especially in the young, women and those without hypertension or diabetes but this should not affect trends.46The cross-sectional nature of the survey is a limitation as it lacks chronicity and restricts the ability to infer any causal relationships from the associations identified. Although primary care databases are a suitable source of repeated measurements, testing per se and repeat testing are selective and restricted to those accessing healthcare and therefore findings may not be representative of the general population. Age was modelled as a categorical term and not linearly as data governance policy at the time of analyses precluded the availability of individual age data to download from the UK Data Archive, so given the strong effect of age it is possible that there is residual confounding. There were no data on prevalent CVD, a cause and consequence of CKD, so adjustment for trends in this was not possible. An important limitation was the lack of data on cystatin C-based eGFR trends. Estimation of GFR using an equation that includes serum creatinine and cystatin C gives a more accurate result than one based on creatinine alone.47 We measured cystatin C but the analysis suggested that differences in assay standardisation (non-standardised in 2009/2010 and standardised in 2016) accounted for a large rise observed in cystatin C concentration. The assessment of quality of care of key groups, such as those with diagnosed diabetes in HSE, was limited by numbers. There were limited data to assign likely cause(s) of CKD. Additionally, the analysis pertains to the adult population of England and may not be generalisable to other populations with different sociodemographic or underlying risk factor patterns. Finally, we used the correction factor for black ethnicity in the CKDEPI and MDRD equations to calculate eGFR. This may have introduced some bias as the correction factor was derived using US populations which may not be accurate for UK populations. However, our finding of lower prevalence of CKD in South Asian and African-Americans/Afro-Caribbean compared with Caucasians is consistent with studies that report ethnic minority groups having lower or similar CKD prevalence despite higher incidence of end-stage renal disease.48–50
The finding of stable CKD prevalence may have important implications globally due to the ascending rank of CKD as a leading Global Burden of Disease cause of disability-adjusted life years and projected population growth and ageing, both of which will increase absolute CKD prevalence.51 52 Greater efforts are needed to prevent eGFR decline both in the general population and in those with CKD to reduce CKD incidence and its progression, through hypertension prevention, detection and control, obesity and diabetes prevention, and better management of existing diabetes. The underascertainment of albuminuria in patients with diabetes is of concern and merits further efforts and consideration of testing in patients with hypertension.
Conclusion
In this nationally representative population-based study, the previously reported trend of decreasing CKD prevalence between 2003 and 2009/2010 did not continue to 2016 despite favourable changes in hypertension prevalence. Further studies in the HSE series including using cystatin C and albuminuria are needed to monitor and better understand CKD trends and assess prevention efforts, and better understand mechanisms of change.
References
Footnotes
Twitter @j_mindell
Author contributors PR and SF conceived the original study concept and design. HH conducted the statistical analyses and prepared the first draft of the manuscript. SH provided guidance and advice on statistical analyses and interpretation of the data. JSM coordinated the Health Surveys for England. JD conducted the laboratory analyses. All authors critically reviewed the paper; were involved in the drafting and approval of the final manuscript; and act as guarantors. All authors take responsibility for the data and research governance.
Funding HSE 2003 was funded by the Department of Health; HSE 2009, 2010 and 2016 were funded by the Health and Social Care Information Centre (now NHS Digital). This CKD work was funded by Kidney Research UK (KRUK), grant number: KRUK RP37/2015. This funding supported kidney function testing, data management and analyses.
Disclaimer KRUK was not involved in any other aspect of the project, such as the design of the project’s protocol and analysis plan, the collection and analyses. The funders had no input into the interpretation or publication of the study results.
Competing interests JSM reports grants from NHS Digital during the conduct of the study.
Patient consent for publication Not required.
Ethics approval Approval was obtained from the London Multi-Centre Research Ethics Committee for the 2003 survey (HSE 2003 ref MREC/02/2/72), the Oxford B Research Ethics Committee for both 2009 and 2010 surveys (HSE 2009 ref 08/H0605/103, HSE 2010 ref 09/H0605/73), and the East Midlands Nottingham 2 Research Ethics Committee (Reference no 15/EM/0254) for the 2016 survey.
Provenance and peer review Not commissioned; externally peer reviewed.
Data availability statement Data are available in a public, open access repository. The HSE 2003, 2009, 2010 and 2016 are archived with the UK Data Service. The Technical Appendix, statistical code and dataset are available from the corresponding author. Creatinine measurements for the HSE 2003 undertaken for this study will be archived in due course.