Article Text

Abstract
Objectives The vast majority of residents’ working time is spent away from patients. In hospital practice, many factors may influence the resident’s working day structure.
Using an innovative method, we aimed to compare working time allocation among internal medicine residents using time-motion observations. The first study goal was to describe how the method could be used for inter-hospital comparison. The secondary goal was to learn about specific differences in the resident’s working day structure in university and non-university hospital settings.
Design Two separate time-motion studies. Trained peer-observers followed the residents during weekday day shifts with a tablet, able to record 22 different activities and corresponding context (with patient, phone, colleague or computer).
Setting Internal medicine residencies at a university (May–July 2015) and a non-university (September–October 2016) community hospital.
Participants 28 residents (mean age: 29 years, average postgraduate training: 30 months) at university hospital, 21 residents (mean age: 30 years, average postgraduate training: 17 months) at non-university hospital.
Outcomes Time spent with patients and time dedicated to activities directly related to patients; description of main differences of time allocation between hospitals.
Results Cumulatively 1051 hours of observation (566 (university hospital)+486 (non-university hospital)) and 92 day shifts (49+43) were evaluated. Daily working time was 11.5 versus 11.3 hours. A median daily period of 195 min (IQR 179–211, 27.9%) and 116 min (IQR 98–134, 17.2%) (p<0.001) was dedicated to direct patient care, respectively.
Conclusions We successfully identified differences potentially related to each hospital structure and organisation. Inter-hospital comparisons could help set up interventions aiming to improve workday structure and experience of residents.
- internal medicine
- medical education & training
- health economics
This is an open access article distributed in accordance with the Creative Commons Attribution Non Commercial (CC BY-NC 4.0) license, which permits others to distribute, remix, adapt, build upon this work non-commercially, and license their derivative works on different terms, provided the original work is properly cited, appropriate credit is given, any changes made indicated, and the use is non-commercial. See: http://creativecommons.org/licenses/by-nc/4.0/.
Statistics from Altmetric.com
Strengths and limitations of this study
With 1051 hours of direct observation, this time-motion study is one of the largest of its kind and gives precise insights in the internal medicine resident’s working day.
Using a time-motion study design and a flexible tablet-based tool, differences regarding amount, duration and context of resident’s activities could be unravelled between two study sites.
A time-motion study design with peer observers produces objective and precise data as residents do not use their subjective resources for data acquisition and are only minimally disturbed by the observers.
Multiple factors can play a role in residents’ time allocation and in fine determine the differences observed between hospitals. Time-motion studies are a first step on the path for future organisational changes. Focus groups could help to find explanations regarding difference in residents’ allocation of time.
Introduction
The percentage of time residents spend directly with patients during a working day ranges between 9% and 28% internationally1–7 and can be as low as 7.7 min per patient and shift.5 Residents spend most time at work doing activities indirectly related to patients.8 For these indirect tasks, they use computers and electronic medical records (EMRs) up to 60% of the time for indirect tasks.6 9 10
To optimise and increase the percentage of time physicians spend for direct patient care, several approaches exist such as the implementation of doctor’s assistants or nurse care practitioners,11 medical scribes,12 novel and more user-friendly EMR systems13 and speech recognition technologies.14 However, to enhance the workflow and measure the effects of such approaches, detailed knowledge of the resident’s workday structure is crucial. Time-motion studies provide such objective data and could allow inter-hospital or inter-program comparisons, commonly named benchmarking. Such comparisons could help managers or staff physicians determine whether the approaches chosen to increase the percentage of time residents spend for direct patient care are satisfactory or not.
Recently Sinsky et al 9 performed a time-motion study including different specialities (medical and surgical) in different settings. This work gave first insights of physicians’ time allocation in various ambulatory settings. In the hospital practice, many factors such as hospital type (university vs non-university), patients length of stay and amount of comorbidities (case-mix index), local educational culture and habits may influence the resident’s working day structure; we therefore aimed to compare working time allocation among internal medicine residents using time-motion observations in two large Swiss hospitals, using a method developed previously.6
Thus, the first study goal was to describe how this method could be used for inter-hospital comparison. The secondary goal was to learn more about specific differences in the resident’s working day structure in university and non-university hospital settings. Because studied hospitals have differing teaching objectives and organisation, we hypothesised that we would find differences in residents’s allocation of time.
Methods
Study design and setting
Two observational time-motion studies were performed. The first was performed at the Lausanne University Hospital CHUV (hospital A) (May–July 2015, www.chuv.ch) and the second at the Cantonal Hospital of Baden KSB (hospital B) (September–October 2016, www.ksb.ch).
Structure and organisation of hospitals A and B
Baseline characteristics of the two hospitals were collected from the hospitals’ annual report. Hospitals A and B differed regarding their mean length of stay, case mix index and EMR system (table 1). Scheduled time tables (figure 1) were similar in both hospitals with the exception of the duration of the daily patient round (longer at hospital A) and the time allocated for multidisciplinary boards and training conferences.
Characteristics of internal medicine divisons/departments of both hospitals and residents

Scheduled time tables of the two hospitals indicating the different scheduled time tables between the observed hospitals. Differences mainly regard the duration of the daily patient round (earlier and longer at hospital A compared with hospital B (9.00–12.00 vs 09.30–10.50) and the time point for multidisciplinary boards and training conferences. Training conferences take place mainly during lunch breaks at hospital A, whereas these teaching sessions are rather before the morning handoff meeting at hospital B. The handoff meeting is scheduled to take longer in hospital B.
In hospital B (and not in hospital A), doctor’s assistants are implemented in the daily routine and take over tasks traditionally performed by residents such as collecting existing medical data, importing data into the EMR, performing routine examinations and organising appointments. Residents of hospital B have to redirect their phones to the doctor’s assistant during the patient round.
Participants’ selection
For this study, we considered only regular weekday day shifts on general internal medicine wards. No specialty wards, no privately insured patient wards and no emergency room shifts were considered. Residents were included if they worked at the internal medicine wards during the observation period, if they had at least 1 month of local experience and if they provided written informed consent. We planned to observe each resident twice.
Patient and public involvement
Residents were informed verbally with a presentation about the project and its goal to compare two hospitals. They were prompted to perform ‘as usual’ and were not informed about the specific study question to not manipulate their behaviour. All residents gave written informed consent to use their anonymised data for quality improvement purposes and signed an informed consent form. The local study team verified that written informed consent was present from all participants before planning the observation. No patient data or health information and no data on residents’ health were used for this study.
Data collection procedures
The study methods was described in detail by Wenger et al.6 Briefly, specially trained undergraduate medical students observed the resident’s work during their shifts without interfering with the daily practice. Due to different study time points and local language, observers were trained at each centre separately. At hospital A, 6 French-speaking observers were trained. At hospital B, 11 German-speaking observers were trained. The training was similar in both hospitals and consisted in (a) a dedicated e-learning programme on how to categorise the various resident’s activities; (b) a teaching session, focused on the definition of activities and the use of recording device; (c) a 2-hour practice session based on a video of residents engaging in typical medical activities; (d) 8 hours of blank observation to observe and record a resident on the ward and (e) a last session to control they correctly recorded activities during blank observation, to point out specific situation and to standardise the observations. In hospital A the reproducibility of the six observers was assessed during the video practice for all observers. Overall, observers recorded activities similarly. The coefficient of variation for categories ranged from minimum 0.7% for activities directly related to patients to maximum 9.1% for academic activities.6 In hospital B, the reproducibility of a sub-group of observers (n=5) was assessed. The coefficient of variation ranged from minimum 3.9% for activities indirectly related to patients to maximum 9.3% for academic activities. Overall, coefficients of variation for categories of activities were quite similar and smaller than 10%, meaning that the observers in hospital A and B had similar accuracy during training sessions to record residents’ activities.
Observers awaited residents at their workplaces. Recording began when entering the ward and finished when leaving the office in the evening. Residents were randomly assigned to a specific observer and day of the week. To decrease the observation bias, no communication between resident and observer was allowed, except for clarification about an activity or a given context. Shifts were covered by two observers with handoff after 6 hours to ensure attention and accuracy.
In addition, we collected the baseline characteristics of residents including sex, age, country of medical school graduation, amount of postgraduate training and commuting distance to the hospital.
Recording device and definition of activities
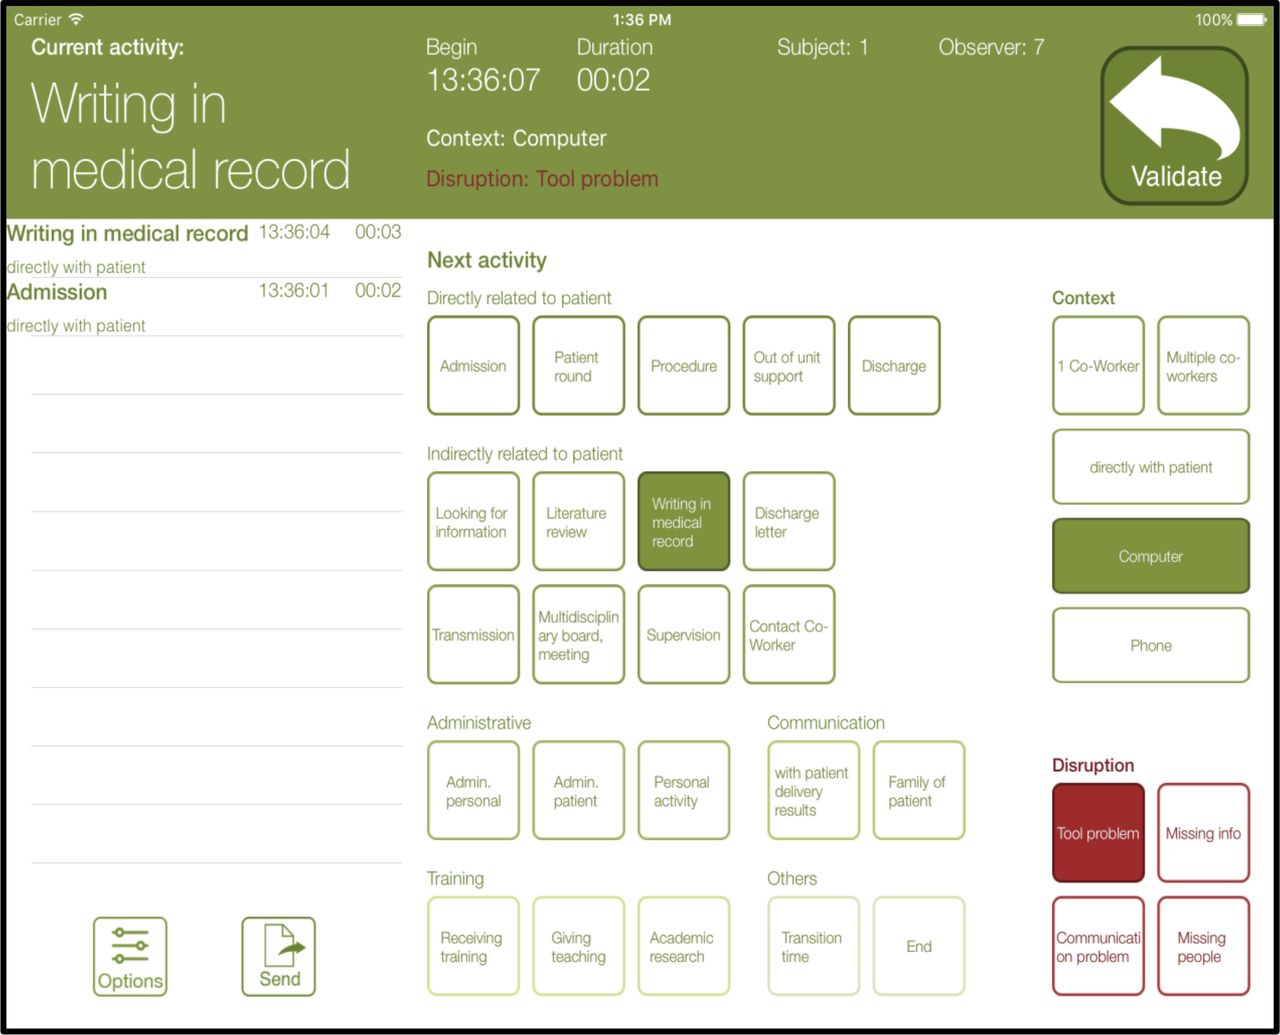
Activities were recorded with a tablet-based software designed and developed by the study team (figure 2). Details about the software can also be found in the methods section.6 The software was designed to allow fast and easy changes between performed activities with a precision up to the second. To promote similar studies, the source code is available ‘as is’ on the following github website (https: //github.com/agarnier00/MEDAY).6

Tablet-based recording tool to record observations showing a screen shot from the application developed for this study. Observers choose the activity performed by the resident pressing one or several buttons in right-middle of the screen. In this moment, the green bar changes to red and the observers Presses ‘confirm’. This changes the colour back to green; the activity starts to be recorded and details of the activity are displayed within the bar. The log is on the left side of the screen. Observers could edit activities, if they judged wrongly in the first place. Data were stored anonymously with an ID number for the resident and observer. After observation, the data were transmitted via secured e-mail to the investigators.
As the main goal for the development of this recording tool was to get the most precise data from the resident’s workday, definitions covered the whole spectrum of tasks performed by residents. The observers were asked to record 22 different activities and their context as previously defined.6 The same definitions were used at both hospitals (table 2).
Activities recorded with the tablet application and their definitions
These 22 activities were divided in six categories (directly related to patients (n=5), communication (n=2, counted to directly related to patients as well), indirectly related to patients (n=9), training (n=3), non-medical tasks (n=2) and transition (n=1)). Definitions of activities were specific to get a truthful picture of a resident’s working day (eg, activities directly related to patients differentiated admission, daily round, discharge, clinical procedures and out of unit support; indirect activities differentiated different tasks at the computer, supervision and more. See table 2 for more details). All these activities could be recorded concomitantly with one or more contexts present (with patient present, using phone, with colleague or using a computer). Because these contexts, especially time with patients, were of utmost importance, they could be recorded during all activities. The tool allowed only one activity to be recorded at the time whereas the different contexts (with patient, computer, phone, colleague) could change irrespective to the activity being performed. To highlight the most important definitions: ‘patient present’ was recorded when a resident was in direct contact with a patient and had his attention towards the patient. Reviewing laboratory results on the computer during daily round in the patient’s room did not count for ‘patient present’. Admission accounted for all admission activities (reading the record, anamnesis, physical examination, documentation), except during the daily round. Observers were taught to interpret local EMR system.
To be able to compare the amount of activities according to actual workload, the number of patients present at the observed ward was registered. To estimate the residents’ workload on the day of observation, we calculated patient equivalents on the basis of hours patients were present at the ward. One patient equivalent was defined as the presence of a patient during the whole observed shift of an individual resident. Number of patients and hours of presence were extracted from the EMR.
Statistical analysis
Statistical analysis was performed using Stata V.15.1 (Stata Corp). Descriptive results for residents’ characteristics were presented as average ± SD or as median (IQR) for continuous variables, or number and percentage of participants for categorical variables. As residents could be assessed several times on the same shifts, we used a linear mixed model with clustering by resident (random part) to compute the means and corresponding 95% CIs of the time dedicated to each activity. We calculated the percentage of a resident’s shift time devoted to a specific activity by dividing the time for that activity by the total shift duration. Between-hospital comparisons were performed using a multivariable linear mixed model, where resident ID was included in the random part of the model. Statistical significance was considered for a two-sided test with a p value<0.05.
Results
Twenty-eight residents were observed in hospital A during 49 shifts resulting in a total of 566 observation hours. In hospital B, 21 residents were observed during 43 shifts with a total observation time of 486 hours. In hospital A, all residents eligible for the study consented (100%, 28/28), whereas one resident in hospital B refused to participate (95% 21/22). Due to vacation or illness, 9 of 28 and 3 of 21 residents were observed only once in hospitals A and B, respectively. Mean age of the residents was 28.8 and 29.6 in hospitals A and B, respectively, and 57% were women (table 1). Residents in hospital A had longer average postgraduate training but shorter commuting distance.
Time dedicated to activities
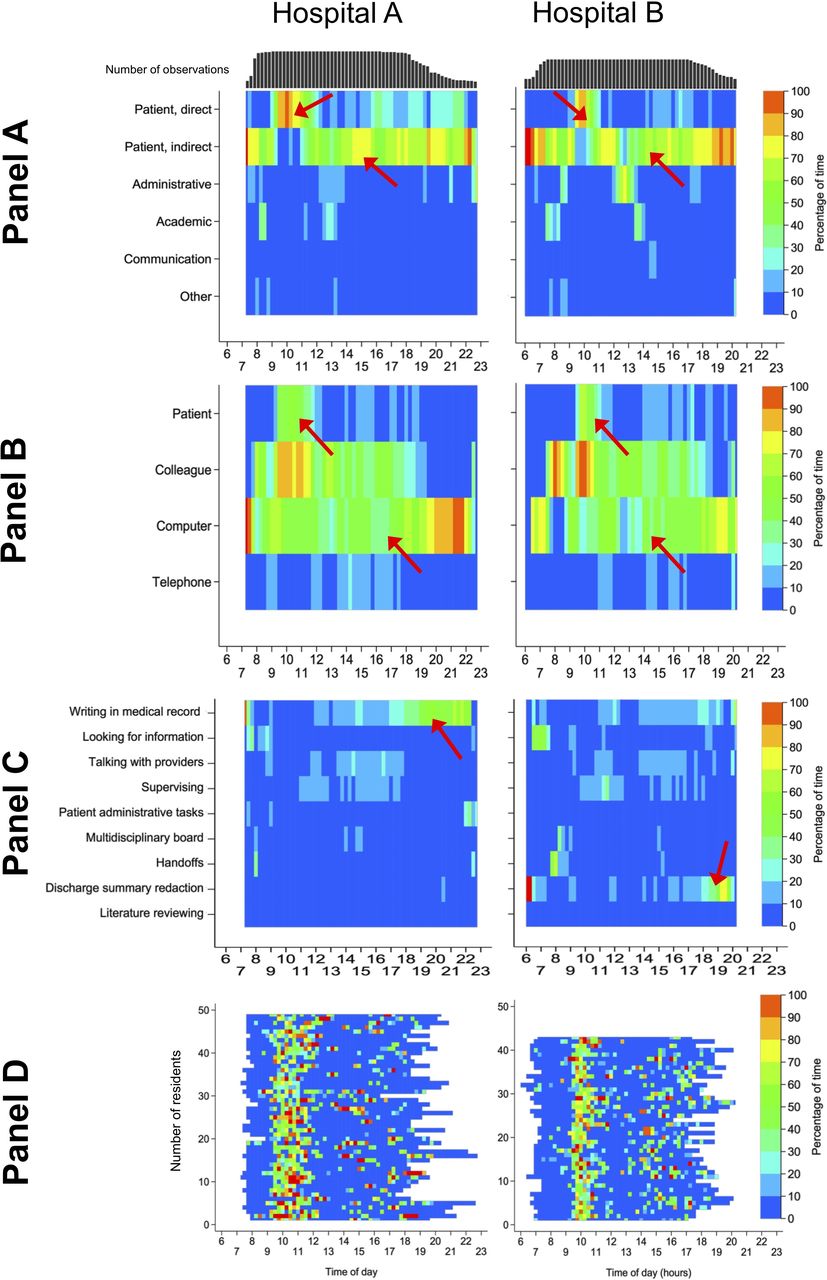
Mean daily working time was 11.5 (hospital A) and 11.3 (hospital B) hours (table 3). Residents in hospital A spent significantly more time performing activities directly related to patients (195 vs 116 min, p<0.001). Heat maps showing the activities performed and their distribution over the working day are presented in figure 3A–D. Differences were mainly explained by an increased time dedicated to daily rounds and admissions in hospital A (table 3).

Inter-hospital comparison of activities performed using heat maps. For all panels: hospital A on left, hospital B on right side. The colour of the heat maps indicates the percentage of time (stratified by blocks of 15 min) during which residents performed a displayed activity or category. X-axis indicating the time of the day in hours. Panel A: categories of activities. Heat maps showing the proportion of activities sorted by category performed during the day stratified by hospital. Red arrows in the first line indicate longer duration of activities directly related to the patient in hospital A (daily round during morning, mainly admissions during afternoon). Arrows in the second line indicate the distribution of indirect activities throughout the whole working day with peaks in the early morning and evening. Panel B: context of activities. Heat maps showing the context in which activities were performed during the day stratified by hospital. Arrows in the first line indicates the majority of direct patient contact during the daily round and a scattered pattern during the afternoon. Arrows in the third line indicate computer use spread over the whole working day. Panel C: activities indirectly related to patients. Heat maps showing the proportion of activities indirectly related to patients performed during the day stratified by hospital. Arrows indicate the main difference between allocation of time with writing in EMR versus discharge summary redaction. Panel D: time spent with patients. Heat maps showing the proportion of activities performed directly with the patient stratified by hospital. The colour indicates the percentage of time residents were directly related to the patient. In both hospitals a cluster is obvious during the daily round, which takes more time in hospital A. More residents see patients during the afternoon in hospital B.
Inter-hospital comparison of residents’ activities
Residents of hospital B required more time to look up patient-specific information (51 vs 38 min, p=0.022). However, the time each resident spent for admissions was more than twice as high at hospital A (28 vs 11 min, p=0.04) compared with hospital B. The amount of training received at hospital A (university hospital) tended to be higher (38 vs 26 min per day, p=0.11) in particular during daily rounds (online supplementary appendix eFigure 1).
Supplemental material
Time spent with patients, colleagues, using a computer or a phone
On average, residents were in charge of eight patients (7.8±2.3 at hospital A vs 7.4±1.0 at hospital B, p=0.27). The majority of patient contact took place during the daily round (figure 3 panel D). When residents in hospital A performed activities directly related to patients, a colleague was more often present compared with hospital B (134 vs 76 min, p<0.001). Residents at hospital A spent more time using the computer while performing activities directly related to the patient (online supplementary appendix eTable 1). Residents used the computer throughout the day (figure 3 panel B and online supplementary appendix eFigure 2), with the exception of two periods of time in hospital B, between 8–9 o’clock and 12–13 o’clock, which correspond to handoffs and lunch break.
Discussion
Our study describes how two time-motion studies could be used for inter-hospital comparison of residents’ time allocation. The methodology could be easily transferred to a second study site and revealed similar and plausible results. Regarding specific differences in the resident’s working day structure between university and non-university hospital, we found that the daily period of time dedicated to direct patient care differed in favour of the university hospital. This time-motion study and dedicated tablet-based tool6 to record defined activities seem suitable to compare the allocation of time of residents at work in different hospital settings.
Time-motion studies to benchmark resident’s allocation of time: pro and cons
In this study aiming to compare the allocation of time of residents at work in different hospital settings, we first showed that time-motion observations allowed to compare complex day structures of internal medicine resident’s working in different hospital settings, i.e. a French-speaking university hospital and a German-speaking non-university hospital, with plausible and comparable results. Sinsky and associates9 described the allocation of physicians’ time in ambulatory practice. Similar to us, they describe allocation of physician’s working time in different settings and specialties (ie, family medicine, internal medicine, cardiology and orthopaedics) and concluded that factors present in one setting (eg, dictation services and documentation assistant services) might have influenced the direct clinical face time.
Second, time-motion studies are not time-consuming for the workers, that is, the residents. As residents usually operate at full capacity, they have no time left for documenting their tasks performed precisely as this disrupts their workflow. Moreover, documenting the activities performed after the shift may result in a substantial loss of information (recall bias). Therefore, data collection using observers is one of the major advantages of time-motion studies, especially when the device is fast and flexible as the one used in this study (figure 2).
Third, as time-motion studies give excellent information about the type and distribution of work activities, it can also be a well-suited method to compare post-interventional changes in a single institution (such as change of EMR, increase of the number of staff, implementation of doctor’s assistants). Additionally, this methodology could easily be adapted to examine the day structures of other healthcare professionals. However, because multiple factors can play a role in residents’ time allocation and in fine determine the differences observed between hospitals, time-motion studies must be thought as a first step on the path for future changes. Indeed, based on time-motion results, each hospital will be responsible to test several interventions targeting residents’ time allocation in order to modify resident allocation of time. Focus groups could help to find explanations regarding differences in residents’ allocation of time.
Fourth, as many tasks are complex and can possibly occur as ‘multitasks’, time-motion studies using devices that allow to record several tasks at the same moment might be of interest, as previously published.7 However, in our group, we studied task-switching, defined as a switch from one task to another, expressed as number of switches per hour rather than multitasking15 as from literature there is evidence that the human brain can perform one or maximally two demanding tasks at the time, which are thought to be performed sequentially.16
Fifth, with the continuous tracking of activities with a time stamp, time-motion studies can be used to generate heat maps. This graphical presentation of data can help to detect patterns of time allocation and display the distribution of activities over the working day. For readers, this visual help can be more illustrative than percentage quotation in a table.
Sixth, compared with self-reported surveys, in which residents could (in)voluntarily overestimate activities (ie, patient visit, as residents might consider this task as the most important), time-motion studies objectively describe time allocation and point out potential differences between settings. However, self-report survey remains less time-consuming for researchers or administrators and cheaper.
Indeed, financial resources required for time-motion studies are costly, but affordable for most hospitals or divisions and therefore usable. For example, an observation period of 500 hours at a hourly rate salary of 20 Swiss francs (CHF) results in 10 000 CHF for the observation period only. However, compared with self-declaration studies, their logistical and financial costs are much higher. Another interesting alternative to time-motion studies can be electronic health records (EHR) audit logs. In these analysis of data protocols from EHRs a huge amount of data can be extracted without intervening with the daily routine of residents (or other physicians). Patterns in the working day can be detected and workflow of different professionals can be compared. But compared with time-motion studies, this method lacks important information on the full spectrum of clinical activities that are not performed with the mouse or the keyboard.
In conclusion, time-motion studies are interesting and innovative hospital benchmarking tools are able to demonstrate how physicians allocate their working time in different settings or culture.
Inter-hospital comparison: main differences
The daily period of time dedicated to direct patient care differed between hospitals, but remained in accordance with previous published studies.2–5 7 The difference was mainly explained by an increased time dedicated to daily rounds and admissions in the university hospital. Indeed, residents working in the non-university hospital were less experienced (17 vs 30 months of postgraduate training), which might have had an impact on their efficiency and the time dedicated to patients. This is in accordance with the literature: younger residents experience a higher stress level and perform more often inefficient day activities.17
Interestingly, residents in the non-university hospital spent less time performing administrative activities (18 vs 32 min, p<0.001) and answering the phone (41 vs 58 min, p=0.021), which might be an effect attributable to the available doctor’s assistants. This is partially in accordance with our study hypothesis and the literature.12 Although the less experienced residents from the non-university hospital spent less time performing administrative tasks, they did not convert this advantage in time allocated to patients. One could also hypothesise that less experienced residents may favour ‘iPatient’ care,18 that is, using the EHR as the virtual construct of the patient, in order to avoid asking time-consuming questions.
As illustrated in the heat maps (figure 3, panel D), most patient contact occurred during daily round. Thus, because daily round was planned to last 180 min in the university hospital versus 80 min in non-university hospital (figure 1), the potential beneficial effect of doctor’s assistants could not be converted in more time with patients.
Finally residents from the university hospital spent more time using the computer while performing activities directly related to the patient compared with residents from the non-university hospital.
Study strength and limitations
With over 1000 hours of direct observation, this time-motion study is one of the largest of its kind. With this fast and flexible tablet-based tool, observers were able to record even short activities. As residents were observed continuously, there was no recall bias compared with studies using self-declaration or interviews. Due to separate recording of the performed activities and its context, our study reports absolute amount of time spent with patients, computers, phone or colleagues.
Our study has possible limitations. First, we observed a relatively small number of residents. However, sample size was determined by the number of residents working at each hospital, which is in accordance with other studies.1–5 Second, because of the observational study design, it could not be assessed whether certain organisational factors such as doctor’s assistants, various EMR systems, different language or culture had a causal effect on time allocation. Moreover, because residency in Switzerland starts in non-university hospitals, residents were less experienced at hospital B, which could have influenced their time allocation. Third, given the limited availability of observers during night shifts and the very different structural organisation between hospitals during nights and weekends, only weekday day shifts were considered for this study. As most clinical work is performed during weekday day shifts and only a small percentage of residents ‘guards’ the hospital during evenings and nights, we estimate this lack of information as negligible. Fourth, not all observers could be assessed for observer day shifts at hospital B, as only five recording devices were available, which determined the final number of observers assessed at random for reproducibility. Moreover, coefficients of variation were smaller than 10% for categories of activities in both hospitals. This method is partially in accordance with a previous time-motion study.7 Fifth, no data on the number of admissions and discharges per shift were collected, but we estimated the workload based on the number of patients each resident was in charge. Sixth, as in all studies observing workers performing professional activities, residents might behave differently when being supervised (Hawthorne effect).19 This effect is however expected to be similar at both study sites. Seventh, some activities (eg, patient’s admission) occurring in an unexpected setting or time frame might have been recorded as another activity (eg, daily round). However because such misclassifications remain within the same category (ie ‘activities directly related to the patient’) we doubt it could significantly bias the results. Further, no gold standard (for the correct activity) was available regarding the assessment of the different activities; hence, a systematic reporting bias (ie, the observers from one hospital systematically over or underestimating a given activity) cannot be completely ruled out. Still, this issue occurred in other studies as well7 9 and it would be important that a common gold standard be created to facilitate comparison between studies and settings. Finally, in order to enhance the generalisability of our results, we did not observe residents working in privately insured patient wards, because private insurance systems are country-dependent.
Implications
On the basis of our results, several interventions targeting residents’ time allocation could be tested in hospital practice. First, delegation of administrative or low added value tasks to doctor’s assistants (as it was done at hospital B) could allow residents to focus on more valuable medical activities and training (as shown in the ambulatory setting by Bank et al 12). Second, optimising documentation supports, using speech or writing recognition systems, or improving EMR ergonomy could decrease the time residents spend writing in the EMR.9 In addition, using doctor’s assistants could lead to an increase in workflow efficiency as shown by Bank and colleagues.12 Further studies in the same hospital are needed. Finally, qualitative analyses, such as focus groups, could determine the reasons why residents allocate their time in such manners and add informative data. To better understand and optimise hospital workflows, it would be helpful to integrate patient outcomes, quality-of-care-related outcomes and satisfaction outcomes in future time-motion studies.
Conclusion
We compared, using time-motion observations, internal medicine residents’ allocation of time in two different hospital settings and identified differences potentially related to hospital structure and organisation. Inter-hospital comparisons with time-motion design could help to set up interventions aiming to improve workday structure and experience of internal medicine residents.
Acknowledgments
We like to thank all persons involved in this study. Special thank goes to our observers and members from administration for their huge effort.
References
Footnotes
SMF and MM contributed equally.
Contributors MM and J-HB initiated this project and the inter-hospital collaboration. All authors then contributed to the concept, design and conduct of the study. AG designed the database and the application interface. MM, JC, AG and NW performed the study at the Lausanne University Hospital (CHUV). SMF, ME and J-HB performed the study at the Cantonal Hospital Baden (KSB). PM-V analysed the data. SMF and MM drafted the manuscript and all authors critically revised it. All authors approved the final version to be published. The lead authors affirm that the manuscript is an honest, accurate and transparent account of the study being reported, that no important aspects of the study have been omitted and that any discrepancies from the study as planned have been explained.
Funding The study was supported by each Department/Division of Internal Medicine (Lausanne University Hospital and Cantonal Hospital of Baden) as well as sponsored by the Information Technology Department of Lausanne University Hospital. The funding sources had no influence on study design, data collection and analysis, interpretation of data, manuscript preparation and decision to submit the manuscript for publication.
Competing interests J-HB received financial support from the Swiss National Science Foundation and the Kardio Foundation.
Patient consent for publication Not required.
Ethics approval The Human Research Ethics Committees (Northwestern and Central Switzerland and Canton Vaud) certified that this study was exempted from human subjects ethics review and therefore needed no approval.
Provenance and peer review Not commissioned; externally peer reviewed.
Data availability statement Data are available upon reasonable request.