Article Text

Abstract
Objectives To (1) describe the epidemiology of child and adult telomere length, and (2) investigate parent–child telomere length concordance.
Design Population-based cross-sectional study within the Longitudinal Study of Australian Children.
Setting Assessment centres in seven major Australian cities and eight selected regional towns; February 2015 to March 2016.
Participants Of 1874 participating families, telomere data were available for analysis for 1206 children and 1343 parents, of whom 1143 were parent–child pairs. There were 589 boys and 617 girls; 175 fathers and 1168 mothers.
Outcome measures Relative telomere length (T/S ratio), calculated by comparing telomeric DNA (T) level with the single copy (S) beta-globin gene in venous blood-derived genomic DNA by quantitative real-time PCR.
Results Mean T/S ratio for all children, boys and girls was 1.09 (SD 0.56), 1.05 (SD 0.53) and 1.13 (SD 0.59), respectively. Mean T/S ratio for all parents, fathers and mothers was 0.81 (SD 0.37), 0.82 (SD 0.36) and 0.81 (SD 0.38), respectively. Parent–child T/S ratio concordance was moderate (correlation 0.24). In adjusted regression models, one unit higher parent T/S ratio was associated with 0.36 (estimated linear regression coefficient (β); 95% CI 0.28 to 0.45) higher child T/S ratio. Concordance was higher in the youngest parent-age tertile (β 0.49; 95% CI 0.34 to 0.64) compared with the middle (β 0.35; 95% CI 0.21 to 0.48) and oldest tertile (β 0.26; 95% CI 0.11 to 0.41; p-trend 0.04). Father–child concordance was 0.34 (95% CI 0.18 to 0.48), while mother–child was 0.22 (95% CI 0.17 to 0.28).
Conclusions We provide telomere length population values for children aged 11–12 years and their mid-life parents. Relative telomere length was shorter in adults than children, as expected. There was modest evidence of parent–child concordance, which diminished with increasing parent age.
- telomeres
- reference values
- children
- ageing
- inheritance patterns
- epidemiological studies
This is an open access article distributed in accordance with the Creative Commons Attribution Non Commercial (CC BY-NC 4.0) license, which permits others to distribute, remix, adapt, build upon this work non-commercially, and license their derivative works on different terms, provided the original work is properly cited, appropriate credit is given, any changes made indicated, and the use is non-commercial. See: http://creativecommons.org/licenses/by-nc/4.0/.
Statistics from Altmetric.com
Strengths and limitations of this study
Our sample is the largest telomere length data set of children and parents of a population-based Australian cohort.
A major strength of our study is the high-quality telomere data, with low inter-assay and intra-assay coefficient of variation.
The cross-sectional design precludes telomere concordance assessment over the lifecourse.
Robustness of father–child concordance is limited by a relatively small sample relative to mother–child pairs.
Introduction
Telomeres are complex nucleoprotein structures on a scaffold of TTAGGG tandem repeats at the ends of linear DNA.1–3 They protect DNA integrity and prevent fusion of adjoining chromosomal ends. Conventional DNA polymerases are unable to replicate the ends of linear chromosomes, so several base pairs from telomeric DNA are lost with each mitotic division, leading to progressive telomere shortening with age.4 When telomeres erode to a critical length, the resulting telomere dysfunction triggers cell cycle arrest or apoptosis. Accelerated telomere shortening has been associated with morbidity and mortality from both communicable and non-communicable diseases, including cardiovascular disease, hypertension and diabetes.5–9 For example, in studies of older adults, shorter telomere length is associated with an increased risk of all-cause and cardiovascular mortality,8 and infectious diseases.10 11
The extent to which telomere length is influenced by genetic and environmental factors is unclear.12 Several studies have found stronger maternal correlations with child telomere length,13–15 while others have reported stronger paternal influences.16–19 In a study of 98 fathers and 129 mothers, father–child concordance (0.45) was threefold higher than mother–child pairs, independent of child sex.17 Older paternal age is also associated with longer offspring telomeres.19–21 However, a recent meta-analysis showed high heterogeneity across parent–offspring correlation studies, and suggested that evidence to date is inconclusive.22
To date, telomere research has largely focused on environmental and specific genetic determinants and with associations between telomere length, morbidity and mortality. The majority of population studies have focused on healthy adults and relatively little is known about normative telomere lengths in healthy children. Establishing population-level telomere length data has potential to assist in harmonising future telomere research of similar structure, as well as allowing for international population comparisons. In addition, examination of age-specific and sex-specific parental effects may be informative for understanding the determinants of telomere length.
In an Australian population-based cohort, we aimed to (1) describe the epidemiology of child and adult telomere length, and (2) investigate parent–child telomere length concordance, including (a) comparisons between father–child and mother–child pairs and (b) the effect of parental age on concordance.
Methods
Study design and participants
In 2004, the Longitudinal Study of Australian Children (LSAC or Growing Up in Australia) recruited two nationally representative cohorts each comprising approximately 5000 Australian children. LSAC participants have been seen at seven biennial waves spanning 0–1 to 12–13 (B cohort) and 4–5 to 16–17 years (K cohort). Details of the LSAC study design and recruitment are outlined elsewhere.23 24 The Child Health CheckPoint study (CheckPoint) was an additional cross-sectional wave of the B cohort, nested between LSAC’s sixth and seventh. It was a one-off comprehensive physical health and biomarker module of participants at age 11–12 years and their attending parents. Further details are described elsewhere.25 26
Consent
The attending parent provided written informed consent for themselves and their child prior to participation, and the child provided assent.
Patient and public involvement
Because LSAC is a population-based longitudinal study, no patient groups were involved in its design or conduct. To our knowledge, the public was not involved in the study design, recruitment or conduct of the LSAC study or its CheckPoint module. Parents received a summary health report for their child and themselves at or soon after the CheckPoint assessment visit. They consented to take part knowing that they would not otherwise receive individual results about themselves or their child.
Procedures
The data collection phase ran from February 2015 to March 2016. Data were collected across Australia in main (major cities) and mini (regional cities) assessment centres, with home visits offered to those who were unable to attend an assessment centre. Children and their attending parent rotated through a series of stations where different aspects of health were assessed, as well as the collection of biological samples including blood. Only one parent/guardian was invited to participate in assessments; families were free to choose whether this was the mother or father, and in some cases, another relative/guardian attended.
Blood samples
Whole venous blood was collected into vacutainer tubes containing EDTA and immediately transported to an onsite laboratory. The blood sample was processed into aliquots (including whole blood and blood clot) within 2 hours into 1.0 mL FluidX tubes (FluidX, Cheshire, UK) and frozen at −80°C in an ultra-low temperature freezer (Thermo Fisher Scientific, Waltham, MA, USA). A REDCap database was used to track samples and allow for patient deidentification in the onsite laboratory.27 Samples were transported on dry ice for storage at the biobank at the Murdoch Children’s Research Institute, Melbourne, Australia, for long-term storage in a −80°C ultra-low temperature freezer.
DNA isolation
Genomic DNA was isolated from whole blood or blood clot using the QIAamp 96 DNA Blood Kit (Qiagen, Venlo, the Netherlands). Samples were randomised with child and parent pairs on the same plate to minimise batch effects when comparing parent–child pairs using Stata random number generator. The sample retrieval, protocol optimisation, consumable acquisition and isolation of genomic DNA spanned April 2016 to January 2017. Purity and integrity of genomic DNA was confirmed using NanoDrop 2000 spectrophotometer (NanoDrop Technologies, Middleton, WI, USA), Qubit 2.0 Fluorometer (Thermo Fisher Scientific, Waltham, MA, USA) and gel electrophoresis, prior to storage at −80°C. DNA was also isolated from three sets of control samples: (1) the K562 leukemic cell line, (2) newborn cord blood and (3) human placental tissue. These control samples have previously been described as having ‘shorter’, ‘average’ and ‘longer’ telomeres relative to peripheral blood samples.28–31 The telomere lengths of control samples were validated using terminal restriction fragment (not shown). Genomic DNA from each of these control samples was used on all plates with telomere assay to assess day-to-day and batch (plate) effects.
Measures
Telomere length measurement
Telomere length was measured with the widely used quantitative real-time PCR (qPCR) method, originally described by Cawthon.32 This method measures the amount of telomeric DNA (T) and a single copy gene (in this case beta-globin, S) for each sample. A ratio, known as the T/S ratio, is calculated by comparing the relative amount of ‘T’ and ‘S’ for each of these samples to a reference genomic DNA sample (ie, the average T/S ratio of the three standard genomic DNA). Each sample was measured in quadruplicates comprising 4 µL of diluted DNA sample at 5 ng/µL, 5 µL of SensiFAST SYBR No-ROX Kit (Bioline, Sydney, Australia) master mix and 0.5 µL of each forward and reverse primer at 2 µM. The primer sequences were tel1a (5ʹ-CGG TTT GTT TGG GTT TGG GTT TGG GTT TGG GTT TGG GTT), tel2a (5ʹ- GGC TTG CCT TAC CCT TAC CCT TAC CCT TAC CCT TAC CCT), bg1a (5ʹ-GCA GGA GCC AGG GCT GGG CAT AAA AGT CA) and bg2a (5ʹ-GGG CCT CAC CAC CAA CTT CAT CCA CGT TC). All ‘T’ and ‘S’ reactions were performed in 384-well plates on a Lightcycler 480 Instrument II (Roche, Melbourne, Australia). Corresponding ‘T’ and ‘S’ reactions were performed on the same plate. The cycling condition began with incubation at 95°C for 10 min, followed by 35 cycles of (i) 95°C for 15 s and (ii) 62°C for 60 s. The final 384-well layout included participant genomic DNA, three sets of genomic control DNA and a no-template control containing RNase-free water instead of a DNA template. Each of these were present in quadruplicates. All qPCR assays were performed using filtered pipette tips to prevent amplification of contaminants. Reactions were set up on ice to prevent DNA polymerase activity, non-specific amplification and to minimise potential primer-dimerisation. Plate layout and additional details can be found in the Standard Operating Procedure on the Child Health CheckPoint website.33
Other sample characteristics
Age and sex were collected via questionnaire, linkage to administration databases or provided by the Australian Bureau of Statistics. Participant height was measured using a portable stadiometer, without shoes, in light clothing, and in duplicate, to the nearest 0.1 cm. A third measurement was taken if the difference of the first two height measurements was greater than 0.5 cm; final height was the mean of all measurements made. Weight, to the nearest 0.1 kg, was measured with an InBody230 bioelectrical impedance analysis scale (Biospace Co., Seoul, South Korea). Body mass index (BMI) was calculated as weight (kg) divided by height (m) squared. For children, an age-adjusted and sex-adjusted BMI z-score was calculated using the US Centers for Disease Control growth reference charts.34 Socio-Economic Indexes for Area (SEIFA) scores of the postcode region where the participating family lived were used as a measure of neighbourhood socioeconomic position. The SEIFA Index of Relative Socioeconomic Disadvantage (Disadvantage Index) score used was a standardised score by geographic area compiled from 2011 Australian Census data, to numerically summarise the social and economic conditions of Australian neighbourhoods (national mean of 1000 and a SD of 100, where higher values represent less disadvantage).35
Statistical analysis
To assess the replicate reliability (ie, the degree of variation between replicates on a qPCR plate), an intra-assay coefficient of variation (CoV) was calculated, as the ratio of the pooled cycle threshold’s (Ct) SD from all samples and the overall Ct mean, multiplied by 100. The Ct value is the cycle number at which the fluorescence generated within a PCR crosses the fluorescence threshold, a fluorescent signal significantly above the background fluorescence. To assess the degree of assay-to-assay and day-to-day consistency, an inter-assay CoV was calculated using the pooled Ct’s SD divided by the overall Ct mean of all duplicated samples, and then multiplied by 100.
If less than two successful replicates out of the quadruplicates were measured, then the sample data were discarded. If more than two successful replicates out of the quadruplicates were measured, then a median was calculated, resulting in a median ‘T’ and a median ‘S’ for each sample. A Ct replicate of 5–28 was considered successful as values outside of this range have a high level of uncertainty. The final relative telomere length from each sample, based on the T/S ratio, was calculated as the ∆Cttest (Ct(telomere)−Ct(beta-globin)) normalised to the average T/S ratio of the three standard DNA samples on the same plate ∆Ctref (Ct(telomere)−Ct(beta-globin)). Hence, the final equation was 2− (ΔCttest −∆Ctref)=2−∆∆Ct.
Stata V.14.0 was used for all analyses. Statistical significance was determined at the 5% level. Population summary statistics and proportions were estimated by applying survey weights and survey procedures that corrected for sampling and participation biases and took into account clustering in the sampling frame. Standard errors were calculated taking into account the complex design and weights.36 We examined distributions using means and SD and density plots, applying survey weights and survey methodology. Comparisons between group means were conducted using the student’s t-test. Parent and child telomere length concordance was assessed using the simple Pearson correlations, and linear regression models with parent telomere length as the independent variable, and child telomere length as the dependent variable. Linear regression models were adjusted for parent age, parent sex and child sex in models including both sexes, and Disadvantage Index. Analyses were also stratified by parent and child sex. Alternatively, we conducted a sensitivity analysis adjusting for parent age at birth instead of at child age 11–12 years, and there were no substantive differences (data not shown).
An interaction analysis was also conducted to examine the effect of parental age on the concordance between parent and child telomere lengths. Interaction analysis was conducted with a parent telomere length and parent age interaction term (both for parent age as a continuous and as an ordinal tertile variable), including parent sex and child sex. To better understand the pattern of results, linear regression models were conducted for parent age tertile groups (ie, 28–41, 42–45 and 46–71 years of age).
Linear regression models were repeated by applying survey weights and taking into account clustering in the sampling frame as a sensitivity analysis. As the weighted and unweighted results were virtually identical, we report only the unweighted regression analyses. More detail on the calculation of weights is provided elsewhere.36
Results
Telomere reliability
The mean intra-assay CoV between quadruplicates was 1.7% (SD 0.3; range 0.9%–2.6%). The inter-assay CoV between plates was 1.7% (SD 1.4; range 0.3%–6.2%).
Sample characteristics
A total of 1874 families participated in CheckPoint (figure 1). Of these, 1510 attended an assessment centre and had venous blood available for telomere analysis. In total, whole blood or blood clot samples were available for 1216 children and 1350 adults. Telomere length data were successfully obtained for 2549 individuals (1206 children and 1343 adults), including 1143 parent–child pairs used for concordance analyses. Telomere length was not obtained from 1197 individuals (1 removed due to a lack of consent for the use of venous blood, 728 attended a home visit where blood was not collected, 451 attended an assessment centre but did not produce a venous blood sample, 1 did not have sufficient DNA and 16 failed qPCR). The sample characteristics of parents and children are outlined in table 1, stratified by sex.
Characteristics of participants

The Child Health CheckPoint recruitment and telomere length measurement flow. qPCR, quantitative real-time PCR.
The parent sample predominantly comprised women (n=1168, 89%) with a slightly higher mean Disadvantage Index (1012) and narrower spread (SD 62) than the national average (mean 1000, SD 100), meaning that families living in disadvantaged areas were slightly under-represented. Children were represented in similar proportions of each sex. Both child and parent BMI scores were similar to current-day Australian norms, where one in four children and two in three adults are overweight/obese.37 The proportion of families with Indigenous background in our sample was 2.0%, comparable to the estimated 2.8% in the national population.38
Epidemiology of telomere length
The mean T/S ratio of children was longer than that of adults (1.09 vs 0.81 units; p<0.001). Distributions of child and adult telomere lengths were normally distributed with minor right skewing, more pronounced in the children. Children’s telomere lengths also displayed a greater spread and generally longer T/S ratios than parents (figure 2). Distributions did not appear to differ by sex for parents or children (data not presented, available on request).

Distribution of parents (solid line) and children (dotted line) relative telomere length. Relative telomere length as represented by the telomere repeat number (T) to the beta-globin single gene copy (S), T/S ratio.
Concordance between parent and child telomere length
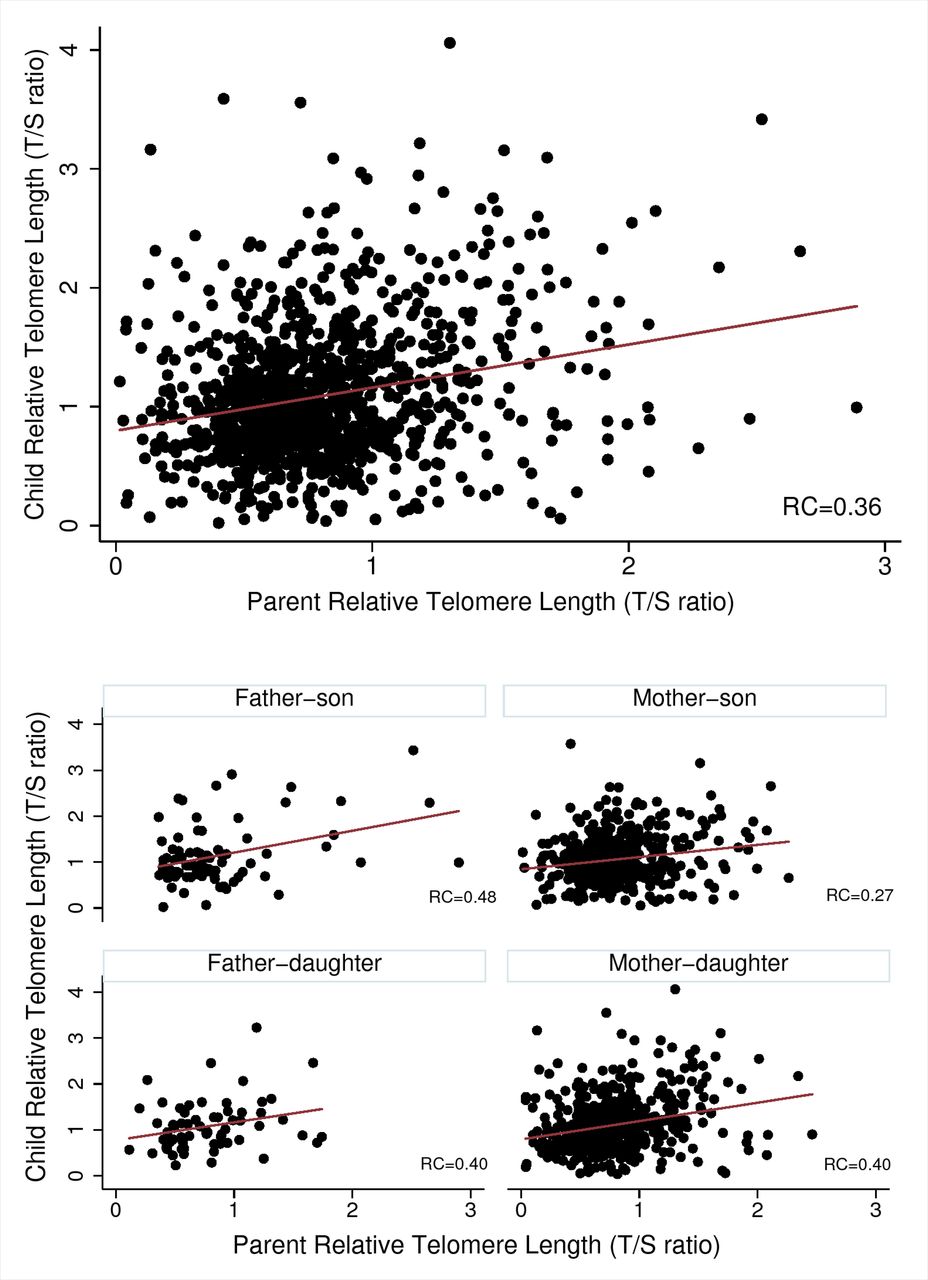
Table 2 and figure 3 show the simple Pearson correlations and adjusted linear regression results.
Concordance results for parent–child associations for relative telomere length
Parent–child pairings
The correlation between child and parent T/S ratio was 0.24. Similarly, adjusted linear regression models revealed that a one unit higher parent T/S ratio was associated with two-thirds of a SD higher child T/S ratio (β 0.36; 95% CI 0.28 to 0.45; figure 3).

Parent and child relative telomere length concordance (top), and by sex-specific pairings (lower four). RC, estimated regression coefficient.
Across parent-age tertiles, associations were strongest between parent and child T/S ratios in the youngest parent-age group and decreased with increasing parent age group. For example, in the youngest parent-age group, a one unit higher parent T/S ratio was associated with almost a one SD higher child T/S ratio (β 0.49; 95% CI 0.34 to 0.64), compared with half a SD higher (β 0.26; 95% CI 0.11 to 0.41) in the oldest parent-age group. When parent-age tertiles were examined at the father–child and mother–child level, the same parent-age group effects were seen across tertiles, and significant for father–child tertiles (p-trend 0.01). For example, the strongest concordance was observed between father–child T/S ratios in the youngest father-age tertile, with a one unit higher father T/S ratio associated with almost a 1.5 SD unit higher child T/S ratio (β 0.83; 95% CI 0.26 to 1.40). However, there was no evidence of an association for father–child concordance in the oldest parent-age tertile (β 0.18; 95% CI −0.09 to 0.45).
Sex-specific pairings
Pearson correlations between T/S ratios were 0.34 (95% CI 0.18 to 0.48) for father–child pairs, and 0.22 (95% CI 0.17 to 0.28) for mother–child pairs. Relationships were similar in adjusted regression models. In both father–child and mother–child pairs, T/S ratio correlations were similar for sons and daughters.
Across all analyses, estimates of associations (ie, SD, 95% CIs) were far less precise in fathers compared with mothers, given that parents were 87% mothers.
Discussion
Principal findings
We describe the epidemiology of adult and child telomere length and parent–child concordance in a large population-based Australian cohort. As in other studies, children had longer telomeres than adults, but also showed a wider spread with greater skewing to high values. Telomere length did not differ by sex in both children and adults. Parent–child telomere length concordance appears substantial for both father–child and mother–child pairs. The degree of concordance may be higher with younger parents.
Strengths and weaknesses
A major strength of our study is the high-quality T/S data, with low inter-assay and intra-assay CoV. Unfortunately, we were unable to compare our T/S ratios with other laboratories, but we have compared our T/S ratios with those generated from another cohort within the same laboratory (data not included). The T/S ratios show similar distributions and age-specific effects. Telomere length was quantified using a qPCR method, instead of the labour and sample intensive ‘gold standard’ of Southern hybridisation. The qPCR method has been validated against the Terminal Restriction Fragment assay with high correlation.32 Our PCR-based assay requires smaller amounts of DNA, allows for high-throughput testing and is relatively low cost. This technique is therefore well suited for large epidemiological studies,39 40 but does not quantify absolute nor chromosome-specific telomere length. Future studies should also consider measuring the distribution of short telomeres, as some data suggest that the shortest telomeres, rather than the average telomere length, drive senescence.41 42 Our findings regarding paternal characteristics should be interpreted with caution due to the limited number of fathers. Nonetheless, our sample size compares favourably with similar studies internationally.13 16 17 Some findings from this population-based Australian cohort are likely to be generalisable, but we acknowledge cross-sectional design limitations, and that our cohort may under-represent Australian families in disadvantaged neighbourhoods. In terms of the epidemiology of T/S, this could have skewed to higher averages, although our weighted analysis did not suggest this was the case. In addition, our concordance results did not change with weighted analyses.
Meaning and implications for clinicians and policy-makers
Due to our small number of fathers and overlapping confidence intervals, we cannot tell whether the larger father–child than mother–child concordance (0.34 vs 0.22) is a chance or real difference. Either way, it is clear from this and other studies (including from twins) that children’s telomere length is partly heritable as a complex trait with significant contributions from genetics, prenatal and postnatal environmental factors.12 43–45 In the case of mothers, this likely includes shared maternal factors in pregnancy that influences both maternal and offspring telomere length. Indeed, there are several maternal characteristics that have been shown to associate with fetal telomere length, including chemical exposure, stress during pregnancy and maternal diet.45
Several population studies have reported longer telomeres in females at different ages.15 16 46 Similarly, a meta-analysis of 36 cohorts totalling 36 230 adults showed that, on average, females had longer telomeres than males, despite significant heterogeneity between studies, and the size of this difference varying between measurement methods.46 This leads to the hypothesis (eg, Njajou et al 16) that such a difference might, to some extent, explain the longer lifespan in women compared with men. In contrast, our study found no strong evidence of adult sex differences in telomere lengths in either children or adults, although our study had a relatively small number of fathers. While the smaller father sample size means that their estimate was less precise, it is keeping with a previous meta-analysis that similarly found no difference according to sex using this type of qPCR analysis.46 Differences between males and females were only reliably detected by Southern hybridisation. Interestingly, another study showed no sex difference in telomere length at birth,31 suggesting that sex differences likely arise later in life. Further longitudinal studies are warranted to understand the dynamics, determinants and consequences of telomere attrition across the life course.
We showed that parent–child telomere length concordance was greatest for younger fathers, and diminished with parent age. Our oldest father group had a mean age of 58.6 years (SD 5.65), which is comparable to the ages of other studies but showed smaller father–child concordance.13 16 18 Njajou et al found a father–child correlation coefficient of 0.46 (CI not reported) in 164 pairs with mean father age of 49.0 years (SD 17.0).16 Complex interactions between prenatal and postnatal environment are likely to influence parent–child telomere length correlations in addition to well-described genetic variants.43 Given the general stability of the genome across the lifecourse, any parental age effect may be due to environmental influence over time, potentially manifesting in altered telomere length in the gametes (and progeny) as has previously been suggested.47–49 Indeed, more than one study has linked elongated telomeres in progeny with advanced paternal age,19 21 an effect not noted in our study. Further larger powered studies comprising offspring and both parents will shed light on this complex relationship.
Unanswered questions and future research
The present study is the first and largest telomere length data set of children and parents reported in a population-based Australian cohort. Parent–child concordance of telomere length was substantial for both father–child and mother–child pairs. We report stronger concordance in younger parents, which was most pronounced in younger fathers. This suggests that at 11–12 years of age, both parents contribute to child telomere length and that concordance may be stronger when the parent–child age gap is smaller. Our study may serve as a useful comparison with other populations of similar structure. Future studies should include both parents, longitudinal data with repeated measurements of telomere length, and detailed genetic and environmental data to investigate the complex inheritance patterns of telomere length.
Acknowledgments
This paper uses unit record data from Growing Up in Australia, the Longitudinal Study of Australian Children (LSAC). The study is conducted in partnership between the Department of Social Services (DSS), the Australian Institute of Family Studies (AIFS) and the Australian Bureau of Statistics (ABS). The authors
thank the LSAC and CheckPoint study participants, staff and students for their contributions.
References
Footnotes
MW and RS are joint senior authors.
This is an open access article distributed in accordance with the Creative Commons Attribution Non Commercial (CC BY-NC 4.0) license, which permits others to distribute, remix, adapt, build upon this work non-commercially, and license their derivative works on different terms, provided the original work is properly cited, appropriate credit is given, any changes made indicated, and the use is non-commercial. See: http://creativecommons.org/licenses/by-nc/4.0/
MW and RS contributed equally.
Contributors MTN, DPB, SR, KL, MW and RS conceptualised and developed the CheckPoint study. MTN helped with sample collection, isolated DNA, quantified telomere length, analysed the data and wrote the first draft of the manuscript. MW is the lead investigator of the Child Health CheckPoint study. RS and RV supervised laboratory work and protocol optimisation. ACG provided statistical support. All authors commented on the first and subsequent drafts and approved the final version of the manuscript.
Funding This work was supported by the National Health and Medical Research Council of Australia (Project Grants 1041352, 1109355), The Royal Children’s Hospital Foundation (2014-241), the Murdoch Children’s Research Institute (MCRI), the Department of Social Services, the University of Melbourne, the National Heart Foundation of Australia (100660) and the Financial Markets Foundation for Children (2014-055, 2016-310). MTN was supported by a National Health and Medical Research Council Postgraduate Scholarship (1115167). DPB was supported by a National Health and Medical Research Council Fellowship (1064629) and an Honorary Future Leader Fellowship of the National Heart Foundation of Australia (100369). SR was supported by a Murdoch Children’s Research Institute Clinician Scientist Award. KL was supported by a National Health and Medical Research Council Early Career Fellowship (1091124) and a National Heart Foundation Postdoctoral Fellowship (101239). RV was supported by an Australian Postgraduate Award. MW was supported by a National Health and Medical Research Council Senior Research Fellowship (1046518) and Cure Kids New Zealand. RS was supported by a National Health and Medical Research Council Senior Research Fellowship (1045161). The Murdoch Children’s Research Institute administered the research grants and provided infrastructural support (IT and Biospecimen management) to its staff and the study, but played no role in the conduct or analysis of the trial. The Department of Social Services played a role in study design; however, no other funding bodies had a role in the study design and conduct; data collection, management, analysis, and interpretation; preparation, review or approval of the manuscript and decision to submit the manuscript for publication. Research at the Murdoch Children’s Research Institute is supported by the Victorian Government’s Operational Infrastructure Support Program.
Disclaimer The findings and views reported in this paper are those of the author and should not be attributed to DSS, AIFS or the ABS.
Competing interests All authors have completed the ICMJE uniform disclosure form at www.icmje.org/coi_disclosure.pdf and declares financial support as described in the funding section.
Ethics approval The study protocol was approved by the Royal Children’s Hospital Melbourne Human Research Ethics Committee (33225D) and Australian Institute of Family Studies Ethics Committee (14-26).
Provenance and peer review Not commissioned; externally peer reviewed.
Data sharing statement The Longitudinal Study of Australian Children datasets and technical documents are available to researchers at no cost via a licence agreement. Data access requests are co-ordinated by the National Centre for Longitudinal Data. More information is available at https://dataverse.ada.edu.au/dataverse/lsac
Patient consent for publication Not required.