Article Text

Abstract
Objectives To assess the effects of an integrated care pathway on the use of primary and secondary healthcare by patients at high risk of emergency inpatient admission.
Design Observational study of a real-life deployment of integrated care, using patient-level administrative data. Regression analysis was used to compare integrated care patients with matched controls.
Setting A deprived, inner city London borough (Tower Hamlets).
Participants 1720 patients aged 50+ years registered with a general practitioner in Tower Hamlets and at high risk of emergency inpatient admission enrolled onto integrated care during 2014. These patients were matched to control patients, also selected from Tower Hamlets, with respect to demographics, diagnoses of health conditions, previous hospital use and risk score.
Interventions Enrolled patients were eligible for a range of interventions, such as case management, support with self-care and enhanced care coordination. Control patients received usual care.
Primary and secondary endpoints Number of emergency inpatient admissions in the year after enrolment onto integrated care. Secondary endpoints included numbers of elective inpatient admissions, inpatient bed days, accident and emergency attendances, outpatient attendances and general practitioner contacts in the year after enrolment.
Results There was no evidence that the integrated care pathway reduced patients’ healthcare utilisation in the first year post-enrolment. Matched controls and integrated care patients were similar at baseline. Following enrolment, integrated care patients were more likely than matched controls to experience elective inpatient admissions (adjusted incidence rate ratio (IRR)=1.27, 95% CI 1.08 to 1.49, p=0.004). They were also more likely to experience general practitioner contacts (adjusted IRR=1.11, 95% CI 1.06 to 1.16, p<0.001), but other endpoints were not significantly different between the groups.
Conclusions The integrated care pathway was not associated with a reduction in healthcare utilisation in the first year, but appeared to have increased elective inpatient admissions and general practitioner workload.
- primary care
- preventive medicine
- public health
This is an open access article distributed in accordance with the Creative Commons Attribution Non Commercial (CC BY-NC 4.0) license, which permits others to distribute, remix, adapt, build upon this work non-commercially, and license their derivative works on different terms, provided the original work is properly cited, appropriate credit is given, any changes made indicated, and the use is non-commercial. See: http://creativecommons.org/licenses/by-nc/4.0/.
Statistics from Altmetric.com
Strengths and limitations of this study
We evaluated the effect of a real-life implementation of an integrated care pathway on emergency inpatient admissions using an observational study of general practice and hospital administrative data.
We compared integrated care patients with local patients who were eligible for integrated care, but were receiving usual care. These were matched to the characteristics of integrated care patients (demographics, diagnoses of health conditions, previous hospital use and risk score) using a machine learning algorithm.
We used a method of post-match adjustment to further improve the similarity of the matched groups and conducted sensitivity analyses to assess whether confounding could plausibly have altered our findings.
We were only able to follow-up patients for 1 year post-enrolment on the integrated care pathway, which was itself at an early stage of implementation in Tower Hamlets.
We had to exclude approximately 30% of integrated care patients with the poorest health for whom we could not find a suitable match within the set of patients available to use as controls, and our analyses were underpowered compared with the original protocol.
Introduction
There is a long history of attempts to improve the care of people with long-term conditions, many of which are at high risk of hospital admission.1 These patients are responsible for a large proportion of healthcare spend and tend to be older and more complex.2–4 The care received by these individuals often becomes fragmented, with involvement from a wide variety of professionals and organisations. These can be poorly coordinated, resulting in duplication or omission of care, and risks to quality and safety. Integrated care has been proposed as a plausible way in which to improve the management of these patients, improving their experience and outcomes and, potentially, reducing hospital admissions and associated healthcare costs.5 6 Integrated care involves a variety of healthcare partners working closely together, across settings and localities to ‘dissolve traditional boundaries’7 between service providers, such as general practice, hospitals, social care, community providers and mental health services. It can involve a wide variety of separate interventions, but is characterised by a focus on individual case management and close coordination of providers’ operations and services.8
Early pilots of integrated care were run between 2003 and 2005 in England9 and were based on the Evercare programme in the USA.10 The intervention involved a case management approach. A comprehensive assessment was carried out by a practice nurse, resulting in an individualised care plan. Patients were then monitored at a frequency determined by their risk classification. In the USA, the Evercare programme was found to substantially reduce hospital admissions. In England, this was not the case, with the pilots having no identifiable effect on emergency hospital admissions, bed days or mortality.9 The difference in effectiveness might be explained by the interventions offered (the US version included intensive domiciliary care when patients became ill) and differences in settings, but Gravelle et al 9 also suggested that there were shortcomings in the method used to identify high-risk patients in England. The English pilots recruited patients aged 65 years or older with a history of at least two emergency admissions, but a study by Roland et al 11 showed that these patients tend to show reductions in admissions over time, even without any specific intervention, due to regression to the mean. Largely prompted by this observation, predictive models were developed that aimed to identify patients at high risk of experiencing hospital admission in the future.12 13
The theory behind the development of these models was that interventions such as case management are more likely to reduce hospital admissions if they are targeted more closely at patients who are likely to experience admission in the absence of the intervention. In 2009, a further set of integrated care pilots were conducted in England.14 Roland et al 15 evaluated six of these, which focused on intensive case management of older people at high risk of emergency admission. The sites made use of a range of methods to assess patient risk: four used the Patients At Risk for Rehospitalisation (PARR) model,12 one used the Combined Predictive Model16 and one used a combination of Chronic Obstructive Pulmonary Disease (COPD)-related clinical history and diagnostic tests.17 Patients receiving the pilot interventions were matched using Hospital Episode Statistics18 (HES) data to patients in other practices nationwide, where there was no comparable intervention.
Results were mixed, with the evaluation identifying an increase in emergency admissions and reduction in elective admissions and outpatient attendances. Although the sites varied in their approaches to integrated care and target population, the evaluation analysed all six sites together. The authors also identified differences (or imbalance) between the matched groups and differences in mortality, potentially indicating the presence of confounding.15 Other studies of this type have also necessarily required the grouping of sites and selection of comparison patients from a national set based on HES data, due to relatively small sample sizes and a lack of adequate comparison patients at the site level.19 More broadly, reviews of integrated approaches to care have shown mixed results.20–24 It is plausible that the wide range of settings, patient characteristics, models of care and study designs each contribute to the wide variety of results in the research literature.
The current study aimed to build on the work by Roland et al 15 by studying a deployment of integrated care in a single deprived English locality, where all patients receiving the intervention were compared with non-intervention patients from the same locality. Our study focused on integrated care in the London Borough of Tower Hamlets in 2014.25 The main aim of the pathway in Tower Hamlets is to improve the management of older patients with complex healthcare needs. These patients often have long-term and multiple conditions. Analysis by Tower Hamlets Clinical Commissioning Group (CCG) had found that around 80% of their spending was attributable to treating these patients.26 This is primarily because they account for the majority of emergency hospital admissions, but they also tend to make frequent use of general practitioner (GP), community and social care services. By integrating care among these providers, Tower Hamlets CCG aims to radically improve the care management of these patients, reducing emergency inpatient admissions and accident and emergency attendances, empowering patients and improving their experience of care.
The purpose of the current study was not to evaluate each of the specific interventions that could be received on the pathway, but rather to determine the effect enrolment on the integrated care pathway had on patients’ utilisation of healthcare in Tower Hamlets. We compared integrated care patients to a closely matched subset of patients from Tower Hamlets that were not enrolled onto the programme. Although randomised controlled trials can be used to provide an unbiased estimate of intervention effects, they have limited applicability to evaluating models of care that have been implemented in routine practice.27 Thus, we used quasi-experimental methods28 to study the effect of integrated care on healthcare utilisation. However, rather than relying primarily on HES data like Roland et al,15 we also made use of primary care data. We used novel methods, including a machine learning approach to matching (genetic matching29 30) and post-match adjustment (entropy balancing31) to create a comparison group that was closely matched to the integrated care patients with respect to observed baseline characteristics.32 These approaches can dramatically improve the similarity (or balance) of the matched groups in studies of this type.19 33 Also, entropy balancing31 has not previously been applied in this area. We compared the findings from the genetic matching alone to those achieved once the matched data had also been adjusted using entropy balancing.
Methods
In 2013, National Health Service (NHS) England selected 14 Integrated Care Pioneers across England to develop innovative approaches to delivering integrated approaches to care.34 One of these sites was in East London. Tower Hamlets CCG partnered with neighbouring CCGs and councils in Waltham Forest and Newham, along with Barts Health NHS Trust, North East London Foundation Trust, East London Foundation Trust and University College London (UCL) Partners to develop the programme.26 Although several CCGs were involved in the integrated care programme, we studied its effect for patients who were registered with a general practice in the Tower Hamlets CCG area and were enrolled during 2014. The study deviated from the original evaluation protocol (see online supplementary protocol 35) as it had intended to also include patients in the London Boroughs of Waltham Forest and Newham. However, it was not possible to gain access to the necessary data in a timely manner for inclusion in this study. Additional power calculations were conducted to investigate the possible effects of this change on the statistical power of the study (see online supplementary methods). Additionally, a planned analysis of costs was not undertaken, as we did not have access to information on the costs of the programme in Tower Hamlets.
Supplemental material
Supplemental material
Integrated care
Eligibility for integrated care in Tower Hamlets was based on patients’ age and risk score, using the ‘QAdmissions’ risk algorithm.13 QAdmissions uses primary care data to predict the risk of emergency hospital admission in the next 2 years, for patients who are aged between 18 and 100 years. It is available to GPs as part of the EMIS Web clinical IT system.36 Patients aged 50+ years with risk scores in the top 20% of patients (ie, highest quintile of risk) could be offered enrolment by their GPs. To be successfully enrolled, patients needed to also provide consent for their records to be shared by local partners: providers of primary, acute and mental healthcare and the local authority (for social care). Patients who refused were ineligible, as information sharing was considered a necessary feature of integrated care. However, work was ongoing to set up information sharing systems. As a temporary solution, patient lists were shared with mental health and social care partners so that they could flag integrated care patients on their own systems.37 During 2014, acute, primary and out-of-hours case management systems were linked, with mental health and local authority systems linked in mid-2015. During 2014, a sustained effort was undertaken by Tower Hamlets CCG to enrol all eligible individuals onto the integrated care pathway. They aimed to enrol 6% of the Tower Hamlets population by 2015/2016.37
Integrated care in Tower Hamlets focused on integration of primary and community provision.25 It comprised a range of interventions selected to meet the needs of each patient, provided primarily by integrated local community health teams.26 These teams developed a care plan for enrolled patients, provided community nursing, palliative care, community rehabilitation, support with self-care and self-management, adult respiratory care and rehabilitation and discharge support, while coordinating access to specialist teams, including mental health.26 The teams formed links with social workers to take account of wider social issues and improve planning of care and support. The teams were available 7 days a week, between 08:00 and 22:00, to provide a rapid response to individual care needs.
Study populations
We made use of hospital data linked to general practice records for patients registered in Tower Hamlets. The North East London Commissioning Support Unit (NEL CSU) transferred cleaned and pseudonymised general practice data, risk scores, Secondary Uses Service hospital data and patients’ home locality identifiers (in the form of lower layer super output area (LSOA)) to the Secure Data Environment (SDE) of the Health Foundation.
We studied patients enrolled onto the integrated care pathway at any point between January 2014 and December 2014. GPs used a specific Read code38 to record which patients were enrolled on the integrated care pathway and the date they were enrolled. Separate Read codes also identified whether patients had given or withheld their consent for their data to be shared with local partners, and the date the consent was given or withheld. Both a valid data sharing consent code and an integrated care pathway code were required for a patient to be considered enrolled on integrated care for the purposes of the study.
We aimed to match patients on 3 years of historical healthcare utilisation, and so excluded patients who had not been registered with a GP in Tower Hamlets for at least 3 years prior to being enrolled onto the pathway. After an initial descriptive analysis of risk profiles, we limited our analysis to patients within the top 7.5% of patients by risk score, because almost all patients enrolled on integrated care were within this group (see online supplementary methods).
Any patients with a gap in registration of greater than 6 months were excluded, along with any who left the pathway or rescinded permission for local partners to share their information after enrolment. A small number of patients were excluded for other reasons (missing data).
The control group was composed of patients aged 50+ years, registered in Tower Hamlets, who had not been enrolled onto integrated care by the end of 2014. As before, this group was also restricted to those within the top 7.5% by risk score, after an initial descriptive analysis (see online supplementary methods), and required 3 years of healthcare utilisation history and no gaps in registration greater than 6 months. From this wider population, we aimed to select a subset of matched controls who were comparable with the integrated care group with respect to the baseline variables. Controls were matched to enrolled patients based on a wide set of important prognostic variables, including: risk score, demographic characteristics, diagnoses of health conditions and prior hospital utilisation. The algorithm used to perform the matching is described in more detail in the online supplementary methods.
Study endpoints
The main hypothesis we tested was that enrolment on integrated care had an effect (in either direction) on the number of emergency inpatient admissions experienced by patients, in the year following intervention. Although follow-up was a maximum of 1 year post-enrolment, it could have been less than this, due to patients dying during the follow-up period.
Secondary endpoints we analysed included the number of elective inpatient admissions, inpatient bed days, accident and emergency attendances, outpatient attendances and GP contacts in the year following intervention. The following definitions were used for endpoints:
Inpatient appointments were defined as a unique patient, admission date and discharge date combination. The admissions were separated into those which were emergencies and those which were elective (ie, planned and non-urgent). Admissions to any hospital in England were included.
Only one accident and emergency attendance per patient per day was included. Attendances at any hospital in England were included.
Outpatient appointments were defined as a unique patient and appointment date combination, and only appointments where the patient attended were included. Appointments at any hospital in England were included.
GP contacts were defined as a unique patient, practitioner, date and appointment type combination. Only face-to-face appointments where the patient attended, home visits where the practitioner attended or telephone appointments which were answered by the patient were included.
Baseline variables
We aimed to identify confounding variables at baseline that might account for the effect of integrated care on the study endpoints. Confounding variables are those that are associated with both treatment assignment and study endpoints.39 Baseline variables were derived for integrated care patients at the date of enrolment. For control patients, they were derived at each of 12 potential index dates during 2014 (see online supplementary methods). The set of baseline variables was broadly based on those used in the QAdmissions risk algorithm,13 but some used in QAdmissions were not in the data provided by NEL CSU, and many were included that are not used in the QAdmissions algorithm. By including a large set of variables, we aimed to produce closely matched groups and so reduce the risk of confounding.
The variables were: sex; age (and age squared); QAdmissions risk score; index of multiple deprivation (IMD) score; ethnicity; smoking behaviour; healthcare utilisation histories (number of emergency inpatient admissions, elective inpatient admissions, inpatient bed days, accident and emergency attendances, outpatient attendances and GP contacts) all counted during 0–1 months, 1–6 months, 6–12 months, 12–24 months and 24–36 months prior to intervention or index date; 28 variables identified from general practice data diagnosing or measuring health conditions or risks; 7 variables identifying other interventions received (also from general practice data); whether the patient required an interpreter; seasonality (in which quarter of the year the intervention/index date occurred); and which local health network the patient was registered at. Patients’ home localities (in the form of LSOAs) were used to identify level of deprivation, measured using the IMD score.40 The complete list of included variables can be found in tables 1 and 2.
Descriptive statistics and standardised differences for non-binary baseline variables, before matching and after matching and entropy balancing, for controls and integrated care patients (figures after matching, but before entropy balancing, are available in online supplementary tables 3 and 4)
Supplemental material
Descriptive statistics and standardised differences for binary baseline variables, before matching and after matching and entropy balancing, for controls and integrated care patients (figures after matching, but before entropy balancing, are available in online supplementary tables 3 and 4)
In addition to these baseline variables, we also estimated the propensity score of selection into the treatment group.32 A logistic regression model was estimated, regressing a binary indicator of treatment group (integrated care or control) on the set of baseline variables. The propensity score (in the form of the predicted logit) was then included as an additional baseline variable in the matching process, as is recommended by Sekhon.29
Selecting matched controls
The matching algorithm30 41 42 (see online supplementary methods) aimed to select a subset of control observations that were comparable with the integrated care patients, with respect to baseline variables.32 We enforced callipers of 0.2 SD on the key matching variables of risk score, propensity score and measures of prior emergency inpatient admissions (for each of the five historical time periods). A calliper specification of 0.2 SD is generally regarded as optimal for reducing error and bias on key variables in matched samples.43
Our main diagnostic measure was ‘balance’, or the similarity of the distribution of baseline variables between integrated care and matched control groups. We assessed balance using the standardised difference, defined as the difference in means of the two groups, divided by the SD in the study group (integrated care). Formal statistical tests are not recommended for comparing matched groups at baseline, since they depend on the size of the groups as well as their similarity.44 Although the standardised difference would ideally be minimised without limit, 10% is often used as a threshold, over which there is assumed to be a meaningful imbalance.45 46
Once control observations had been matched to the integrated care patients, they were weighted using the entropy balancing method. With this method, it is possible to improve the balance of matched groups to the point at which they are practically identical in terms of the standardised difference.42 Hence, we aimed to attain matched groups that were near-perfectly balanced.
Statistical approach
Comparisons of endpoints in the matched and balanced data were made using negative binomial regression models for count data. These are a generalisation of Poisson models, the key difference being the inclusion of a parameter to account for overdispersion in the modelled variable, commonly found in count data.47
Cluster robust SEs were used—a generalisation of the Huber-White sandwich method.48 This accounts for possible non-independence of observations introduced where multiple ‘observations’ from a single control patient could be included in the analysis, due to the use of index dates. A supplementary investigation of residual intraclass correlations demonstrated that this sufficiently accounted for clustering in the data (see online supplementary methods).
Analyses were adjusted using the baseline variables. Patients who died during follow-up were included in the analysis by incorporating an exposure term in the models49 to account for varying follow-up (ie, integrated care exposure) durations. Otherwise, all patients experienced 1 year of integrated care by the end of the follow-up period. Models were estimated after the matched dataset had been created using genetic matching and again after adjustment using entropy balancing. The results were compared. The α=5% level of statistical significance was used as a general yardstick against which to compare the significance of findings.
Secondary analysis
The main threat to the validity of studies using matched data is that the groups being compared differ at baseline in ways that also affect the endpoint studied. Although the integrated care and control groups appeared similar after matching, these groups may have differed in ways that were unobserved. Therefore, we conducted a range of analyses to assess the risk of unobserved confounding.
First, we compared the survival of the matched groups using plots of the Kaplan-Meier estimator50 and logistic regression models. We did this because we did not expect the integrated care pathway to have an impact on mortality rates over the first year. A difference in the survival rates might therefore indicate that the groups were different at baseline.
Second, we employed an alternative approach to estimating the impact of the integrated care pathway on use of primary and secondary care, based on applying difference-in-difference methods to the matched and entropy-balanced data.51 We did this because difference-in-difference analysis makes a different set of assumptions in relation to confounding than the regression adjustment methods used in the primary analysis. Specifically, difference-in-difference analysis can control for the effect of confounders (whether observed or unobserved), providing that their association with the endpoint is constant over time. However, unlike in our primary analysis, we could not adjust explicitly for remaining differences in the observed baseline variables after matching. When applying the difference-in-difference method, we calculated the endpoints across two time periods: the 12 months prior to and after intervention. We compared the two groups by estimating an interaction between the group indicator and time period indicator. As with the main analysis, we used negative binomial models with cluster robust SEs and an exposure term.
Finally, we conducted a sensitivity analysis to test the robustness of our findings to time varying, unobserved confounding. This involved simulating a hypothetical unobserved confounder, which was assumed to be binary. We assumed a range of values for the associations between the unobserved confounder and intervention status (integrated care or control) and between the unobserved confounder and the various endpoints. We used a method developed by Carnegie et al 52 to determine how strong these associations would have to be for our findings to be altered.
Research ethics and information governance
All data were stored and analysed in the Health Foundation’s SDE. The SDE is an ISO27001-compliant,53 non-networked data environment, restricted to authorised individuals. The evaluation team had no access to identifiable patient data. All outputs transferred out of the SDE were cleared in accordance with Statistical Disclosure Control procedures.54 The study protocol was approved by the Waltham Forest, East London and City Collaborative evaluation steering group in June 2015 (see online supplementary protocol). Formal ethical approval was not sought as the study was based on retrospective analysis of existing pseudonymised administrative data, for the purposes of service evaluation.
Patient and public involvement
Patients and the public were not directly involved in the conduct of this study. However, the study was overseen by the Waltham Forest, East London and City Collaborative. The collaborative directly involves patients in the design and development of integrated care in Tower Hamlets.55
Results
Study populations
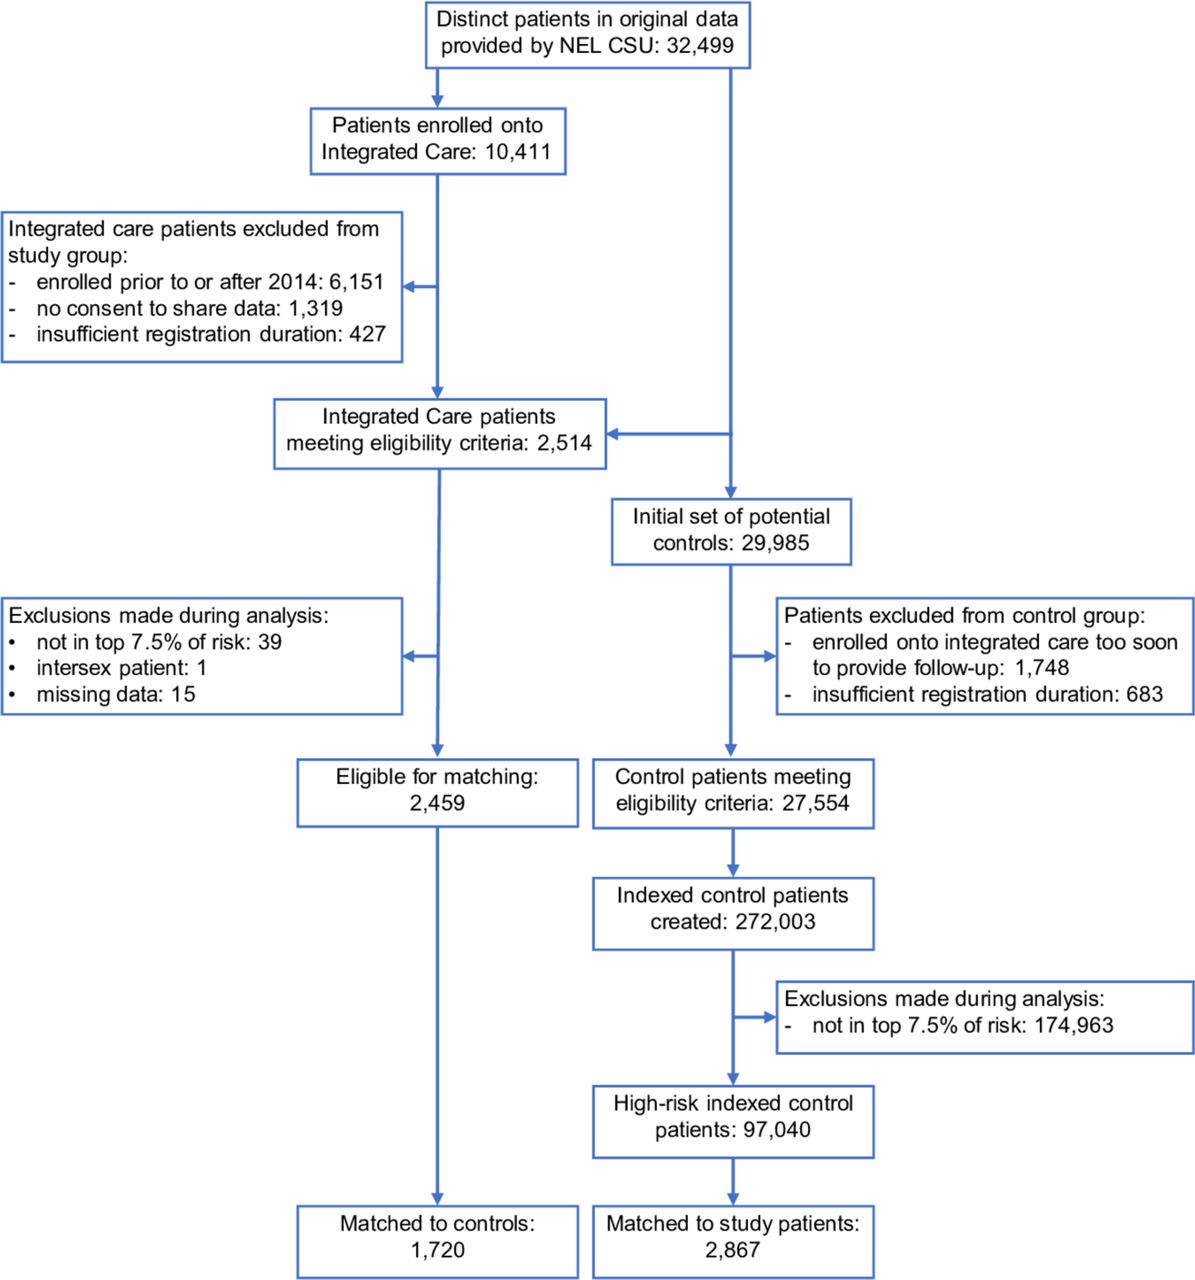
Of the 32 499 patients in the data supplied by the NEL CSU, 10 411 patients were enrolled onto integrated care, 2514 patients passed the inclusion criteria, 2459 were in the top 7.5% of risk and 1720 (70%) were matched to controls (figure 1). A total of 29 985 patients were included in the initial pool of potential controls, of which 27 554 passed the inclusion criteria, leading to 272 003 observations, after assigning multiple index dates. After restricting these control observations to those within the top 7.5% of risk, there were 97 040 control observations. Two thousand eight hundred and sixty-seven of these were matched to integrated care patients and reweighted by the genetic matching algorithm to correspond to the sample size of the integrated care group (n=1720).

Selection of patients for the integrated care and indexed control groups. NEL CSU, North East London Commissioning Support Unit.
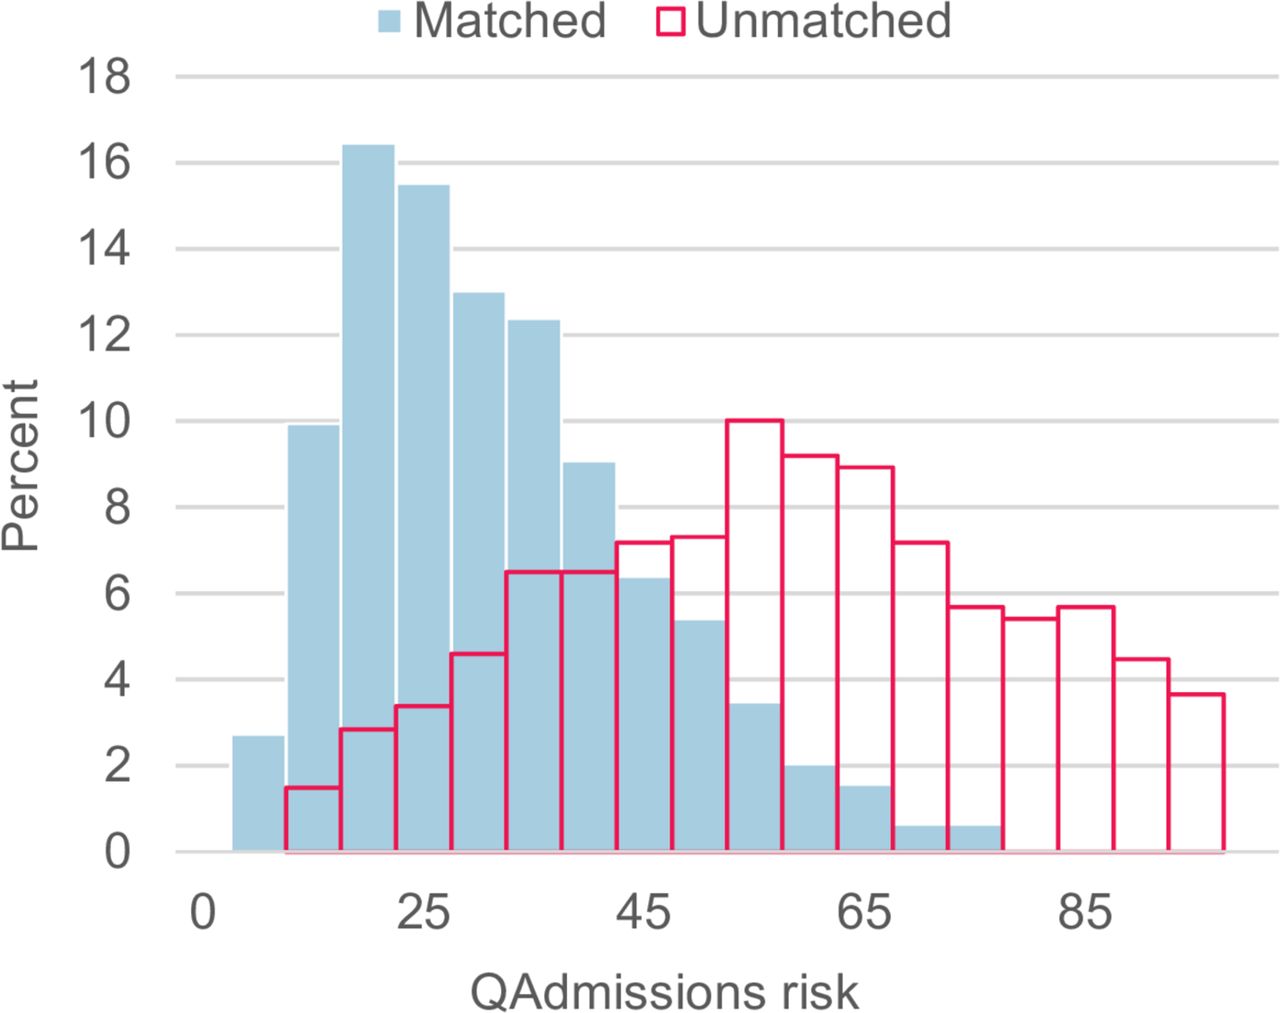
The risk scores of integrated care patients who were successfully matched to controls were compared with those who remained unmatched. This demonstrated that there was some difficulty in finding matches for integrated care patients who had very high risk scores (figure 2). Descriptive statistics reflected this difference, with unmatched integrated care patients having poorer health than matched patients (see online supplementary tables 1 and 2). Likewise, the unmatched control observations tended to be from patients who had better health than those who were successfully matched. Thus, patients who had the poorest health tended to be under-represented in the pool of potential control observations.

Comparison of risk scores for unmatched and matched integrated care patients.
Before matching, integrated care patients had higher risk scores than the control observations (42.22 vs 21.95) and higher historical healthcare utilisation on average. After genetic matching, the controls had similar characteristics to the matched integrated care patients. For example, the risk score was nearly identical (34.56 vs 34.41). After genetic matching, balance was reasonable, but remained above the 10% threshold on a quarter of the baseline variables. One—a dummy variable identifying registration at one of the local health networks—had a standardised difference of above 15% (15.86%), with 6.3% of the integrated care group registered in that network, whereas 10.2% of the control group was registered in that network (see online supplementary tables 3 and 4).
The post-match adjustment using entropy balancing substantially improved balance, and indeed the means of all variables were practically identical (tables 1 and 2), with all standardised differences below the 10% threshold; only one was above 1% (1.62%, inpatient bed days 12–24 months prior to intervention/index date), with a mean of 2.55 days for the integrated care group and 2.32 days for the control group.
Comparisons of healthcare utilisation
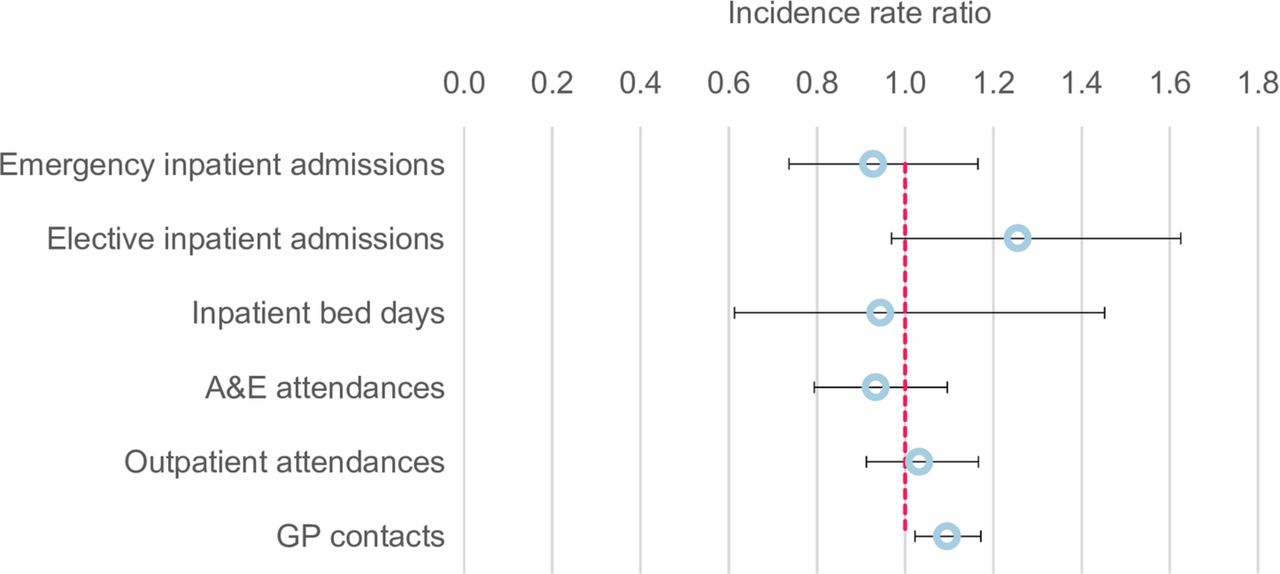
Figure 3 graphically presents the point estimates and associated confidence intervals for each endpoint. After genetic matching, but before adjustment with entropy balancing, there was no evidence that enrolment on integrated care was associated with a reduction in the main study endpoint of emergency inpatient admissions during the follow-up period (table 3, −1.3%, p=0.870; 95% CI −15.2% to 14.9%). It was associated with a 16.3% higher rate of elective inpatient admissions, compared with the matched control group (p=0.048, 95% CI 0.1% to 35.1%; 887 admissions in the integrated care group vs 661 in the control group) and a 10.7% higher rate of GP contacts, which was highly significant (p<0.001, 95% CI 6.2% to 15.4%; 25 585 contacts vs 22 654 contacts). There were no significant differences between the two groups in the other healthcare utilisation endpoints.

Point estimates and confidence intervals of modelled endpoints after genetic matching and entropy balancing. GP, general practitioner.
Comparisons of modelled endpoints after genetic matching only and after genetic matching and entropy balancing
After entropy balancing of the matched data, again there was no evidence of a reduction in the main study endpoint of emergency inpatient admissions (−3.2%, p=0.694; 95% CI −17.4% to 13.6%). Enrolment on integrated care was associated with a 26.8% higher rate of elective inpatient admissions during the follow-up period, compared with the matched control group (table 3, p=0.004, 95% CI 8.0% to 48.7%; 882 admissions in the integrated care group vs 676 in the control group). It was also associated with an 11.0% higher rate of GP contacts (p<0.001, 95% CI 5.8% to 16.5%; 25 645 contacts vs 23 002 contacts). As before, there were no significant differences between the two groups in the remaining healthcare utilisation endpoints.
Secondary analysis: unobserved confounding
After matching and balancing, 4.77% of integrated care patients and 7.41% of controls died during follow-up (figure 4). A logistic regression model for death found that the difference in survival was not significant after matching (OR 0.716, p=0.086, 95% CI 0.489 to 1.048) or matching and entropy balancing (OR 0.682, p=0.055, 95% CI 0.460 to 1.009), despite being suggestive of reduced mortality in the integrated care group.

Plots of Kaplan-Meier estimator for controls and integrated care patients after genetic matching (note: the last data point for integrated care patients has been hidden for Statistical Disclosure Control reasons).
Difference-in-difference analysis was conducted on the entropy balanced data and broadly supported the findings of the main analysis (figure 5). It showed a similar trend towards more elective inpatient admissions among integrated care patients, although this was not significant (table 4, 25.48% higher incidence rate, p=0.085, 95% CI 0.969 to 1.625), and more GP contacts, which remained significant (9.43% higher incidence rate, p=0.010, 95% CI 1.022 to 1.172).
Point estimates and CIs from difference-in-difference analysis. GP, general practitioner.
Results from difference-in-difference analysis
Figure 6 shows the results of the sensitivity analysis that simulated a binary unobserved confounder. In this figure, the blue lines show the degree of confounding required to obscure a statistically significant reduction in emergency inpatient admissions. The red line identifies the amount of confounding that would result in a treatment effect of exactly zero. While we cannot measure unobserved variables, we did have data on many observed variables (such as age, diagnoses and so on), and these are plotted on the figure as squares and crosses. These variables are generally clustered well below the blue contours. This suggests that, for us to have missed a significant reduction in emergency admissions, any unobserved confounder would have to be more strongly associated with both enrolment on integrated care and the main study endpoint than these variables. This seems unlikely considering the wide variety of observed variables included in the analysis.

Sensitivity analysis for the effect of unobserved confounding (note: the plot shows the amount of unobserved confounding that would be required to obscure various treatment effects (represented by the black contours). The vertical axis shows the simulated association with the endpoint (emergency inpatient admissions) and the horizontal axis shows the simulated association with treatment status (enrolment on integrated care). These parameters are plotted for the observed baseline variables (the blue crosses indicate associations which were originally negative that have been transformed to positive values on the vertical axis by multiplying by -1). The blue contours identify the strength of confounding required to obscure a statistically significant finding (ie, an increase or decrease in emergency inpatient admissions), while the red contour identifies the amount of confounding which would result in a treatment effect of zero. The estimated effect of integrated care identified in the original analysis is shown on the right-hand side of the horizontal axis (-0.03). The degree of confounding required for any of these situations can be compared with the associations for the observed baseline variables. Thus, for an unobserved confounder to obscure a statistically significant reduction in emergency inpatient admissions caused by integrated care, it would need to be as strongly associated with both the intervention and endpoint as the most strongly associated baseline variables: age or age squared).
Discussion
Statement of findings
We did not find any reliable evidence that the integrated care pathway in Tower Hamlets reduced healthcare utilisation by patients in the first year post-enrolment. Integrated care has been introduced in the London Borough of Tower Hamlets with the aim of controlling demand as the size of the older population increases. Tower Hamlets faces unique challenges due to being one of the most deprived London boroughs and having a high proportion of patients suffering from long-term and complex conditions. By integrating care between local providers, Tower Hamlets CCG aims to improve care planning and coordination and reduce emergency admissions and attendances, the ultimate goal being to reduce the healthcare costs attributable to high-risk patients.
We compared a sample of patients enrolled onto integrated care in the London Borough of Tower Hamlets to a matched, balanced control group from the same locality, using patient-level primary care and hospital administrative data. Although the integrated care pathway aimed to reduce healthcare use, we found no evidence that it reduced emergency inpatient admissions, inpatient bed days, accident and emergency attendances or outpatient attendances in the first year post-enrolment. However, we did find that integrated care patients experienced more elective inpatient admissions and general practice contacts than control patients.
Strengths and weaknesses of this study
This study built on that of Roland et al 15 by using matching methods and risk scoring to create a comparable control group and by drawing that control group from the same locality as the patients in receipt of the intervention. Likewise, rather than relying on hospital data to identify diagnoses, this study made use of general practice data to create a broad set of baseline variables with which to characterise patients.
A wide range of relevant information was incorporated into the matching and analysis, including QAdmissions risk score, demographics, physical characteristics, diagnoses, historical healthcare utilisation patterns and area level information. As a result, the study aimed to identify a closely matched control group that was very similar to the integrated care patients with respect to each of these variables. We also made use of machine learning and post-match adjustment to improve the quality of the match and the balance of the final dataset. The similarity of the results before and after post-match adjustment with entropy balancing provides some reassurance that the matching and analysis had effectively accounted for observable differences between the groups at baseline. The final matched dataset achieved near-perfect balance and, as far as we are aware, this is the first implementation of the entropy balancing method in a study of integrated care.
We investigated the likelihood of confounding affecting our results in a variety of ways. No significant difference in mortality was identified between the two groups using survival analysis, which was expected to be the case for an intervention of this type and duration. Difference-in-difference analysis broadly supported the findings of the main analysis and the simulation of an unobserved confounder also suggested that unmeasured differences between the groups were unlikely to have affected this result—an unobserved confounder would need to be as strongly associated with both treatment status and our main endpoint as the most strongly associated baseline variables (‘age’ and ‘age squared’) to obscure a reduction in emergency inpatient admissions due to integrated care. Nevertheless, as with any observational study of this type, we cannot rule out the possibility that the two groups differed at baseline in ways that could have influenced their healthcare utilisation during follow-up.
Despite these strengths, there were several limitations with our study. First, we had originally intended to include patients from three London boroughs (see online supplementary protocol), but Tower Hamlets was the only CCG able to provide the necessary data in a timely manner. As a result, the sample sizes available for analysis were much smaller than originally intended, and this reduced the statistical power of the study. Also, the success of Tower Hamlets in enrolling high-risk patients onto the integrated care pathway meant that there were too few available high-risk controls to match to the enrolled patients: a significant proportion (30.05%) of integrated care patients with the highest risk scores could not be matched. Thus, the results relate to the 1720 integrated care patients included in the analysis, who were lower risk than the unmatched integrated care patients, on average (figure 2). If patients within the top 20% of risk scores had been equally likely to be enrolled onto integrated care, irrespective of their specific risk score, several limitations to the study would have been ameliorated. Considering that the long-term aim of Tower Hamlets CCG is to enrol all patients within the top 20% of risk scores, this may warrant consideration for the design of similar programmes in the future. Ultimately, the study was underpowered compared with the intended design in the original protocol (see online supplementary protocol).
Nevertheless, we were still able to include most of the integrated care patients in the analysis, and this proportion compares favourably with survey-based studies, where response rates can lead to markedly lower coverage.56 Making use of administrative data avoids problems such as the misreporting of service use by patients.57 However, data quality was not directly under our control58; we were reliant on the quality of the data provided by NEL CSU. Potential problems with administrative data include inaccurate reporting, duplicate records and a reliance on historical test results.
Other limitations of our study relate to the duration of follow-up and progress on implementation of integrated care in Tower Hamlets. We were only able to assess the effect of the pathway over a relatively short time period, that is, the first year after enrolment. It is quite plausible that integrated care might have other effects on healthcare utilisation over a longer post-enrolment duration. Also, we could not assess the impact of integrated care on other outcomes the pathway seeks to address, such as patient experience of care, patient empowerment and so on, which may have shown more positive results. Finally, we evaluated the integrated care pathway at a very early stage in its implementation. Enrolment began in September 2013, and we studied patients enrolled during 2014. It is highly likely that steps were taken by commissioners, managers and practitioners to improve it, which may have led to substantive changes in implementation over this period. Finally, the way in which integrated care was implemented in Tower Hamlets, combined with the small geographic area and specific characteristics of the population, limit the generalisability of our findings.
Comparison with other studies and possible explanations
Our study did not return comparable results with that of Roland et al,15 who identified increases in emergency inpatient admissions and reductions in elective inpatient admissions and outpatient attendances. Thus, the evidence for integrated care overall remains mixed.20–24 It seems likely that any impact on healthcare utilisation is highly context specific, depending on the study population, locality, implementation, duration and other factors that vary between studies.
However, the increase in GP contacts and elective admissions that we identified is indicative of a phenomenon reported in other studies: ‘supply-induced demand’.9 15 Particularly where health needs are high, there is an increased likelihood of unmet needs being identified by any new provision. Tower Hamlets is one of the most deprived local authorities in London, with unusually high rates of long-term and complex health problems. If the delivery of integrated care was identifying unmet needs, this might explain the increase in elective inpatient admissions and GP contacts we identified in our study. Also, new provision can lead to increased utilisation, simply because more flexible provision (such as out-of-hours GP services) may be used in addition to, rather than as a substitute for, usual services.59
If unmet need was responsible for these results, it is possible that further development of the pathway and longer periods of enrolment may have improved outcomes in later years, if these needs were being met. Shaw and Levenson60 have suggested that 2 years of initial development followed by a minimum of 1 year of ‘live’ working is required to demonstrate the initial impact of major changes to service organisation and provision. The Tower Hamlets programme was in its infancy during 2014, and there have been ongoing efforts to develop it since then. In 2015, the Tower Hamlets Integrated Provider Partnership was selected as one of the vanguard sites to test the comprehensive integration of health and social care services,61 a natural progression from the healthcare integration implemented in 2013/2014. More recently, Tower Hamlets has implemented Integrated Personal Commissioning,62 which seeks to improve health and well-being by providing personal budgets that can be spent on (non-health service) care and support needs. Each of these developments may lead to a reduction in unmet need and increase the overall impact of health and social care services on older patients’ health and well-being.
Conclusions
The integrated care programme in Tower Hamlets did not reduce emergency inpatient admissions for patients enrolled during the first calendar year of implementation (January–December 2014). These patients did experience higher numbers of elective inpatient admissions and GP contacts in the follow-up year compared with a matched control group. However, due to the short follow-up of the study, we cannot rule out the possibility that the integrated care programme may have had beneficial effects on patient health and healthcare utilisation in following years. Also, due to a lack of control patients to match with the highest-risk integrated care patients, we cannot rule out that the programme may have been more beneficial for the very highest-risk patients.
Future research would benefit from longer durations of follow-up and a larger pool of similar control patients from which to draw suitable matches. With larger sample sizes, studies of this type have increased power, the potential for improved matching and an increased ability to undertake subgroup analyses. With longer durations of follow-up, potential effects on mortality could also be investigated. Of course, the practicalities of analysing real-life deployments of health service interventions can often limit the scope for researchers to optimise study design, particularly where efficient and targeted enrolment reduces the pool of comparable control patients.
The findings from this study, and other recent research by the Health Foundation,63 suggest that policy makers need to be realistic about what can be achieved early on in the implementation of integrated care pathways. Where there is a strong likelihood of considerable unmet healthcare needs, policy makers should consider that there may be an initial increase in healthcare utilisation by integrated care patients. Where enrolment of patients is limited due to inherent capacity constraints, policy makers should consider designing enrolment procedures to aid ongoing and high-quality evaluation of these programmes.
Acknowledgments
The authors would like to thank Tower Hamlets Clinical Commissioning Group (CCG) and the Waltham Forest, East London and City Collaborative evaluation steering group for their assistance in the undertaking of this study, and North East London Commissioning Support Unit (NEL CSU) for providing the data used. Analyses were performed using SAS Enterprise V.7.12 HF2 (SAS Institute, Raleigh, North Carolina, USA), Stata V.13 (StataCorp LLC, College Station, Texas, USA) and R 3.4.3 (http://www.r-project.org).
References
Footnotes
Contributors AS and ATW designed the original study protocol. ATW liaised with the programme about participant data and organised the data linkage. RJB undertook additional data preparation and manipulation. WP performed the analysis. WP prepared the manuscript. AS reviewed the manuscript. AS was the study guarantor and confirms that this paper is an accurate representation of the study findings. The named authors conducted this study independently of Tower Hamlets CCG and NEL CSU; the authors were solely responsible for the decision to submit this manuscript for publication.
Funding The study was funded by The Health Foundation. Registered charity number 286967.
Competing interests None declared.
Provenance and peer review Not commissioned; externally peer reviewed.
Data sharing statement No data are available. The data used in this study comprise highly sensitive health records of individual patients, with a high risk of identifiability. As such, they are stored in a highly secure data environment and are not available for sharing.
Patient consent for publication Not required.