Article Text

Abstract
Objectives Despite some progress, Brazil is still one of the most unequal countries, and the extent of socioeconomic inequalities in adolescent health is unclear. We assessed trends in socioeconomic inequalities in adolescent’s health-related behaviours in Brazil between 2009 and 2015.
Design We used cross-sectional data from the Brazilian National Survey of School Health carried out in 2009, 2012 and 2015.
Setting Brazilian state capitals.
Participants Students attending ninth grade from public and private schools in Brazilian state capitals in 2009 (60 973 students), 2012 (61 145 students) and 2015 (51 192 students).
Main outcome measure We assessed 12 health-related behaviours (irregular fruit, vegetables and bean consumption; regular soft drink consumption; irregular physical activity; alcohol, drug and tobacco use; unsafe sex; involvement in gun fights; bullying victimisation and domestic violence victimisation), under the broad domains of lifestyle risk behaviours, engagement in risky activities and exposure to violence. Socioeconomic status was assessed through an asset-based wealth index derived from principal component analysis. Absolute and relative inequalities in these health behaviours and inequalities trends were investigated.
Results From 2009 to 2015, prevalence of certain harmful health-related behaviours increased, such as unsafe sex (21.5% to 33.9%), domestic violence (9.5% to 16.2%), bullying victimisation (14.2% to 21.7%) and irregular consumption of beans (37.5% to 43.7%). Other indicators decreased: alcohol use (27.1% to 23.2%), irregular physical activity (83.0% to 75.6%) and consumption of soft drinks (37.2% to 28.8%). Over the period, we found consistent evidence of decreasing health inequalities for lifestyle behaviours (fruit, bean and soft drink consumption) and alcohol use, set against increasing inequalities in violence (domestic violence, fights using guns and bullying victimisation).
Conclusion Socioeconomic inequality increased in the violence domain and decreased for lifestyle behaviours among Brazilian adolescents. Widening gaps in violence domain urge immediately policy measures in Brazil.
- adolescents
- social inequalities
- health behaviors
- lifestyle
This is an open access article distributed in accordance with the Creative Commons Attribution Non Commercial (CC BY-NC 4.0) license, which permits others to distribute, remix, adapt, build upon this work non-commercially, and license their derivative works on different terms, provided the original work is properly cited, appropriate credit is given, any changes made indicated, and the use is non-commercial. See: http://creativecommons.org/licenses/by-nc/4.0/.
Statistics from Altmetric.com
Strengths and limitations of this study
We assessed the extent of socioeconomic inequalities in adolescent health and how it has changed over time in a middle-income country.
We used large representative urban samples from Brazilian adolescents attending public and private schools.
Another strength of this study was the use of complex measures of inequality.
Although we have used validated questionnaires, the self-report of behaviours may cause some degree of classification bias.
The period of 6 years may be too short to expect significant changes in inequalities.
Introduction
Adolescence is a critical period for promotion of human development. During adolescence, biological, cognitive, emotional and social capabilities are founded and future patterns of adult health are established.1 Despite its clear importance, adolescent’s health has been generally overlooked in social policies. In order to guide surveillance, investments and policy actions, a broad concept of adolescent health has been proposed by The Lancet Commission on adolescent health. This concept includes aspects related to sexual and reproductive health, nutritional deficiencies, injury and violence, physical and mental health and substance use disorders.2
Socioeconomic factors strongly predict adolescent health.3 Socioeconomic inequalities have consistently increased over the last decades in the USA and Europe,4 and this trend coincides with widening gaps in indicators of adolescent health.5 For instance, a time-series analysis of 34 North American and European countries showed an increase in inequalities between socioeconomic groups in physical activity, body mass index and psychological and physical symptoms between 2002 and 2010.5
Studies monitoring inequality in adolescent health in low/middle-income countries are sparse in the literature. Brazil is still one of the most unequal countries worldwide,6 although considerable social protection efforts have been adopted in the last decades (eg, creation of a free public universal health system, expanding community-based primary care and providing a robust conditional cash transfer programme).7 These social programmes have had positive impacts on adult health, especially among the most deprived, with increased overall food quality and diversity,8 reduced racial inequalities in health9 and cardiovascular disease mortality.10 However, the extent of socioeconomic inequalities in adolescent health and how it has changed over time in Brazil is unclear.
In this study, we assessed levels and trends in socioeconomic inequalities in adolescent health in Brazil between 2009 and 2015, addressing absolute and relative measures of inequality. We used data from three large representative health surveys of adolescents living in Brazilian state capitals. We selected 12 indicators under three broad domains (lifestyle risk behaviours, engagement in risky activities and exposure to violence) to provide a holistic view of adolescent health inequalities in Brazil.
Methods
We used cross-sectional data from three Brazilian National Surveys of School Health (Pesquisa Nacional da Saude do Escolar [PeNSE]) carried out in 2009, 2012 and 2015. In order to have comparable data sets across the three surveys, we used a representative subsample of adolescents attending ninth grade (ie, mostly aged between 14 and 15 years) in public and private schools from the 26 state capitals and the Federal District. Detailed information about PeNSE has been published elsewhere.11–13 Briefly, PeNSE sampling strategy included stratification per cluster and multistage selection. The sampling strata were each of the 26 state capitals and Federal District. The primary sampling units were schools, and the secondary sampling units were classrooms. School selection was proportional to the total number of ninth grade classes, while the classes in each school were chosen by simple random selection. Two classrooms were selected from schools with three or more ninth grade classrooms, whereas one classroom was selected from schools with one or two ninth grade classrooms. All students enrolled in the selected classrooms were invited to participate in the study. Participants were not included in the study if they did not attend school during data collection, refuse to participate or did not report their age and sex. The total number of students included in our analysis was 60 973 (final response rate 83.8%) for 2009, 61 145 (final response rate 82.2%) for 2012 and 51 192 (final response rate 85.2%) for 2015 surveys.11–13
Students filled out a self-reported structured questionnaire available in a personal digital Assistant device (2009 survey) or smartphone application (2012 and 2015 survey) in their school classrooms during regular school hours. The questionnaire was based on the Global School-Based Student Health Survey14 and the Youth Risk Behaviour Surveillance System,15 and was adapted to the Brazilian setting. Questions included socioeconomic variables and several risk and protective factors for adolescent health.
We estimated a wealth index specific for each survey year through principal component analysis (PCA), following the steps proposed by Barros and Victora.16 We ran PCA including the following variables: mother’s educational level (incomplete middle school, complete middle school, complete high school, complete higher education); school administrative status (public or private); self-report of having: landline, mobile phone, computer, internet access, car, bathroom inside the house and housemaid services. We retained the first component of the analysis and calculated coefficients from the expression: coefficient=loading/SDx100. The individual scores were estimated from the ∑civi, where ci is the coefficient and vi is the value for the ith variable. The wealth index was assessed as quintiles of the total wealth scores. We refer to the first quintile (Q1) as the poorest quintile (poorest 20%) and the fifth quintile (Q5) as the wealthiest quintile (wealthiest 20%).
The indicators of adolescent health used in this study are defined in table 1. We divided indicators in three domains: lifestyle risk behaviours, engagement in risky activities and exposure to violence. Alcohol and tobacco use were included as risky activities and not lifestyle behaviours, because Brazilian law forbids the sale of these substances for younger than 18 years old. We have used the concept of ‘irregular consumption’ (<5 times in the past week) for all food indicators, following the complementary concept of ‘regular consumption’, which was validated using 24-hour recall.17 We also chose to include bean consumption because of their protective health effects and importance in Brazil as an affordable traditional staple food.18 The frequency of two or more times in the previous month for bullying victimisation followed the concept of this type of violence, which presume repetition.19 The unsafe sex was assessed only for those who reported had sexual relationships.
Indicators of adolescent health used in the present study
To assess socioeconomic inequalities in adolescent health, we used several measures of inequality. First, we estimated simple measures of inequality (pairwise comparisons), such as differences and ratios of each health indicator between the wealthiest group (fifth quintile) and the poorest group (first quintile).
Second, we estimated complex measures of inequality, represented by an indicator of absolute inequality, the slope index of inequality (SII), and an indicator of relative inequality, the concentration index (CIX).20 Both SII and CIX take into account all quintiles of the wealth index to compare a given health indicator across all wealth subgroups.
We estimated the SII using logistic regression to avoid predicting implausible values below 0 or above 1, considering that all health indicators were presented as proportions.21 The SII estimates the absolute difference (ie, in percentage points) in the prevalence of health indicator between individuals in the wealthiest and poorest quintiles. Negative values of SII indicate that prevalence of the health indicator is higher among the poorest adolescents than the wealthiest (values ranged from −100 to +100).
The CIX was also expressed on a scale ranging from −100 to +100; a value of 0 represents perfect equality, whereas negative values indicate that poor individuals have higher prevalence of a given health indicator than wealthy individuals.22 The CIX was calculated with no corrections.21
Linear regressions using variance-weighted least squares were performed to assess changes over time in complex measures of inequality (SII and CIX) based on the means and SD for each of the three surveys.
Multiple imputation was performed using the chained equation technique due to the significant proportion of missing values for the mother’s education level in the three data sets (19.36%, n=33 559). We also imputed other study variables with a smaller proportion of missing values, to create a complete data set. The imputed data exhibited satisfactory statistical reproducibility according to Monte Carlo error analysis.23
The sample design was taken into consideration for descriptive analyses, using survey prefix command (svy) in Stata. School clustering (random effect) and sample weights were considered when estimating complex measures of inequality (SII and CIX). All the statistical analyses were performed using Stata V.14.0.
Ethics approval
PeNSE surveys were approved by the National Commission of Research Ethics (Comissão Nacional de Ética em Pesquisa – Conep), records no. 11.537 (2009), 16.805 (2012) and 1.006.467 (2015). The surveys were performed in accordance with the Declaration of Helsinki and all participants gave their informed consent. Databases were made publicly available on an IBGE website without any information that could identify subjects.
Patient and public involvement
No patients or public were involved in the design and conceptualisation of this study.
Data sharing
The data set of 2009, 2012 and 2015 PeNSE are publicly available at: https://www.ibge.gov.br/estatisticas-novoportal/sociais/educacao/9134-pesquisa-nacional-de-saude-do-escolar.html?=&t=microdados
Results
In 2015, the health-related behaviours more common among Brazilian adolescents were irregular consumption of fruits (67.2%) and vegetables (61.8%) and irregular recreational physical activity (75.6%). Less frequent were the unsafe sex in last sexual intercourse (33.9%), alcohol use (23.2%) and exposure to bullying (21.7%). Between 2009 and 2015, the prevalence of irregular vegetable consumption, irregular recreational physical activity, regular soft drink consumption and alcohol, tobacco and drug use decreased. On the other hand, trends for irregular bean consumption, unsafe sexual intercourse and exposure to violence (domestic violence, fight using guns and bullying victimisation) increased (table 2).
Brazilian adolescent characteristics and health-related behaviours from Pesquisa Nacional da Saude do Escolar surveys 2009, 2012 and 2015
Figure 1A–C shows the trends in health indicators by wealth quintile between 2009 and 2015. The width of the bars represents the absolute inequality. For most health indicators (except bean, soft drink and alcohol use), people in the poorest group reported more adverse levels compared with the wealthiest group. In general, over the period 2009–2015, health inequalities decreased for lifestyle behaviours (fruit, vegetable, bean and soft drink consumption and recreational physical activity), while increased for risky activities and violence (smoking, drug use, unsafe sex, domestic violence, fights using guns and bullying victimisation) (see online supplementary appendix 1).
Supplementary file 1
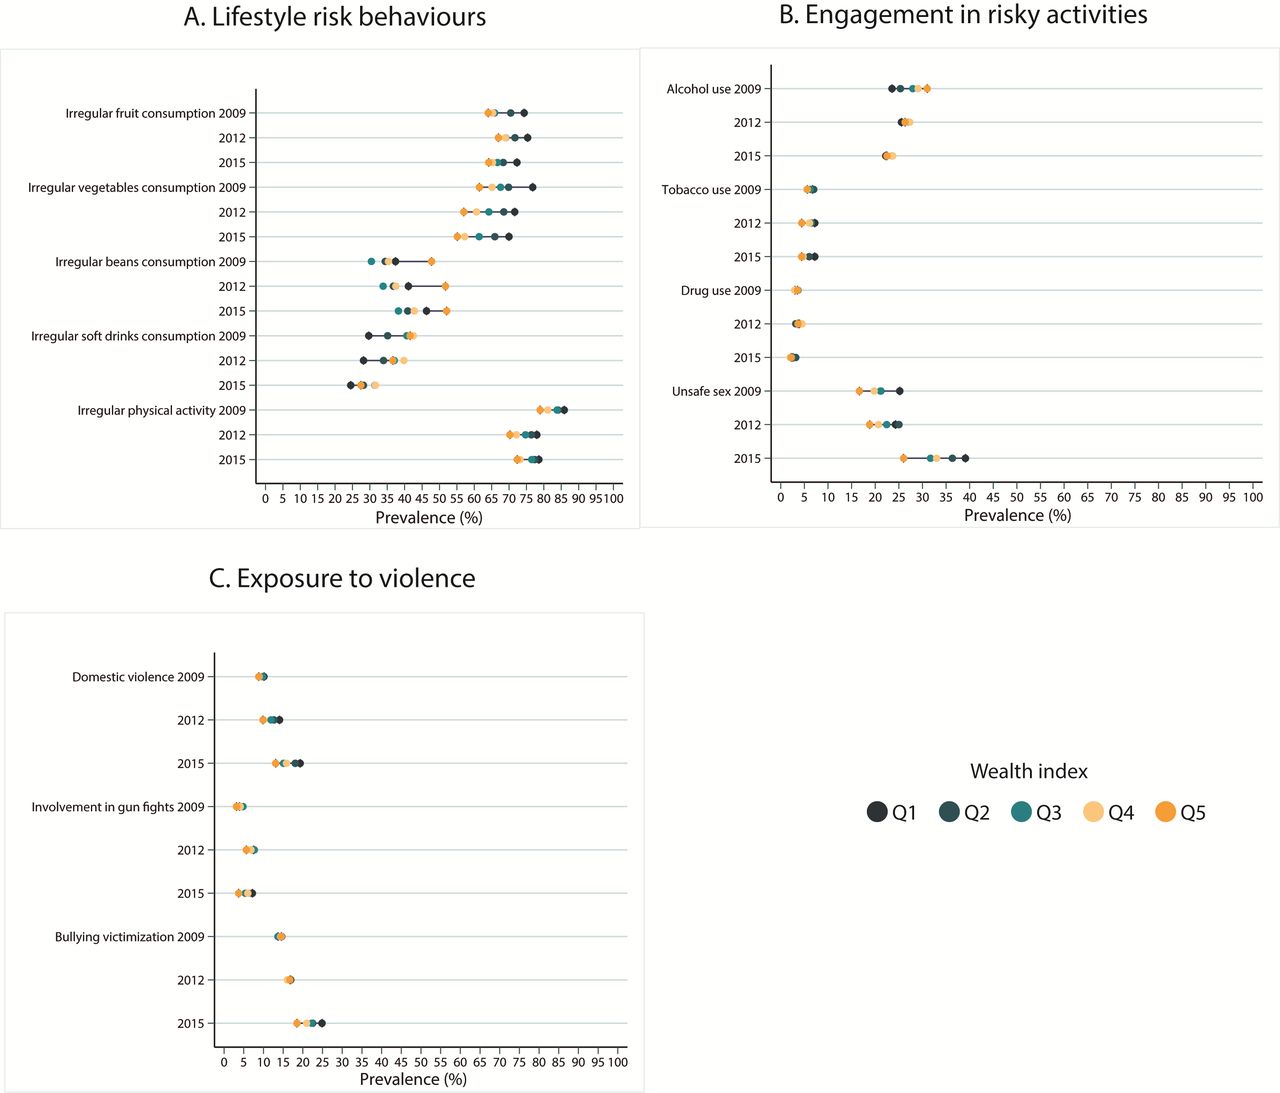
Time trends in health-related behaviours by wealthy quintile among adolescents.
Some of these trends were not statistically significant according to complex measures of inequality (table 3).
Complex measures of inequality in health-related behaviours among Brazilian adolescents (Pesquisa Nacional da Saude do Escolar surveys 2009, 2012 and 2015)
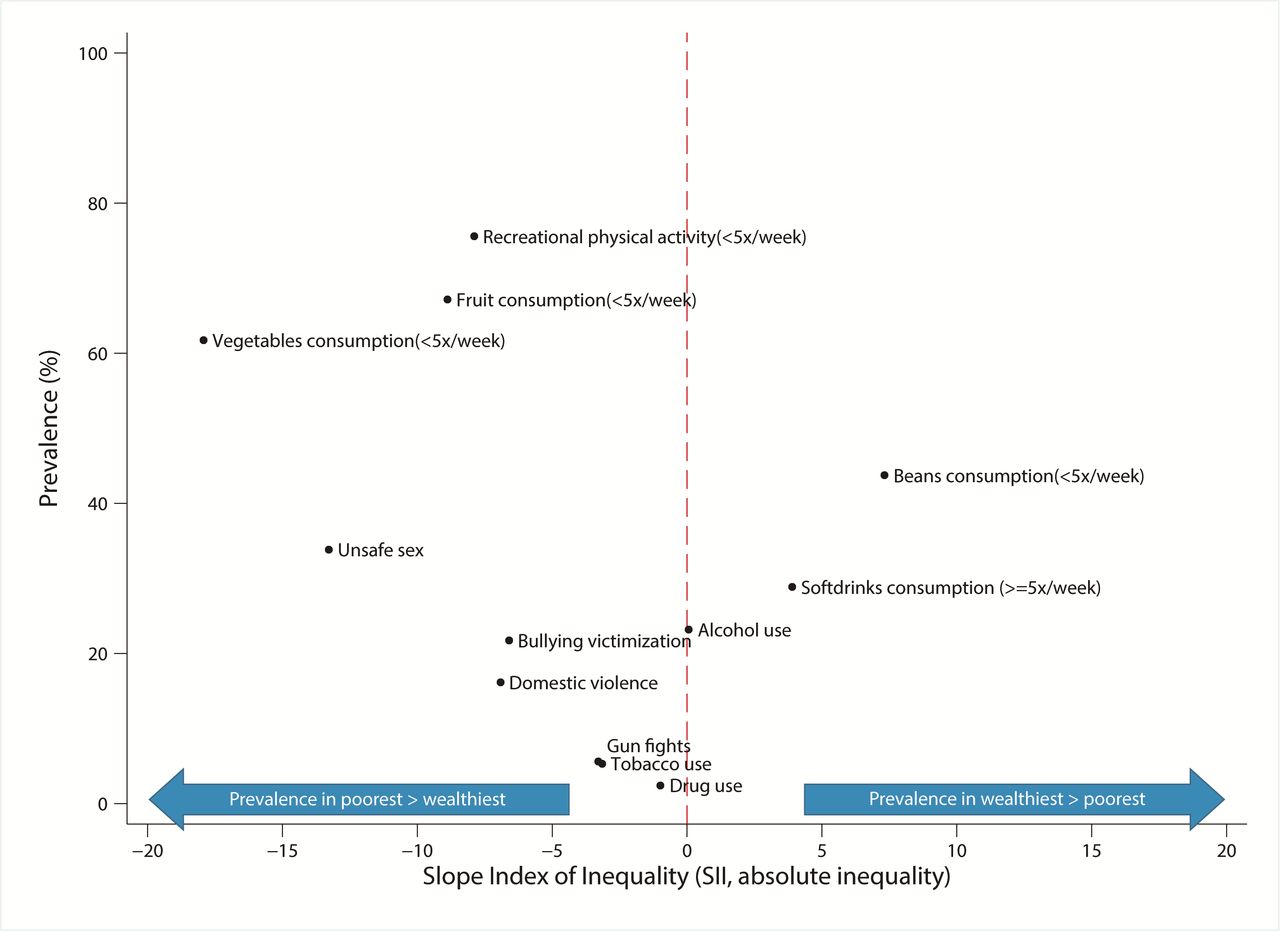
In all years, alcohol consumption was the health indicator more equally distributed between wealth quintiles both according to absolute and relative measures. On the other hand, irregular vegetable consumption and unsafe sex had the highest absolute inequality and fights using guns and tobacco use the highest relative inequality. Over time, the absolute (SII) and relative inequalities (CIX) between wealth index quintiles became wider for all three indicators of exposure to violence, and narrower for some indicators of lifestyle behaviour (fruit, beans and soft drinks) and alcohol consumption. There was limited evidence of change in inequalities over time for the other lifestyle behaviours, such as irregular vegetable consumption and recreational physical activity, and indicators of engagement in risky activities, such as tobacco, drug use and unsafe sex (table 3, figure 2).
Prevalence of health-related behaviours among adolescents in 2015 and slope index of inequality (SII, absolute inequality).
Discussion
We showed evidence of persistent socioeconomic inequalities in adolescent health in Brazil. Between 2009 and 2015, lifestyle behaviours (fruit and soft drink consumption) and alcohol use became more equally distributed between socioeconomic groups, while inequalities in experiencing violence were exacerbated. In this period, there was little evidence of change to inequalities in risky activities (smoking, drugs, unsafe sex).
In general, the direction of health inequalities we observed is similar to that reported in other settings, that is, poorer adolescents are more likely to report harmful health behaviours than richer.5 For certain harmful behaviours (eg, alcohol and drug use), however, differences between social groups were not significant or went in the opposite direction (ie, wealthier adolescents reported higher prevalences). These findings are consistent with results observed in other countries.24
Looking at time trends in these inequalities, our findings differ to existing evidence from Western Europe and North America. For some lifestyle (eg, vegetable consumption, physical activity) and risky behaviours (drug and tobacco use), inequalities have not changed significantly between 2009 and 2015 in Brazil. Yet inequality in lifestyle and risky behaviours have increased over similar period in many other countries.5 25 Similarly to ours, one study found persistent inequality in vegetable consumption.26 Despite this, comparable data for many indicators of risk behaviours are lacking. Rates of violence as well as inequalities in violence increased markedly (gun fights, domestic violence, bullying), and these trends also differ from other countries.27
Reasons for differential socioeconomic inequality trends between lifestyle behaviours, risk behaviours and violence-related indicators in Brazilian adolescents are unclear. Reductions in lifestyle behaviour inequalities fit with the general trend of narrowing economic and health inequalities observed for adults in Brazil in that period.28 29 This is often attributed to rising prosperity combined with roll out of redistributive health and social programmes such as the Bolsa Familia cash transfer programme,30 as well as scaled-up health promotion efforts (especially obesity prevention).31 Exacerbation of violence-related inequalities has also been observed in one study of adult mortality in Salvador.32 It has been suggested that public health interventions have focused on reducing infectious and chronic diseases but neglect, on the other hand, external causes of ill health such as interpersonal violence. In fact, violence-related mortality has declined slower than all other causes in Brazil, and even increased in 19 of the 27 states.33
It is worth noting that we found a shift in prevalence of alcohol use and soft drink consumption between socioeconomics in the period studied. In 2009, these indicators were higher among the wealthiest group, but in 2015, the differences were considerably attenuated. The reduction in the consumption of these products was more pronounced among the wealthiest group than in the poorest group. Conversely, for bean consumption, poorer adolescents reported higher prevalence than wealthiest adolescences. In this regard, the reduction in disparities between wealth groups should be read with caution. In high-income countries, poorer individuals consume more alcohol, relative to wealthier individuals, while in low/middle-income countries wealthier individuals are more exposed than the poorer.34 This trend could be shifting. In fact, industries of unhealthy commodities have moved to, and are growing faster in, low/middle-income countries compared with high-income countries.35 This phenomenon might explain, at least in part, the increase in consumption of ultraprocessed products (eg, sugary drinks) and alcohol, and the reduction of bean consumption in these settings.36 Brazil seems to be moving towards patterns of health indicators and their inequalities currently observed in high-income countries. In these countries, the reduction in alcohol use and soft drink consumption among those privileged is not necessarily followed by a reduction among those more socially deprived.5 Although this trend is measured as a reduction in inequality, it is not desirable.
The main strength of this study is to explore a wide spectrum of health indicators, which provides information on prevalence and trends in key risk factors for adolescent health. Another positive aspect is the large representative urban samples from Brazilian adolescents attending public and private schools. In Brazil, the school coverage in this age is very high (88%–97%),37 which reduces significantly the risk of selection bias. Despite this, it is plausible to assume that students at higher risk of harmful health behaviours have higher truancy and dropout rates. Therefore, this could have masked the true extent of the inequalities. We also report a range of simple and complex measures of inequalities to allow clear interpretation of trends as well as presenting rigorous hypothesis tests which make use of all data. Concordance between the absolute and relative measures of inequality adds strength to our conclusions.
Some limitations should be acknowledged. The engagement in health-related behaviours was self-reported by adolescents, and therefore, misclassification may have occurred towards social desirable behaviours. Misclassification likely affected the prevalence of health indicators similarly over three surveys. Although use of self-reported outcomes is a limitation, it is widely recognised as an acceptable and often the only feasible approach for monitoring adolescent health behaviours.38 Moreover, there is evidence of validity of the dietary indicators used in the PeNSE survey,17 and a US survey on which the PeNSE survey was based demonstrated good test-retest reliability and consistency across different modes of questioning.39
The surveys were available only for a period of 6 years, which may be too short to expect significant changes in inequalities. To continue monitoring trends in adolescent health inequality for longer periods is desirable. Also, the data analysed are representative of Brazilian state capitals, not the whole country. State capitals are highly urbanised cities and more developed than other cities; therefore, these results may not be generalisable to small cities and rural areas. However, state capitals are the most populous and unequal areas of Brazil,40 making them important settings for studying inequality trends, and meaning they can act as sentinels to the country as a whole.
Brazil is facing a huge economic recession since 2015, which deepened in 2016. Unemployment and inflation have increased and people’s purchasing power has been reduced, with the poor especially affected. Therefore, it will be vital to continue monitoring the trends observed in this study and take action to prevent exacerbation of existing inequalities.
Policy makers and researchers should be alert to the fact that possible reductions in health risky behaviours may be unbalanced between social groups and even be increasing in disadvantaged social groups while decreasing on average.22 In this study, we found that the gap between poor adolescents and wealthy adolescents is reducing for lifestyle behaviours such as fruit consumption, while it is increasing for violent behaviours. For alcohol, irregular bean consumption and regular soft drink consumption, we found that the gap between social groups is narrowing, although represented by a reduction in these risk behaviours among the rich and an increase among poor adolescents.
References
Footnotes
Contributors CMA, LFMdR, RBL and AJDB conceptualised the study and were involved in the analysis and interpretation of the results. CZR was involved in data preparation, and designed and prepared the tables. SK and PACM were involved in the interpretation and discussion of results. The initial draft of the paper was prepared by CMA following extensive discussions and inputs from the other coauthors. All authors have reviewed, revised the manuscript and approved the final version.
Funding The present research received financial support from Brazilian National Council of Scientific and Technological Development (CNPq), 404905/2016-1, awarded to Catarina Machado Azeredo. Sao Paulo Research Foundation (FAPESP), grant #2016/21390-0 and #2014/25614-4 due to Leandro Fórnias Machado de Rezende.
Disclaimer The funders had no role in study design, data collection and analysis, decision to publish, or preparation of the manuscript.
Competing interests None declared.
Provenance and peer review Not commissioned; externally peer reviewed.
Data sharing statement The dataset of 2009, 2012 and 2015 PeNSE are publicly available at: https://www.ibge.gov.br/estatisticas-novoportal/sociais/educacao/9134-pesquisa-nacional-de-saude-do-escolar.html?=&t=microdados.
Patient consent for publication Not required.