Article Text

Abstract
Objectives The indicator unexpectedly long length of stay (UL-LOS) is used to gain insight into quality and safety of care in hospitals. The calculation of UL-LOS takes patients’ age, main diagnosis and main procedure into account. University hospitals have relatively more patients with a UL-LOS than other hospitals. Our main research question is whether the high number of patients with a UL-LOS in university hospitals is caused by differences in additional patient characteristics between university hospitals and other hospitals.
Design We performed a cross-sectional study and used administrative data from 1 510 627 clinical admissions in 87 Dutch hospitals. Patients who died in hospital, stayed in hospital for 100 days or longer or whose country of residence was not the Netherlands were excluded from the UL-LOS indicator. We identified which patient groups were treated only in university hospitals or only in other hospitals and which were treated in both hospital types. For these last patient groups, we added supplementary patient characteristics to the current model to determine the effect on the UL-LOS model.
Results Patient groups treated in both hospital types differed in terms of detailed primary diagnosis, socioeconomic status, source of admission, type of admission and amount of Charlson comorbidities. Nevertheless, when adding these characteristics to the current model, university hospitals still have a significantly higher mean UL-LOS score compared with other hospitals (p<0.001).
Conclusions The difference in UL-LOS scores between both hospital types remains after adding patient characteristics in which both hospital types differ. We conclude that the high UL-LOS scores in university hospitals are not caused by the investigated additional patient characteristics that differ between university and other hospitals. Patients might stay relatively longer in university hospitals due to differences in work processes because of their education and research tasks or financing differences of both hospital types.
- quality in health care
- health policy
This is an open access article distributed in accordance with the Creative Commons Attribution Non Commercial (CC BY-NC 4.0) license, which permits others to distribute, remix, adapt, build upon this work non-commercially, and license their derivative works on different terms, provided the original work is properly cited, appropriate credit is given, any changes made indicated, and the use is non-commercial. See: http://creativecommons.org/licenses/by-nc/4.0/.
Statistics from Altmetric.com
Strengths and limitations of this study
Use of a large, nationwide collected hospital discharge database with a large number of patients included in this study.
Unique comparison study concerning differences in length of stay between university and other hospitals.
Mean length of stay for some patient categories is based on a small number of patients.
Introduction
The focus on measuring and improving quality and safety of care has increased in the past few decades.1–7 Quality and safety of care can be improved by reducing the number of adverse events. These can be detected by reviewing patient records. However, this is a time-consuming process. Therefore, it is important to optimise existent screening tools.
Length of stay (LOS) is such a screening tool, as research has shown that hospital adverse events often result in a longer LOS.2 8–14 In the Netherlands, an unexpectedly long LOS (UL-LOS) indicator has been introduced to identify potential shortcomings in the quality and safety of care.2 15 All hospitals receive their outcomes in detail and the Dutch Health and Youth Care Inspectorate uses this indicator in their indicator framework. However, ranking hospitals based on UL-LOS in the Netherlands shows that the university hospitals have higher scores on this indicator than other hospitals (figure 1). The average UL-LOS score for university hospitals is 16.0, 99.7% CI 15.8 to 16.3, compared with 11.2, 99.7% CI 11.1 to 11.2, for other hospitals. Since the UL-LOS is an indicator used by hospitals in their patient safety policy, it is important to understand why the percentage of UL-LOS patients in university hospitals is higher and to find out whether the indicator can be improved.

Percentage of patients with an unexpectedly long length of stay (UL-LOS) of Dutch hospitals.
In this study, we investigated a potential explanation for the higher UL-LOS scores in university hospitals compared with other hospitals. The current calculation of UL-LOS takes age, main diagnosis and main procedure into account to determine the expected LOS. However, the assumption is that university hospitals treat patients with more comorbidities and complications than general hospitals. Therefore, there might be insufficient case-mix correction for specific patient characteristics.16 17 The main research question of our study is whether the high UL-LOS scores of the university hospitals are caused by differences in additional patient characteristics between university and other hospitals. Our hypothesis is that correcting for these additional patient characteristics in the calculation of UL-LOS reduces the difference in UL-LOS scores between university hospitals and other hospitals. We expect to give more insight in the characteristics of patients visiting university hospitals and other hospitals, and to provide guidance on how the UL-LOS can be improved as a valid indicator of patient safety and quality of care.
Methods
Calculation of UL-LOS
Previous research defined UL-LOS as the percentage of clinically admitted patients with an actual hospital stay that was more than 50% longer than expected.2 The expected LOS was estimated by indirect standardisation based on age, main diagnosis and main procedure.2 First, all International Disease Classification, 10th version (ICD-10) diagnostic codes were categorised into 54 diagnostic groups, and procedure codes were categorised into 40 procedure groups. These diagnostic and procedure groups are specifically developed for the calculation of the expected LOS. Next, the diagnostic groups and procedure groups were merged into 172 morbidity classes. The morbidity classes are unique combinations of diagnoses and procedures and mainly intend to divide patients with or without procedures in different groups. Then, on the basis of six age categories (0, 1–14, 15–44, 45–64, 65–79, ≥80 years), the morbidity classes and the first three digits of the ICD-10 diagnostic codes, the mean LOS was calculated for each combination of these variables (figure 2).1 This resulted in 39 063 cells with specific patient characteristics, hereinafter referred to as patient categories.
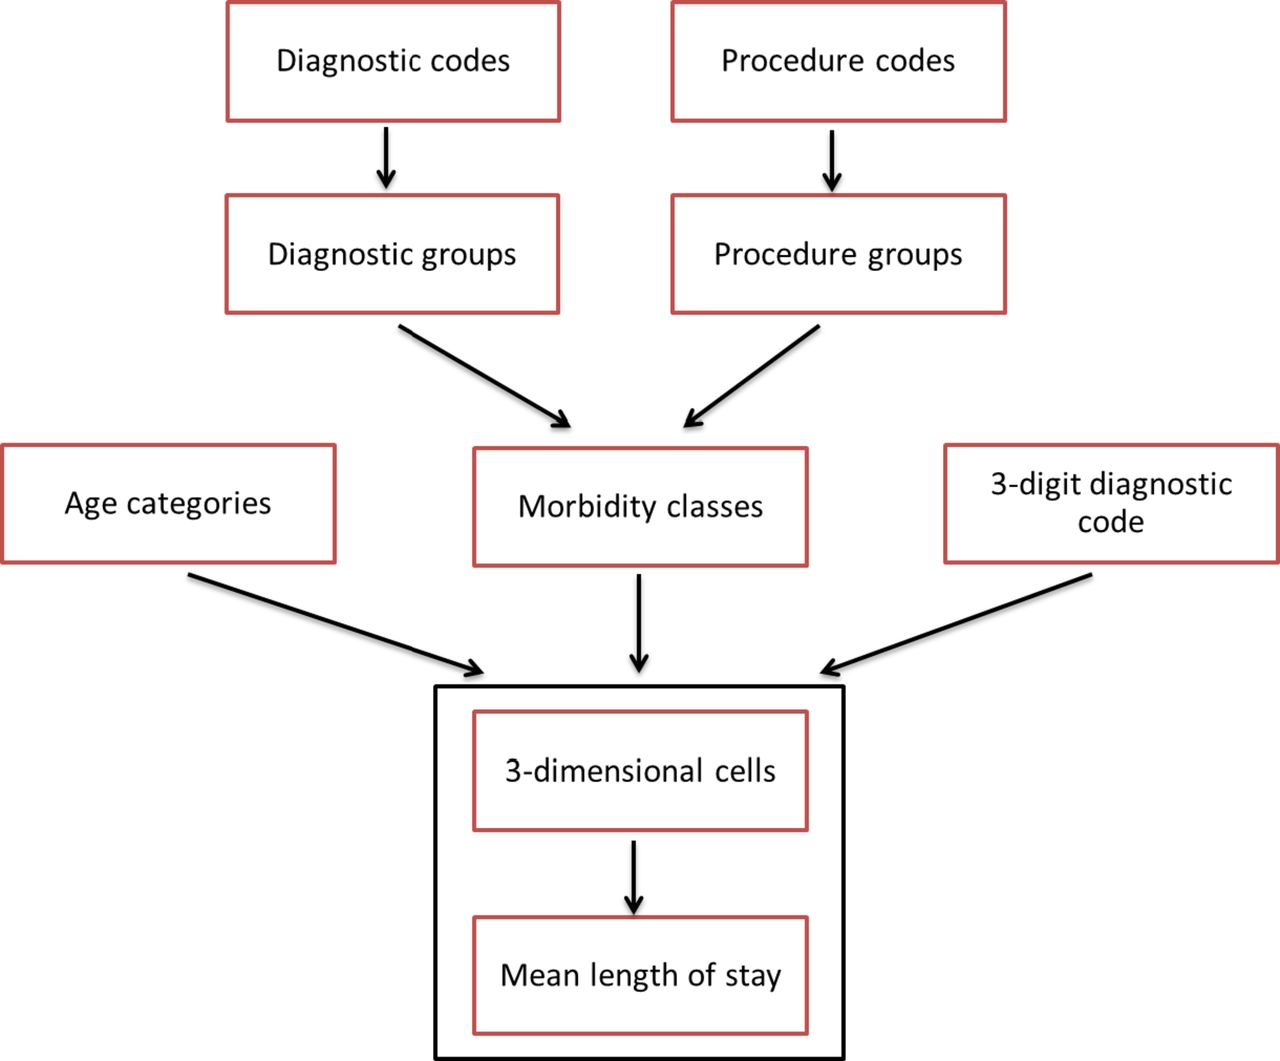
Determination of the expected length of stay.
For each patient, the expected LOS was calculated as the mean LOS of the patient category with the same patient characteristics in the previous year. If there was no mean LOS available for a patient, because this type of patient did not occur in the previous year, the actual LOS was used as expected LOS.
Furthermore, patients who died in the hospital, stayed in hospital for 100 days or longer or whose country of residence was not the Netherlands were excluded from the UL-LOS indicator. Patients with a LOS of 100 days or longer are excluded from the calculation of the expected LOS as these patients are outliers and therefore have a large influence on this calculation. Patients with country of residence outside the Netherlands were excluded from the indicator as these patients often differ in their reason for hospitalisation and are therefore not comparable to Dutch patients. For example, these patients are often admitted as acute admissions.
Data
We used patient data from the National Basic Hospital Care Registration (LBZ, Landelijke Basisregistratie Ziekenhuiszorg) to perform a cross-sectional study. For our study, we extracted all clinical hospital admissions from the year 2013 from all Dutch hospitals that participated in the LBZ. These data are routinely registered by hospitals and provide data from 87 hospitals in the Netherlands. It contains all hospital admissions from these hospitals, including medical data about their diagnosis, treatment and hospital stay and patient characteristics such as age and gender. The data used in this study are fully anonymised and publicly available for researchers via Remote Access to Statistics Netherlands (Centraal Bureau voor de Statistiek (CBS)). We had permission of all hospitals to use the data anonymously.
The analyses were performed using the statistical package R (V.3.1.1).
Patient and public involvement
Patients were not involved in the design or the planning of this study. We only used data about hospital admissions provided by the hospitals.
Analysis
Characteristics of the hospital admissions in the LBZ
We first examined the characteristics of the LBZ data. We determined the number of patients that died in the hospital and the number of patients with an LOS of 100 days or longer and excluded them from the analyses (figure 3). We also examined whether there is a difference in the occurrence of these patients between university hospitals and other hospitals.

Flowchart: patients who died in hospital or had a length of stay (LOS) of 100 days or longer across different hospital types.
Unique patients for different types of hospitals
Next, we determined which types of patients, based on age, main diagnosis and main procedure are treated only in university hospitals or only in other hospitals. The UL-LOS is already calculated separately for university hospitals and other hospitals for these unique patient groups. This is because these patients have an expected LOS only based on either patients from university hospitals or other hospitals. Therefore, it is unlikely that the indicator would improve for these unique groups of patients by taking more patient characteristics into account. These patient groups, including 25 210 patients, were thus excluded from the analysis to determine which additional patient characteristics should be taken into account in the model.
Matching patients for different types of hospitals
The higher percentage of UL-LOS patients in university hospitals might be caused by correcting insufficiently for differences in patient characteristics of patient groups that are treated in both types of hospitals. To investigate this, we focused on patient categories that showed a large difference in LOS between university hospitals and other hospitals. We explored whether other patient characteristics differ between university hospitals and other hospitals in these patient categories, which might cause the longer LOS. We selected a small subgroup of patient categories to get insight into the differences in patient characteristics between both hospital types for each different patient category. We took the following patient characteristics into account: gender, socioeconomic status (SES), the detailed primary diagnosis, type of admission (elective or acute admission), source of admission (own home, other hospital, born in this hospital), destination after discharge and Charlson comorbidities.18 Within the Charlson comorbidities, we included all secondary diagnoses that developed before admission and affect treatment or the outcome of treatment. In this way, we could identify other patient characteristics that should be taken into account to calculate the expected LOS, and make a more fair comparison between university hospitals and other hospitals.
New UL-LOS calculations with additional patient characteristics
Patient characteristics that appeared to differ between university hospitals and other hospitals were added to the current model to find out whether correcting for these characteristics would explain the differences in UL-LOS percentages between university hospitals and other hospitals. We used a negative binomial regression model (We also used linear regression models to predict LOS. These models gave similar results as the negative binomial models). Because we expected a linear, rather than log-linear, relationship between LOS and expected LOS, we log-transformed the latter before entering it into the analysis as an independent variable.
We used three approaches to evaluate these new models. First, we calculated the Akaike information criterion (AIC) of each model, which is an estimate for the relative quality of statistical models for a given data set.19 The model with the lowest AIC is the model with the best fit. As the AIC does not determine absolute quality of a model, we also calculated the difference between actual LOS and the expected LOS for each model. This could tell us whether the difference between LOS and expected LOS decreases when adding additional patient characteristics, suggesting a better prediction of LOS. Subsequently, we investigated differences in mean UL-LOS scores between university hospitals and other hospitals for each new model by Welch’s t-test (α=0.003) to determine whether additional case-mix correction reduces the difference in UL-LOS scores between university hospitals and other hospitals. In this way, we could determine what patient characteristics should be taken into account to improve the model.
Results
Characteristics of the hospital admissions in the LBZ
The number of patients included in the LBZ 2013, and the exclusion steps are shown in figure 3.
Unique patients in different types of hospitals
Preliminary analyses revealed 13 496 patient categories with unique combinations of main diagnosis, age and main procedure. Table 1 shows the number of patient categories with a specific age, diagnosis and main procedure for university hospitals and other hospitals. It shows also the number of patient categories that were uniquely treated in university hospitals or uniquely treated in other hospitals. Furthermore, it displays the number of patient categories that occur in both types of hospitals. We also identified the number of patient categories with a unique diagnosis. These diagnoses only have been treated in university hospitals or only in other hospitals.
Unique cells for university hospitals and other hospitals
Matching patients for different types of hospitals
We identified 10 patient categories that had the largest difference in mean LOS between university hospitals and other hospitals, which contained at least 100 patients for each type of hospital. In nine categories, the patients stayed longer in university hospitals than in other hospitals. This difference varied from 8.6 to 2.8 days. In the category of patients with non-rheumatic aortic valve diseases aged 65–75, the patients stayed longer in other hospitals than university hospitals: 2.1 days longer. The notable differences in patient characteristics are included in the online supplementary appendix. These results show that patients from university hospitals differ from patients from other hospitals in terms of detailed primary diagnosis, SES, source of admission, type of admission and the amount of Charlson comorbidities.
Supplemental material
New UL-LOS calculations with additional patient characteristics
In each of the models, we added one additional patient characteristic. In the last model, we added all additional patient characteristics in one model. The current model is the calculation of UL-LOS that is currently being used to calculate the indicator by taking into account the age, main diagnosis and main procedure of the patient. The AIC and difference between LOS and expected LOS for each model are shown in table 2. The new UL-LOS percentages for each type of hospital are also shown in table 2. The largest decrease in UL-LOS difference between university hospitals and other hospitals occurred when adding source of admission to the model: this decreased the difference by 0.6%. In each model, university hospitals still have a significantly higher mean UL-LOS score compared with other hospitals, examined by Welch’s t-test (p<0.001).
AIC (Akaike information criterion), difference in lenth of stay (LOS) and expected LOS and UL-LOS (unexpectedly long LOS) percentages for both types of hospitals for each model
Discussion
This study shows that the majority of patient groups, which are combinations of a specific age, diagnosis and main procedure, are treated in university hospitals as well as in other hospitals. These patient groups also include the majority of the patients. The number of patient groups that are uniquely treated in either university hospitals or other hospitals is very small.
We explored whether the patient groups that were treated in university hospitals as well as in other hospitals differ in terms of other patient characteristics than those that are taken into account in the current indicator. When looking at patient categories that show a large difference in average LOS between university hospitals and other hospitals, we found that these patients often differ between university hospitals and other hospitals based on SES, detailed primary diagnosis, source of admission, type of admission and Charlson comorbidities. These differences in patient characteristics could cause a higher UL-LOS for university hospitals compared with other hospitals. This justifies correction for these patient characteristics. However, adding these patient characteristics to the current model did not improve the AIC or difference in LOS and expected LOS substantially. It also did not substantially decrease the difference in UL-LOS scores between university hospitals and other hospitals. The different patient characteristics between university hospitals and other hospitals thus did not seem to explain the difference in UL-LOS scores between both types of hospitals.
University hospitals might have higher UL-LOS scores because patients stay longer in hospital for research and education purposes. Literature is inconsistent about the relationship between university versus other hospitals and LOS.20–24 Hyder et al found that patients undergoing complex hepatopancreaticobiliary surgery at a non-teaching hospital had a 20% increased risk of having an LOS longer than 14 days compared with teaching hospitals.20 Another study found that patients who had a pancreatic or hepatic resection at a non-teaching hospital were 30% more likely to have a prolonged LOS. However, after adjustment for patient characteristics, there was no difference between teaching and non-teaching hospitals.21 This is not in line with the findings in our study. This difference might be explained by focussing on only a small patient group in the mentioned studies.
A study by Cots et al found that LOS outliers are related to hospital structural level. A model to predict the probability of a patient being an outlier by hospital structural level showed an OR of 1.32 and 1.22 for ‘large urban teaching hospitals’ and ‘medium-sized teaching and community hospitals’, respectively, compared with ‘small community hospitals’.23 Similar results were found in a study by Freitas et al which showed that large teaching hospitals had significantly more LOS outliers than non-teaching hospitals after adjustment for case mix, with an OR of 1.17.24 These studies support our suggestion that teaching status increases LOS in university hospitals. Both Spain and Portugal have a national health system, which is different from the Dutch regulated market system. However, the role of large urban teaching hospitals in Spain and Portugal is very similar to Dutch university hospitals. They all treat more complex patients, use sophisticated technology and undertake education activities. According to Cots et al, the role of large urban teaching hospitals in the hospital network is that they centralise specialties and facilities with advanced technology and are used to cover the needs of the entire healthcare system. That is comparable to the role of university hospitals in the Dutch healthcare system and, therefore, the findings of these studies would be generalisable to Dutch university hospitals.
Strengths and limitations
A strength of this study is the use of a large, nationwide collected, hospital discharge database. This database contains data from all Dutch hospitals with all their admissions, of which 1 464 122 admissions were used in this study after exclusions.
A limitation of this study is that a small percentage of the patients do have an expected LOS that might not be reliable. Some patient categories have a mean LOS based on only a few admissions, which makes the expected LOS less reliable. Therefore, it is important to conduct more research to determine when an expected LOS is reliable enough, for example, by investigating the distribution of the LOS within each patient category.
Implications for practice
University hospitals are often presented as specialised hospitals that treat difficult patients, causing a longer LOS. However, for the small group of patients that are uniquely treated in university hospitals, the UL-LOS is already calculated separately for university hospitals. Our study did not show that adding patient characteristics to the model decreases the UL-LOS percentages for university hospitals for the patient groups treated in both types of hospitals. This suggests that other factors are likely responsible for causing higher UL-LOS scores in university hospitals. This indicates that the UL-LOS indicator could still be applied to both types of hospitals.
The generalisability of these findings to non-Dutch healthcare systems depends on the role of university hospitals in other countries. As described in the studies of Cots et al and Freitas et al, large Spanish and Portuguese urban teaching hospitals have a similar role in the healthcare system as university hospitals in the Netherlands. It is important for other countries to investigate whether their university hospitals treat different types of patients than other hospitals.
Further research
We identified several opportunities for further research in this study.
First of all, more research should be conducted to find out why university hospitals—even after adjusting for additional variables—have a higher score on the UL-LOS compared with other hospitals. The influence of research and education on LOS should be investigated more closely.
Second, an interesting subject for additional research are differences in financing of care between university hospitals and other hospitals in relation to LOS. University hospitals get additional financing to cover the costs for complex patients, education and research.25 26 Other hospitals have a production-based financing model. These differences could induce a different work process in university hospitals, possibly influencing LOS.
Another important subject for further research is to explore other patient characteristics, not taken into account in this study, which could influence the LOS of university hospitals and other hospitals. The additional patient characteristics added to the current model did not decrease the AIC or difference between LOS and expected LOS substantially. This suggests that other factors play an important role in predicting LOS, for example, severity of acute disease, not reflected by primary diagnosis or type of intervention, secondary diagnoses or interventions, patients’ preferences or expectations. Some of these patient characteristics, such as patients’ preferences or expectations, are hard to take into account as they are not registered in the LBZ.
For some patient categories, the mean LOS in university hospitals was four times longer than in other hospitals. It would be interesting for future research to focus on these patient categories and perform a case-by-case analysis. This could give additional insights in the (differences of the) care process and types of patients treated in university hospitals and other hospitals. Patients in these specific categories could be analysed by patient record reviewing. The results could provide us with additional factors influencing LOS that might be taken into account when calculating UL-LOS.
Several studies showed that comorbidities are associated with a longer LOS, and should therefore be taken into account in the calculations of UL-LOS.14 23 24 27 28 In the current study, we used the Charlson Comorbidity Index that has been developed to calculate the risk of mortality. Therefore, this index might not be entirely applicable for the risk of UL-LOS. Further research should focus on all comorbidities to find out which comorbidities influence the LOS. Other patient characteristics related to the LOS that are mentioned in the literature are severity of illness, gender and type of admission (elective or acute admission).14 27 29–31 We found no difference in gender between university hospitals and other hospitals, so gender should not explain the higher UL-LOS scores for university hospitals. We also found that addition of type of admission to the model increased the UL-LOS scores for university hospitals.
However, when more patient characteristics have to be taken into account, the current method of indirect standardisation will not be sufficient. Several studies used a regression model to investigate which factors are related to LOS.14 27 29–34 For example, Jimenez et al investigated the difference between observed and predicted LOS as an indicator of inefficient care. They used a linear multiple regression model to predict the LOS, which included a severity index, age, place of residence and diagnosis to predict the LOS at the internal medicine department. They also modelled the predicted LOS at the general surgery department, including a severity index, intervention, ward, place of residence, complications index and type of surgery in the model. These models explained 41% and 70% of the total variation for internal medicine and general surgery, respectively.30 More research should also be conducted to find an appropriate method for the calculation of the expected LOS that takes the distribution of LOS into account. This would improve the indicator as this takes into account more information compared with determining the expected LOS only based on the mean LOS.35
Conclusions
The majority of patient groups are treated in university hospitals as well as in other hospitals. They have different patient characteristics—after being grouped based on age, primary diagnosis and main procedure—that are not taken into account in the current model. However, the difference in UL-LOS between university hospitals and other hospitals did not decrease after adding these patient characteristics to the model. Therefore, the conclusion of this study is that the high UL-LOS scores for university hospitals are not caused by different types of patients treated in university hospitals compared with other hospitals, according to the patient characteristics taken into account in this study. There might be other patient characteristics, not taken into account in this study, that cause the differences in UL-LOS. Furthermore, patients might stay relatively longer in university hospitals due to either safety issues or differences in work processes because of their education and research tasks or because of another way of financing of hospital care.
References
Footnotes
Patient consent for publication Not required.
Contributors JG: performed the analysis of the study, interpreted the data and wrote the draft and final version of the article. She gave final approval of the version to be published. SC: supervised and guided the study and analysis, contributed to the conception of the study and interpretation of the data. He wrote and critically revised the article and approved the final version of the article to be published. KH: guided the study and analysis, contributed to the conception of the study and interpretation of the data. She wrote and critically revised the article and approved the final version of the article to be published. IB: contributed to the conception of the study, interpretation of data and which analysis should be performed. She wrote and critically revised the article and approved the final version of the article to be published. RBK: contributed to the conception of the study, interpretation of data and which analysis should be performed. He wrote and critically revised the article and approved the final version of the article to be published.
Funding The authors have not declared a specific grant for this research from any funding agency in the public, commercial or not-for-profit sectors.
Competing interests None declared.
Provenance and peer review Not commissioned; externally peer reviewed.
Data sharing statement The data used in this study is fully anonymised and publicly available for researchers via Remote Access to Statistics Netherlands (CBS) (costs may apply). Gaining access to the data through CBS has been proved successful in the past for other researchers. We had permission of all hospitals to use the data anonymously.