Article Text

Abstract
Objective After a decade of increase, the preterm birth (PTB) rate has declined in the USA since 2006, with the largest decline at late preterm (34–36 weeks). We described concomitant changes in gestational age-specific rates of neonatal mortality and morbidity following spontaneous and clinician-initiated PTB among singleton infants.
Design, setting and participants This retrospective population-based study included 754 763 singleton births in Washington State, USA, 2004–2013, using data from birth certificates and hospitalisation records. PTB subtypes included preterm premature rupture of membranes (PPROM), spontaneous onset of labour and clinician-initiated delivery.
Outcome measures The primary outcomes were neonatal mortality and a composite outcome including death or severe neonatal morbidity. Temporal trends in the outcomes and individual morbidities were assessed by PTB subtype. Logistic regression yielded adjusted odds ratios (AOR) per 1 year change in outcome and 95% CI.
Results The rate of PTB following PPROM and spontaneous labour declined, while clinician-initiated PTB increased (all p<0.01). Overall neonatal mortality remained unchanged (1.3%; AOR 0.99, CI 0.95 to 1.02), though gestational age-specific mortality following clinician-initiated PTB declined at 32–33 weeks (AOR 0.85, CI 0.74 to 0.97) and increased at 34–36 weeks (AOR 1.10, CI 1.01 to 1.20). The overall rate of the composite outcome increased (from 7.9% to 11.9%; AOR 1.06, CI 1.05 to 1.08). Among late preterm infants, combined mortality or severe morbidity increased following PPROM (AOR 1.13, CI 1.08 to 1.18), spontaneous labour (AOR 1.09, CI 1.06 to 1.13) and clinician-initiated delivery (AOR 1.10, CI 1.07 to 1.13). Neonatal sepsis rates increased among all preterm infants (AOR 1.09, CI 1.08 to 1.11).
Conclusions Timing of obstetric interventions is associated with infant health outcomes at preterm. The temporal decline in late PTB among singleton infants was associated with increased mortality among late preterm infants born following clinician-initiated delivery and increased combined mortality or severe morbidity among all late preterm infants, mainly due to increased rate of sepsis.
- preterm birth
- neonatal mortality
- neonatal morbidity
- trend
- united states
This is an open access article distributed in accordance with the Creative Commons Attribution Non Commercial (CC BY-NC 4.0) license, which permits others to distribute, remix, adapt, build upon this work non-commercially, and license their derivative works on different terms, provided the original work is properly cited, appropriate credit is given, any changes made indicated, and the use is non-commercial. See: http://creativecommons.org/licenses/by-nc/4.0/.
Statistics from Altmetric.com
Strengths and limitations of this study
Large population-based database with detailed demographic and clinical information which allowed adjustment for temporal changes in many known risk factors for preterm birth.
Major clinical preterm birth subtypes were identified and subsequent neonatal outcomes were described by gestational age categories to provide clinically relevant information.
Data on pregnancy and birth outcomes were collected and coded consistently over the study period.
Clinical details on severity of some neonatal morbidities including necrotising enterocolitis and retinopathy of prematurity were not available.
Coding for neonatal sepsis did not differentiate between sepsis confirmed by blood or cerebrospinal fluid culture and a clinical diagnosis of sepsis without microbiological confirmation or between early-onset and late-onset sepsis.
Introduction
Preterm birth, defined as birth before 37 weeks’ gestation, is the leading cause of neonatal mortality and morbidity, and a major risk factor for long-term neurological and respiratory morbidity and neurodevelopmental impairment.1–3 In the USA, the rate of preterm birth increased by 24% between 1990 and 2006, from 10.6 to 13.1 per 100 live births, mainly due to an increase in obstetric intervention at late preterm (34–36 weeks’ gestation).4–6 More recently, preterm birth rates declined to 9.8 per 100 live births in the USA in 2015.7 8 Nevertheless, the high rate of preterm birth remains a considerable concern.
Preterm birth can result from many possible aetiologies.9 The three major clinical subtypes of preterm birth include clinician-initiated preterm birth, preterm birth following preterm premature rupture of membranes (PPROM) and preterm birth following spontaneous labour with intact membranes.1 9 Clinician-initiated preterm birth, including labour induction and caesarean delivery without labour, constitutes about 30%–40% of all preterm births, and pre-eclampsia/eclampsia and severe intrauterine growth restriction are the common indications.9–11 Spontaneous preterm birth can result from multiple causes, including infection or inflammation, incompetent cervix, vascular/placental disorders (other than pre-eclampsia) and uterine overdistension.9
While gestational age at birth is the strongest predictor of adverse neonatal outcomes, the subtype of preterm birth is also important. Preterm infants born to women with spontaneous onset of labour have a better prognosis than infants born following clinician-initiated delivery.5 12–15 However, it is unknown whether the temporal decline in preterm birth is associated with changes in neonatal mortality and morbidity among preterm infants.
Our aim was to describe temporal trends in gestational age-specific rates of neonatal mortality and a composite adverse outcome, defined as neonatal death or any severe morbidity, among preterm infants born following PPROM, spontaneous onset of labour and clinician-initiated delivery. We further examined gestational age-specific rates in the specific neonatal morbidity components included in the composite outcome.
Methods
Study population
We carried out a population-based study including all singleton hospital births to mothers aged 15–60 years in Washington State, USA, between 1 January 2004 and 31 December 2013. We used information from two linked population databases: (1) live birth, fetal and infant death certificates with data on maternal demographic characteristics, obstetric history and pregnancy and birth factors, from the Birth Events Record Database (BERD)and (2) hospitalisation files with information on specific infant morbidities from the Comprehensive Hospital Abstract Reporting System (CHARS). The BERD included information abstracted by trained abstractors using standardised forms about maternal characteristics (eg, maternal age, pre-pregnancy body mass index (BMI), race, education, marital status, smoking status, chronic hypertension, pre-pregnancy diabetes and the type of healthcare insurance provider); obstetric history (eg, parity, assisted conception) and pregnancy, labour and birth characteristics (eg, gestational age at delivery, use of tocolytics, use of steroids at delivery, mode of delivery, prolonged labour, congenital anomalies, neonatal death and birth outcomes). The CHARS database included information on all newborn hospitalisations in Washington State with diagnosis and procedure codes related to each hospitalisation episode coded by the International Classification of Diseases, 9th Revision, Clinical Modification (ICD-9-CM). The completeness and accuracy of these databases was monitored by the Washington State Department of Health with annual assessments and consistency checks.16–18 Records flagged with inconsistent or out-of-range entries were addressed systematically through hospital review and correction. The frequency of diagnostic and procedure codes was monitored in annual reports.18 Previous validation studies of the linked dataset showed that the positive and negative predictive values (PPV and NPV) for delivery characteristics were above 80% and 98%, respectively;19 20 for example, labour induction had PPV 89.0% and NPV 94.5%.20 Gestational age at delivery was based on ultrasound dating, and last menstrual period dating was used for women with missing ultrasound data. We excluded infants born at less than 24 weeks’ and greater than 45 weeks’ gestation and those with missing data on gestational age from the overall study population. After analysis of temporal trends in stillbirth, we excluded stillborn infants and those with missing mode of delivery to limit the analyses of neonatal outcomes following various types of preterm birth to live births only.
Classification of preterm birth
Preterm birth was defined as a live birth at 24–36 completed weeks’ gestation. Preterm birth subtypes were categorised using the following algorithm: first, spontaneous preterm births following PPROM (≥12 hours); second, clinician-initiated preterm births following labour induction or caesarean delivery without labour and third, all other births were classified as spontaneous preterm births following spontaneous labour onset with intact membranes (online supplementary file 1, item nos. 62, 64, 65).
Supplementary file 1
Outcome measures and covariates
The primary outcomes were neonatal mortality and a composite adverse outcome including death or severe neonatal morbidity. Neonatal mortality was defined as death of an infant that occurred within the first 28 days after birth, including deaths in the delivery room, in-hospital deaths and deaths after hospital discharge. Severe neonatal morbidity was identified using ICD-9-CM codes and included (1) bronchopulmonary dysplasia (BPD); (2) intraventricular haemorrhage grade≥3; (3) periventricular leukomalacia; (4) retinopathy of prematurity (ROP); (5) necrotising enterocolitis (NEC), (6) neonatal sepsis; (7) convulsions of newborn and (8) severe birth trauma (online supplementary appendix table 1).
Supplementary file 2
Temporal changes in maternal characteristics over the study period were examined, including maternal age (<20, 20–29, 30–39, 40+years); pre-pregnancy BMI (underweight <18.5 kg/m2, normal BMI 18.5–24.9 kg/m2, overweight 25–29.9 kg/m2 and obese ≥30 kg/m2); race (non-Hispanic White, African American, Native American, Hispanic and other); maternal education (≤8 years vs >8 years); smoking during pregnancy (yes/no); marital status (married/common law vs other); parity (prior live births, yes/no); chronic hypertension (yes/no); pre-pregnancy diabetes (yes/no); assisted conception (yes/no); use of antenatal steroids (yes/no); use of tocolytics (yes/no) and type of health insurance coverage (Medicaid, self-pay, private, other). We also examined temporal trends in infant characteristics including gestational ages in completed weeks (within gestational age categories), small-for-gestational age infant (SGA, <10th percentile;21 yes/no), infant’s sex (male/female), congenital anomalies and stillbirths. Congenital anomalies were identified from BERD and included the following conditions observed within the first 24 hours after birth: anencephaly, meningomyelocele or spina bifida, cyanotic congenital heart disease, congenital diaphragmatic hernia, omphalocele, gastroschisis, limb reduction, cleft lip, cleft palate, Down syndrome, chromosomal disorders and hypospadias. We adjusted for temporal trends in these conditions as a potential risk factor for adverse outcomes. Stillbirth was defined as spontaneous intrauterine death of a fetus. Gestational age-specific rates of stillbirths were calculated using the fetuses-at-risk (FAR) approach.22 Under this approach, ongoing pregnancies (fetuses in-utero) at each gestation were used as denominators (the appropriate at-risk population) for the calculation of gestational age-specific stillbirth rates.22 23
Statistical analyses
The preterm birth rate was calculated as a proportion of live births at 24–36 weeks’ gestation among infants born alive at ≥24 weeks. Gestational age-specific temporal trends were described as proportions of extremely preterm births (24–27 weeks), very preterm (28–31 weeks), moderately preterm (32–33 weeks) and late preterm births (34–36 weeks). The Cochran-Armitage test was used to assess the statistical significance of temporal trends over the years. The rates of neonatal mortality and the composite outcome of neonatal death or severe morbidity were also contrasted between years 2004 and 2006 vs 2011 and 2013, using rate ratio (RR) and rate difference and 95% CI.
Logistic regression was used to assess temporal trends in adverse neonatal outcomes adjusted for temporal changes in risk factors that may have changed over the study period: maternal age, pre-pregnancy BMI, race, education, smoking, marital status, parity, chronic hypertension, pre-pregnancy diabetes, assisted conception, health insurance provider, gestational age, SGA infant, sex and congenital anomalies. Calendar year was modelled as a continuous variable. Temporal trends in adverse outcomes were expressed as the average annual change in the odds of neonatal mortality and combined neonatal death or severe neonatal morbidity with adjusted odds ratios (AOR) and 95% CI.
Additional analyses
Temporal trends in the individual components of the composite outcome were examined as secondary outcomes using logistic regression models as described above. These analyses were performed including all preterm live born infants and also for subgroups of infants born at late preterm, at 28–33 weeks and at 24–27 weeks’ gestation.
All analyses were carried out using SAS 9.4 (SAS Institute, Cary, North Carolina, USA). Missing values for BMI (approximately 10%) were imputed using multiple imputation (PROC MI). Other missing values were <3.0% of the total, and the complete case multivariable analysis excluded 7.0% of preterm births. All p values are reported as recommended by the American Statistical Association.24
Patient and public involvement
No patients or public were directly involved in this study.
Results
Study population
Overall, 871 649 singleton births occurred in Washington State from 2004 to 2013. We excluded births at before 24 weeks or after 45 weeks’ gestation, multiple births, births that occurred outside of Washington State and out-of-hospital births as well as births that could not be matched with hospital records (n=116 886, 13.4%). The study population included 754 763 singleton infants born in hospital at ≥24 weeks; of these, 2549 infants were stillborn (0.34%). Further, births with missing information on mode of delivery (n=14 503, 1.9%) were excluded for analyses of preterm birth rates by type of delivery (live births included 737 711 infants; online supplementary appendix figure 1).
The rate of stillbirth increased slightly from 3.2 per 1000 total births in 2004–2006 to 3.7 in 2011–2013 (p=0.002). Stillbirth rates increased at 24–27 weeks (from 0.7 to 1.0 per 1000 FAR, p=0.003) and at 28–31 weeks’ gestation (from 0.4 to 0.7 per 1000 FAR, p=0.002; online supplementary appendix figure 2).
Maternal characteristics changed over the study period; women who delivered in 2011–2013 were older, more educated and had higher pre-pregnancy BMI than those who gave birth in 2004–2006 (table 1). The proportions of births to mothers of Hispanic and African American origin, unmarried mothers and nulliparous mothers increased, while the proportions of mothers who smoked during pregnancy decreased over time. More mothers had chronic hypertension or pre-pregnancy diabetes, and more pregnancies occurred from assisted conception in 2011–2013 than in 2004–2006. The use of antenatal steroids for lung maturation at delivery increased over the study period, while the use of tocolytics declined. All temporal changes were statistically significant (p<0.001, table 1).
Maternal and infant characteristics among all singleton infants born at ≥24 weeks’ gestation), Washington State, USA, 2004–2013
Preterm birth rates
There were 737 711 singleton live births between 2004 and 2013; out of these, 52 014 infants were born preterm (7.1%). Among the preterm infants, 16.4% were born following PPROM, 43.7% were born following spontaneous onset of labour and 39.9% were born following clinician-initiated delivery (online supplementary appendix table 2). The overall preterm birth rate declined from 7.3% in 2004–2006 to 7.0% of singleton live births in 2011–2013. This decline was attributed to the decline in spontaneous delivery following PPROM (from 1.3% to 1.1%) and spontaneous onset of labour (from 3.2% to 3.0%). In contrast, clinician-initiated preterm birth increased slightly from 2.7% to 2.9% (all p values for trend <0.01; figure 1).
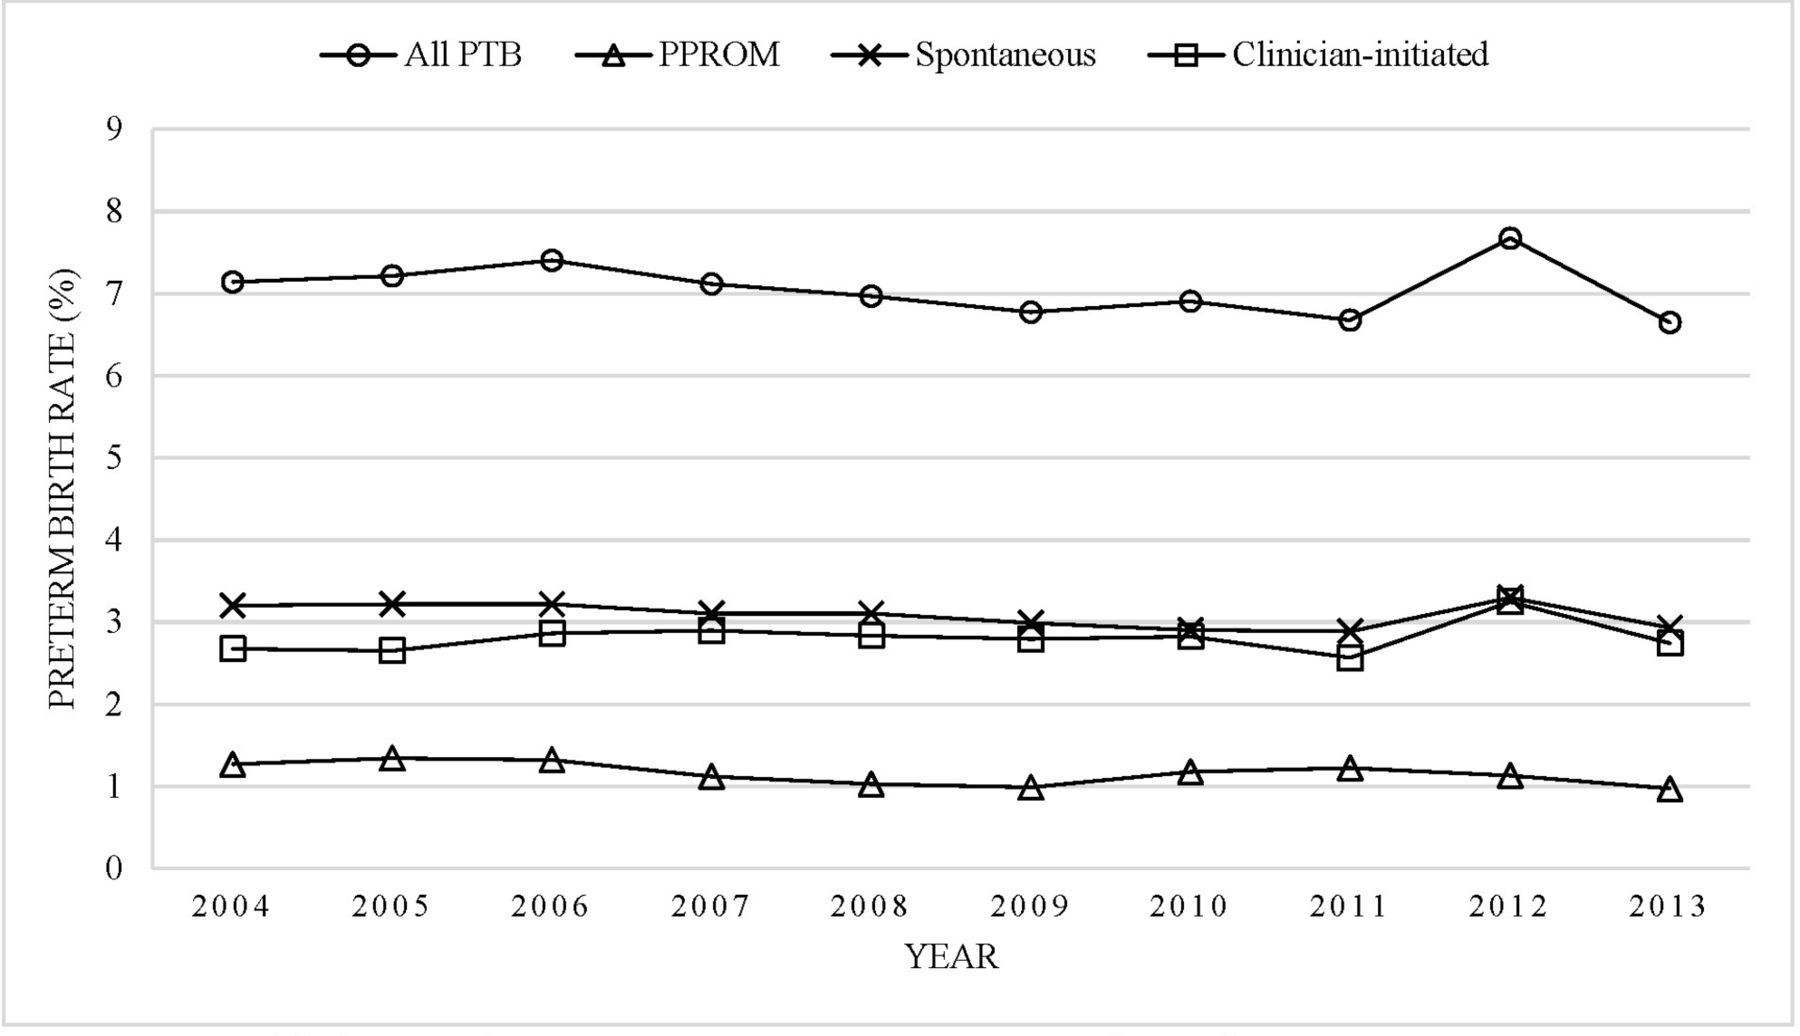
Temporal trends in the rates of singleton preterm birth following PPROM, spontaneous labour and clinician-initiated delivery, Washington State, USA, 2004–2013. PPROM, preterm premature rupture of membranes; PTB, preterm birth.
Gestational age-specific trends in the type of preterm birth varied (figure 2). There were 1833 live births at 24–27 weeks (0.2%); of these, 27.8% were PPROM, 29.0% were spontaneous onset of labour and 43.2% were clinician-initiated delivery. At 28–31 weeks, there were 4095 live births (0.6%); 22.3% were PPROM, 30.6% were spontaneous onset of labour and 47.2% were clinician-initiated. At 32–33 weeks, there were 5664 live births (0.8%); 22.7% were PPROM, 35.1% were spontaneous onset of labour and 42.2% were clinician-initiated. At 34–36 weeks, there were 40 422 live births (5.5%); 14.4% were PPROM, 46.9% were spontaneous onset of labour and 38.7% were clinician-initiated. The overall preterm birth rate increased in all gestational age categories except for late preterm births where the rate declined from 5.8% to 5.3% (all p<0.01). In each gestational age category, the clinician-initiated preterm birth rate increased and the PPROM preterm birth rate declined over time (all p<0.05).

Temporal trends in gestational-age specific preterm birth rates following PPROM, spontaneous labour and clinician-initiated delivery; at 24–27 weeks (Panel A), 28–31 weeks (Panel B), 32–33 weeks (Panel C) and 34–36 weeks (Panel D); Washington State, USA, 2004–2013. PPROM, preterm premature rupture of membranes.
Neonatal mortality
Neonatal mortality remained unchanged over time (1.3%, table 2). Neonatal mortality increased among late preterm infants between 2004–2006 and 2011–2013 (RR 1.25, 95% CI 0.85 to 1.84; average change per year AOR 1.064, 95% CI 1.003 to 1.129; table 2). Overall, higher neonatal mortality was among infants delivered following PPROM (1.7%) and clinician-initiated delivery (1.6%) as compared with spontaneous delivery (0.8%).
Gestational age-specific rates of adverse neonatal outcomes among singleton preterm infants, Washington State, USA, 2004–2013
A significant decline in mortality was observed among infants born following clinician-initiated delivery at 32–33 weeks, from 2.5% in 2004–2006 to 1.0% in 2011–2013 (RR 0.40, 95% CI 0.17 to 0.95; AOR 0.85, 95% CI 0.74 to 0.97; table 3). In contrast, neonatal mortality increased from 0.5% to 0.8% (RR 1.60, 95% CI 0.94 to 2.73; AOR 1.10, 95% CI 1.01 to 1.20) among infants following clinician-initiated delivery at 34–36 weeks.
Gestational age-specific rates of neonatal death by subtype of preterm birth, Washington State, USA, 2004–2013
Composite outcome: Neonatal mortality or severe morbidity
The rate of combined mortality or severe morbidity increased from 7.9% in 2004–2006 to 11.9% in 2011–2013 (RR 1.51, 95% CI 1.40 to 1.62; average change per year AOR 1.06, 95% CI 1.05 to 1.08; table 2). This increase was predominately due to an increase in combined mortality or severe morbidity among infants born at 32–33 weeks and 34–36 weeks’ gestation (RR 1.44, 95% CI 1.19 to 1.74, and RR 2.16, 95% CI 1.89 to 2.47, respectively); the relative average increase in the odds of combined neonatal mortality or severe morbidity was 5% per year among infants born at 32–33 weeks (AOR 1.05, 95% CI 1.02 to 1.08) and 10% per year among infants born at 34–36 weeks (AOR 1.10, 95% CI 1.08 to 1.12). Rate differences are shown in online supplementary appendix table 3.
The rate of composite neonatal mortality or severe morbidity increased in each preterm birth subtype (all p<0.001, table 4). The rate was highest among infants born following PPROM (14.8%), and these infants had the largest relative increase (10% per year) in combined mortality or severe morbidity over the study period (AOR 1.10, 95% CI 1.07 to 1.13). Gestational age-specific analyses of trends in combined neonatal mortality or severe morbidity showed an increase in the rates among infants born at 34–36 weeks in all subtypes of preterm birth (PPROM: RR 2.20, 95% CI 1.64 to 2.96; spontaneous: RR 2.32, 95% CI 1.85 to 2.90; clinician-initiated: RR 2.04, 95% CI 1.65 to 2.51; table 4), and increases in the rates among infants born following PPROM at 28–31 weeks (AOR 1.07, 95% CI 1.02 to 1.13) and 32–33 weeks (AOR 1.12, 95% CI 1.06 to 1.19). In addition, a significant increase in combined neonatal mortality or severe morbidity was observed among infants born following spontaneous onset of labour at 24–27 weeks’ gestation (AOR 1.09, 95% CI 1.01 to 1.17). In contrast, clinician-initiated delivery at 24–27 weeks was associated with a decline in the rate of composite adverse outcome (AOR 0.93, 95% CI 0.87 to 0.99).
Gestational age-specific rates of neonatal death/severe morbidity by subtype of preterm birth, Washington State, USA, 2004–2013
Additional analyses
The most prominent temporal trend in the rates of specific severe neonatal morbidities was an increase in the rate of neonatal sepsis, from 4.5% in 2004–2006 to 8.5% in 2011–2013 (AOR 1.09, 95% CI 1.08 to 1.11). The rate of sepsis increased substantially among late preterm infants from 1.7% to 4.5% (AOR 1.12, 95% CI 1.10 to 1.14), infants born at 28–33 weeks (AOR 1.07, 95% CI 1.05 to 1.10), and those born at 24–27 weeks (AOR 1.05, 95% CI 1.01 to 1.09). In contrast, the rate of BPD among preterm infants decreased from 2.0% to 1.7% (AOR 0.95, 95% CI 0.93 to 0.98; online supplementary appendix table 4), mainly in infants born at 28–33 weeks (AOR 0. 93, 95% CI 0.89 to 0.97).
Discussion
Our findings show a decline in the preterm birth rate in Washington State between 2004 and 2013 that was predominately due to a decline in spontaneous preterm birth (PPROM and spontaneous preterm labour), while clinician-initiated preterm deliveries increased slightly. These changes were associated with increased mortality among late preterm infants born following clinician-initiated delivery and increased rates of the composite outcome of neonatal mortality or severe morbidity among all late preterm infants. The rise in neonatal morbidity was driven mainly by the increase in the rate of neonatal sepsis.
After a large increase in the preterm birth rate in the USA in the early 2000s, a decline was observed from 12.8% in 2006 to 9.8% in 2015.4–8 A recent study by Gyamfi-Bannerman et al showed a decline in both clinician-initiated and spontaneous preterm birth rates between 2005 and 2012.10 Our study provides more detailed information on preterm birth categories and describes temporal trends in neonatal outcomes adjusted for changes in important risk factors.
Obstetric interventions, changes in practice patterns and implementation of specific evidence-based guidelines for high-risk women may be reasons behind the decline in preterm birth following spontaneous onset of labour. The use of 17 α-hydroxyprogesterone caproate (17P) for women with previous spontaneous preterm births, and the use of vaginal progesterone for select women with short cervical length and without prior preterm birth progressively increased between 2006 and 2013 and may have led to a decline in spontaneous preterm births.6 25–29 More aggressive pursuit of expectant management in PPROM, preeclampsia and intrauterine growth restriction may have led to a delivery at later gestation in high-risk mothers.30–32 Other changes including declines in births to teenage mothers may have contributed to an overall decline in the preterm birth rate, while increases in maternal age, obesity and assisted conception have likely contributed to an increase in clinician-initiated delivery in general.33–35
In 1999 and 2009, the American College of Obstetrics and Gynecologists (ACOG) advocated against elective deliveries under 39 weeks of gestation in an effort to prevent non-medically indicated preterm births and the potentially avoidable morbidity associated with these deliveries.36 37 Previous studies have shown that timely medically indicated clinician-initiated delivery can prevent stillbirth and reduce neonatal mortality.23 38 39 A population-based study of all births in the USA showed that the 68% increase in clinician-initiated preterm births between 1995 and 2005 was not associated with increased rates of neonatal mortality/morbidity.5 In our study, the small increase in clinician-initiated interventions was associated with reduced mortality at 32–33 weeks and reduced mortality/severe morbidity at 24–27 weeks. However, at late preterm, declines in spontaneous and PPROM birth and increases in clinician-initiated delivery were associated with increased rates of mortality/severe morbidity. This may be due to temporal increase in maternal chronic morbid conditions that we did not adjust for in our study, for example, asthma, autoimmune conditions or respiratory morbidity.
The increase in neonatal sepsis was observed in all subtypes of late preterm birth, which points to possible common causes relatively independent of delivery type. However, the pathology of neonatal sepsis can vary by preterm birth subtype (eg, originating from the effects of chorioamnionitis in PPROM or IUGR in clinician-initiated delivery), and the uniform increase may be due to the broad definition of sepsis in our study, which included early and late onset sepsis. This unfavourable trend in adverse neonatal outcomes in our study thus warrants further investigation, as prior studies of clinical sepsis (defined broadly as ‘other infection specific to neonatal period’) in the first 3 months after birth showed a small decline between 1988 and 2006 among preterm infants in the USA.40 The reasons behind the increased rates of sepsis in our study may include temporal changes in the proportion of vulnerable infants, increased use of antenatal steroids or changes in antibiotic use and antibiotic resistance.40 41 Currently, there is lack of clinical diagnostic criteria or ideal laboratory marker for neonatal sepsis with excellent sensitivity for daily clinical operations, rendering the assessment of variation in the incidence rates of neonatal sepsis difficult.41–43 Antibiotics are essential in the treatment of bacterial sepsis and are the most commonly used medications in neonatal intensive units; however, overly liberal antimicrobial use has been associated with increased adverse neonatal outcomes.44 A large population study in California showed substantial variations in antibiotic use that was not related to proven infection, NEC, surgical case volume or neonatal intensive care unit (NICU) mortality, especially among community and intermediate NICUs.44 Unified diagnostic criteria and antimicrobial policies are needed to further examine and address this issue.
The strengths of our study include a large population-based database with detailed information on demographic and clinical risk factors (eg, BMI, assisted conception) and obstetric history (eg, parity, prior adverse outcomes). We were, therefore, able to adjust for temporal changes in a large spectrum of known risk factors for preterm birth. Data on pregnancy and birth outcomes were collected consistently over the study period, and neonatal morbidity was also coded consistently using exclusively ICD-9-CM during the entire study period. The ICD-9-CM code for neonatal sepsis did not change over the study period, and there was no indication of any major changes in clinical diagnostic criteria.
This study has a few limitations. First, clinical details on severity of some neonatal morbidity were not available, for example, the NEC Stage I or ROP Grade I, both of which can be treated conservatively. This led to the inclusion of infants with less severe NEC and ROP or other components of the composite outcome. Second, the ICD-9-CM code for neonatal sepsis did not differentiate between sepsis confirmed by blood or cerebrospinal fluid culture and a clinical diagnosis of sepsis without microbiological confirmation or between early-onset and late-onset sepsis. This could lead to overdiagnosis of neonatal infection. Third, information on termination of pregnancy was not available; thus, we could not account for these temporal changes. However, the vast majority of pregnancy terminations are likely to occur prior to 24 weeks’ gestation; terminations beyond 23 weeks would be included as stillbirths in this study. Temporal changes in gestational age-specific stillbirth rates showed small increases in stillbirth rates at 24–27 weeks and 28–31 weeks, which augments the upward trend in adverse neonatal outcome (mortality or severe morbidity) at 28–31 weeks’ gestation. Fourth, potential errors and omissions are inevitable in large databases; these may have led to non-differential misclassification, which may have resulted in the underestimation of temporal trends. Fifth, the data sources had detailed information on mode of delivery that allowed accurate categorisation of preterm birth subtypes; however, this categorisation may have overestimated the proportion of deliveries following PPROM.45 Data collection had not changed over the study period; however, changes in physician’s preferences for specific mode of delivery (eg, trial of labour before caesarean delivery) may be responsible for year-to-year fluctuation in temporal trends in preterm birth subtypes. Last, a relatively large number of temporal trends were assessed, possibly rendering some trends statistically significant due to chance. In addition, singleton infants excluded due to out-of-hospital delivery or missing values may have impacted our results; however, non-hospital births are more likely to be term deliveries without complications requiring hospitalisation.
Washington State has one of the lowest preterm birth rates in the USA, and lowest infant mortality rates;46 however, the ranking is very much dependent on the ethnicity, age and socioeconomic status composition of the obstetric population.46 We adjusted for a number of these indices, thus our results are relevant to other states in the USA and high-income countries in general.
Conclusion
Our objectives were to assess temporal trends in gestational age-specific rates of neonatal mortality and a composite outcome of neonatal mortality or severe morbidity among preterm infants. The small decline in the preterm birth rate in Washington State from 2004 to 2013 was predominantly due to a decline in the rates of spontaneous onset of labour and PPROM at late preterm. This was associated with increased neonatal mortality among late preterm infants born following clinician-initiated delivery and increased rate of composite outcome including neonatal death or severe morbidity among all late preterm infants. The increase in adverse neonatal outcomes among late preterm infants and increase in sepsis rates among all preterm infants warrant further investigation. Our results are important for identifying areas for improvement in obstetric and neonatal healthcare and serve as hypothesis generating findings to direct further research.
References
Footnotes
Patient consent for publication Not required.
Contributors SL and LLR designed the study, LLR and SL performed data analysis and LLR and SL wrote the first draft of the manuscript. GMM, JT, AS and KIL contributed to the interpretation of the results and critically revised the first draft. LLR, SL, GMM, JT, AS and KIL approved the final version of the manuscript.
Funding This work was funded by the Canadian Institutes of Health Research (F17-02161), University of British Columbia Department of Obstetrics and Gynaecology and the BC Women’s Health Research Institute. SL is supported by a Michael Smith Foundation for Health Research Scholar Award. JT is supported by the Investigator Grant Award Program from British Columbia Children’s Hospital Research Institute. GMM is supported by a Vanier Canada Graduate Scholarship.
Competing interests None declared.
Ethics approval All analyses were performed on publicly accessible deidentified data. An exemption from ethics approval was granted by the Department of Social and Health Services, State of Washington.
Provenance and peer review Not commissioned; externally peer reviewed.
Data sharing statement Analyses were based on administrative data collected and maintained by the Department of Health, State of Washington. The availability of the data is restricted. Permission for data access can granted after verification of the research goals by the Department of Social and Health Services, State of Washington.