Article Text

Abstract
Objectives Currently relative performance at medical school (educational performance measure (EPM) decile), additional educational achievements and the score on a situational judgement test (SJT) are used to rank applicants to the UK Foundation Years postgraduate medical training programme. We sought to evaluate whether these three measures were predictive of subsequent successful completion of the programme, and thus were valid selection criteria.
Methods Data were obtained from the UK Medical Education Database (UKMED) on 14 131 UK applicants to the foundation programme starting in 2013 and 2014. These data included training outcomes in the form of Annual Reviews of Competency Progression (ARCPs), which indicated whether the programme was successfully completed. The relationship between applicants’ performance on the three selection measures to the odds of successful programme completion were modelled.
Results On univariable analyses, all three measures were associated with the odds of successful completion of the programme. Converting the SJT score to deciles to compare the effect sizes suggested that one decile increase in the EPM increased the odds of completing the programme by approximately 15%, whereas the equivalent value was 8% for the SJT scores. On multivariable analyses (with all three measures included in the model), these effects were only independently and statistically significant for EPM decile (OR 1.14, 95% CI 1.10 to 1.18, p<0.001) and SJT z-score decile (OR 1.05, 95% CI 1.01 to 1.09, p=0.02).
Conclusions The EPM decile and SJT scores may be effective selection measures for the foundation programme. However, educational achievements does not add value to the other two measures when predicting programme completion. Thus, its usefulness in this context is less clear. Moreover, our findings suggest that the weighting for the EPM decile score, relative to SJT performance, should be increased.
- foundation programme
- selection
This is an open access article distributed in accordance with the Creative Commons Attribution Non Commercial (CC BY-NC 4.0) license, which permits others to distribute, remix, adapt, build upon this work non-commercially, and license their derivative works on different terms, provided the original work is properly cited, appropriate credit is given, any changes made indicated, and the use is non-commercial. See: http://creativecommons.org/licenses/by-nc/4.0/.
Statistics from Altmetric.com
Strengths and limitations of this study
The study covers two complete cohorts of UK applicants to foundation training with the Annual Reviews of Competency Progression (ARCP) outcomes for the first 2 years of their foundation training.
Furthermore, there is no ‘range restriction’ (ie, outcomes can only be observed in selected candidates) as nearly all UK applicants get a place on the foundation training programme.
There is very little variation captured in ARCP outcomes: most trainees complete the foundation programme.
Thus, the measure, in this context, will only yield information on trainees at the lower end of the performance range.
More sensitive criteria for assessing the validity of the selection measures would be useful.
The study did not have access to more granular data on ‘doctors in difficulty’ captured locally by foundation schools and some of the doctors will have been assisted in order to complete the programme.
Similarly, additional information may be present in the end of placements reports completed by trainees’ clinical supervisors in the e-portfolios each trainee is required to maintain.
Introduction
In the UK, the foundation programme is a 2-year generic training programme, which forms the bridge between medical school (4–6 years depending on the school) and specialist medical/general practice training. It is equivalent to the internships in the USA.1
In order to standardise recruitment to this stage of training, the Improving Selection to the Foundation Programme project developed methods for selection into the foundation programme. These were the situational judgement test (SJT) and the educational performance measure (EPM).
SJTs present a series of scenarios that depict hypothetical workplace interpersonal dilemmas. In the SJT format used in the foundation programme selection candidates must rank a number of possible behavioural responses, in order of appropriateness and/or effectiveness. A score is generated based on the similarity of the ordering to those previously agreed on by a subject matter expert panel. The content domains of the SJT are labelled as follows: coping with pressure, working effectively as part of a team, effective communication, problem solving and commitment to professionalism.2-4
The SJT scores have been in use for selection to the foundation programme since 2013. Such SJT scores have been shown to have predictive validity for subsequent workplace performance across a range of occupations.5 6 However, they have only been used in medical selection in more recent years and there are fewer validity studies in this context. Previously, a study examining the validity of the SJT for selection into general practice (GP) training reported that the scores accounted for 6% of the variation in end of GP training assessments. However, it is not clear if this finding relates to the applied knowledge test or the clinical skill assessments.7 A separate study examined recruitment to core medical training (CMT).8 The authors concluded that SJT performance was the best single predictor of interview scores. However, the study did not use outcomes from medical training such as Membership of the Royal Colleges of Physicians of the UK exam results to explore the predictive validity of the SJT for selection into CMT programmes. The authors note that the study sample comprised only a subset of applicants—those who applied to both CMT and GP. Thus, this sample may not have been representative of the CMT applicant population as a whole. A follow-up study of this same cohort of CMT trainees reported on the relationship between the selection methods used and subsequent performance at postgraduate membership exams.9 The authors reported that the clinical problem solving test and SJT scores explained an additional 6.3%–21.6% of the variance in performance on the membership exams, after accounting for the variance predicted by the existing CMT selection methods.
In relation to the SJT for selection into foundation training, a report on the initial validation study, produced by Work Psychology Group (the company that developed the SJT) has been published.10 11 The authors gathered data on the performance during the first year of the programme (‘F1’) for a sample of 391 F1 doctors across five foundation schools that entered foundation training in 2013 using a bespoke questionnaire, matched to the domains measured at application, completed by supervisors. Their sample specifically targeted doctors in the first year of the foundation programme, who had received particularly high or particularly low SJT scores. The relationship between application scores (SJT and EPM) and the performance scores from the bespoke questionnaire and Annual Reviews of Competency Progression (ARCP) were analysed. They found that higher SJT scores and higher EPM were associated with higher ratings of F1 performance on the questionnaires. They found the correlations were different when their sample was split into high and low SJT scorers. From this analysis, they concluded that the EPM had a stronger correlation with performance for the high scoring SJT group and the SJT a stronger correlation for the low scoring SJT group. This observation could be explained by the contrasting psychometric properties of the two measures: SJTs tend to yield maximal information at the lower range of ability (ie, most candidates find the items relatively easy),12 while EPM is likely to have been able to discriminate between average to high performing candidates (as in effect, the measure is based on rankings with peers in medical school). They found no differences on EPM or SJT scores for those who received unsatisfactory ARCP outcomes compared with those that received satisfactory outcomes. However, they note this was likely to be due to their small sample size. The authors made the following recommendation:
"that further studies are undertaken to explore the relationship between performance at application and performance outcomes beyond F1 (for example at the end of F2 and into specialty training) and that application scores (particularly SJT scores) spanning the full range of scores are targeted. If the relationship between application scores and ARCP outcomes is to be examined further, a large population (ideally all schools) should be targeted, as incidences of unsatisfactory ARCP outcomes appear to be very rare (1.1% in the present sample)."
The EPM has two elements which this study considers as separate variables: EPM decile score and educational achievements.
The EPM decile score
Students in the graduating cohort are ranked on their medical school performance. Schools were free to decide which assessments to include, provided they met the following criteria:
Summative (and hence subject to formal controls);
Cover clinical knowledge, skills and performance;
Cover non-clinical performance;
Cover all aspects of the curriculum assessed up to the end of the penultimate year at medical school;
Represent the average performance of the applicants over time, rather than being limited to a snap-shot;
Include written and practical forms of assessment.
Schools were required to consult with students and publish on their website which assessments they included in the score.3
Educational achievements
These are scored by considering additional degrees (maximum of 5 points, scored 5 points for a PhD through to 1 point for a 2.2 class intercalated degree which does not extend the degree programme) and publications (maximum 2 points, 1 point per publication).
There are no published studies on the predictive validity of the EPM decile scores for selection into the foundation years. However, Simon et al reported on the relationship between EPM decile scores and SJT scores, but the data were obtained from trainees in a self-reported survey rather than directly from the UK Foundation Programme Office (UKFPO).13 Their survey achieved a response rate of only 8% (n=3175 from 12 medical schools), so their results (showing no observed association between EPM decile and SJT score) are likely to have been subject to validity-threatening response bias. It is not clear why this approach to the study was taken rather than obtaining the data directly from the UKFPO.
These three selection measures are combined into an overall score that is used to rank applicants to the foundation programme, with the EPM decile score and educational achievements combined into the EPM score and given equal weighting to the SJT score.14 Each applicant is allocated in rank order to their highest preference foundation school (a conceptual grouping of medical schools, deaneries and organisations delivering healthcare—trusts or boards depending on the country within the UK) where a place is available. Highly ranked applicants are more likely to be placed in their first preference foundation school.
Following entry to the foundation programme, each medical trainee’s progress is reviewed at an ARCP. The rating at ARCP is based on a portfolio of evidence collated in the e-portfolio including reviews from supervisors. ARCPs were introduced into foundation training in 2012.15
This approach to foundation programme selection, and in particular the equal weighting given to the EPM and SJT scores, has attracted criticism. Najim et al noted that an applicant could jeopardise 5–6 years of hard work at medical school through underperformance on a single, 2-hour test.16 With the advent of the UK Medical Education Database (UKMED), it is now possible to link information from the various databases used to administer medical education.17 Thus, there was an opportunity to assess the extent to which the selection scores predicted foundation ARCP outcomes for two cohorts of applicants.
This study is thus important in adding to the growing body of evidence in relation to the use of SJTs in medical selection. To the authors’ knowledge, it is the first investigation into whether performance on this measure predicts successful completion of an early postgraduate medical training programme. Moreover, developing a better understanding of how SJT scores should be weighted within the selection process, in relation to academic achievement, is crucial. This need is especially pressing given the recent, rapid and international implementation of SJTs into medical selection over a range of career stages.
Methods
Study population
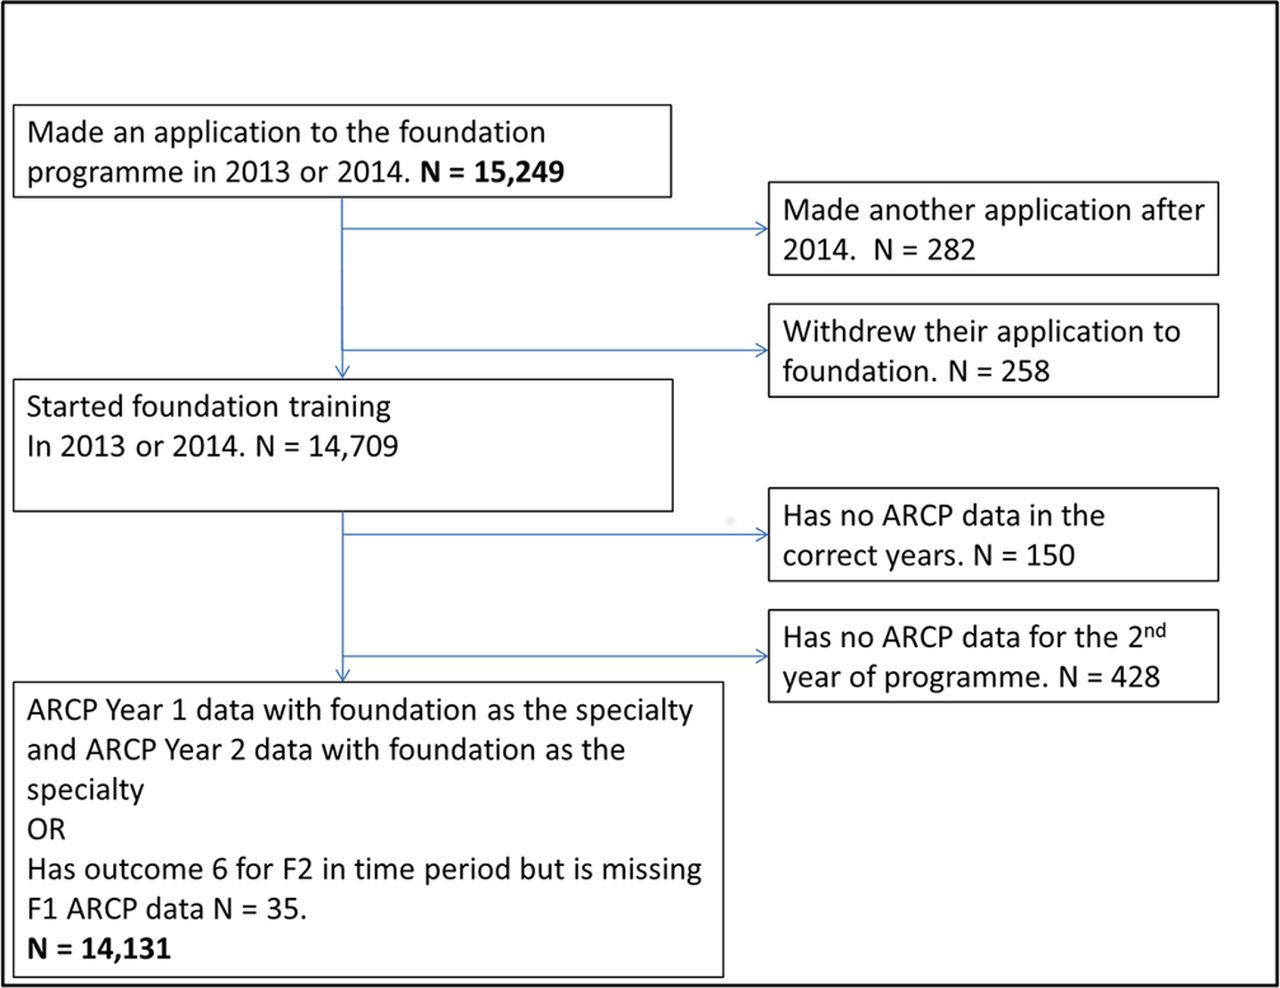
All applicants making their final application (ie, the application that led to the applicant starting on the foundation programme) in 2013 and 2014 were eligible for inclusion in the analysis (n=15 249). Figure 1 outlines which cases had enough data points for inclusion in the analysis that follows. There were data on 14 131 doctors that met the criteria for inclusion in the main analyses.

Data flow through study. ARCP, Annual Reviews of Competency Progression.
The final sample available for analysis comprised 7134 doctors who started their foundation training in 2013 (50.5%) and 6997 who started in 2014 (49.5%). All doctors had attended a UK medical school, as at this point in its development UKMED did not include graduates from non-UK institutions. The mean age on 1 August in the year the doctor started foundation training was 24.88, with an SD of 2.73 (n=14 131). Their characteristics are further described in table 1.
Sample demographics
Patient and public involvement
Neither patients nor the public were involved in this study. Medical students and trainees are represented on the UKMED Advisory Board, which approves UKMED research projects.
Data management
The UKMED includes data from foundation programme applications obtained from the UKFPO’s Application System and MSC Assessment. Educational achievement scores were capped at seven as per the guidance in the UKFPO Applicant Handbook.11
SJT scores are only equated across papers within the application year, so to allow scores from >1 year to be used together, the SJT raw score was converted to a z-score based on the operational statistics for the applicant’s paper and year in the technical reports published by the Work Psychology Group on the Improving Selection to the Foundation Programme website.3 4 To aid interpretation of the ORs in the models used to predict successful completion, we converted this z-score into deciles based on their rank within the year of application to allow direct comparison with the EPM decile. Thus, both predictors were placed on a similar metric, although the locally derived nature of the EPM decile must be borne in mind.
The UKMED receives ARCP outcome data from the GMC’s annual collection of ARCP outcomes from postgraduate training providers.18 19 The outcome variable used was obtaining an ‘outcome 6’. This is defined by the UKFPO as ‘satisfactory completion of F2—recommendation for the award of the Foundation Achievement of Competence Document’ at the end of their F2 year in 2015 (2013 starters) or 2016 (2014 starters).14
Medical schools were defined using the values in the Higher Education Statistics Agency (HESA) data. Cases were grouped as follows:
The medical school on entry and exit was used when the admitting school and graduating school were the same. Where the graduating medical school was not the same as the admitting medical school and the case was part of a group that formed a distinct cohort with >20 cases, such as students who started at St Andrews, Durham or Oxbridge but completed their clinical undergraduate years at another medical school, we used first and last medical school combined. EPM decile scores are calculated for each medical school’s graduating cohort.
We used the foundation school that awarded the outcome 6. In 12 188 (86.3%) cases, the foundation school awarding the outcome 6 was the same as the foundation school awarding the ARCP outcome in the first year of the foundation programme. Some of the 14% of changes reflected renaming and merging of foundation schools, for example, 74 cases started in Staffordshire Foundation School and received their outcome 6 from West Midlands North Foundation School. There were also 906 doctors who started at one of the following foundation schools: North Central, North East Thames or North West Thames Foundation School, but received their outcome 6 from North Thames Foundation Schools. HESA records disability for each academic year the student has a record.20 For these analyses, we used the disability value from the final year. The disability categories recorded by HESA were collapsed into ‘no disability’ versus ‘disability’.
Age was calculated as age at the start of the foundation programme: age on 1 August 2013 or 1 August 2014, depending on the year or application.
Analysis
Data management and analysis was conducted using SPSS V.24 and MLwiN V.2.32.21 Multilevel logistic regression models with trainees cross-classified and nested within medical schools and foundation schools were fitted in MLwiN using the method described by Leckie.22
In addition to testing which of the three selection measures predicted completion of the foundation programme, additional analyses were performed to understand if any sociodemographic variables were related to foundation outcomes. This model was fitted using stepwise backwards elimination: at each step, a non-significant variable was eliminated from the model, until only significant variables remained at the p=0.05 level. The stepwise method used a reduced dataset where no missing data on the covariates existed, to ensure ‘true nesting’ while model building (n=7539). The following variables were not statistically significant when entered in the multivariable model: sex, ethnicity, nationality, school type, receipt of a UKCAT bursary, graduate on entry, parental education, IMD-quintile socioeconomic classification, young participation (POLAR3) quintile, Income Deprivation Affecting Children Index rank, course type grouped, year commencing medical school and SJT paper number (see online supplementary material for more information on these variables).
Supplemental material
Figures 2, 3 and 4 display the mean proportions with 95% CIs. These were calculated using the method recommended by Newcombe and Altman.23

Per cent awarded an outcome 6 by educational performance measure deciles (n=14 131).

Per cent awarded an outcome 6 by situational judgement test z-score deciles (n=14 128).

Per cent awarded an outcome 6 by educational achievements score (n=14 131).
Results
A total of 13 788 (97.6%) cases in the sample had successfully achieved the required competencies (ARCP ‘outcome 6’) by the end of their 2-year programme. The results from univariable logistic regressions (table 2) show that all three measures, the SJT z-score (mean=0.10, SD=0.86), EPM (mean=5.62, SD=2.83) and educational achievements (mean=2.47, SD=2.01) predict obtaining an outcome 6. For each decile increase in the EPM, an applicant achieves the odds of an ‘outcome 6’ increase by roughly 15%; for each decile, increase in the SJT decile score an applicant achieves the odds of an outcome 6 increase by approximately 8%. For each additional point in their educational achievement score, a foundation applicant’s odds of an outcome 6 increase by roughly 7%.
Univariable relationships between each foundation selection measure and successful completion (ARCP ‘outcome 6’)
Figures 2 and 3 illustrate the relationship between completion of the foundation programme and the SJT z-score and EPM deciles: for both measures those applicants achieving at the lowest decile have a reduced proportion of ‘outcomes 6’ compared to those at the top decile, but the relationship for the intermediate deciles is non-linear.
The distribution of the educational achievements score does not allow splitting into decile groups, so the relationship between the proportion of ‘outcome 6 s’ and the score is presented separately on figure 4. The groups with scores of 0, 2, 3 and 7 have the same mean proportion of outcome 6.
The three selection scores intercorrelated to some degree: the highest correlation being between EPM decile and SJT z-score (Spearman’s rho=0.30, N=14 128) and the lowest between educational achievements and SJT z-score (Spearman’s rho=0.12, n=14 131), with the correlation between EPM decile and educational achievements at rho=0.28 (n=14 131).
In the first model (model 1, table 3), a two-level multivariable logistic regression was fitted to predict achievement of an ‘outcome 6’ with trainees nested within a cross-classification of medical schools and foundation schools. The EPM decile score and the SJT z-score were statistically significant predictors at the p<0.05 level. In terms of interpreting the results, for an increase of one EPM the odds of successful completion of the foundation programme increased by approximately 14%. Similarly, for an increase of 1 SD on the SJT z-score the odds of an outcome 6 increased by approximately 18%. The education achievement measure is not independently and statistically significantly associated with successful completion when all three measures are included in a model.
Results from multilevel multivariable logistic regression analyses predicting an ‘outcome 6’ with the foundation selection measures (N=14 128 applicants nested in medical schools and foundation schools (cross-classified))
In the second model (model 2, table 3), the SJT z-score was converted to the same metric as the EPM (decile ranks within year of application to foundation) to allow the adjusted ORs obtained for the two measures to be directly compared. As before, one decile increase in the EPM increases the odds of an outcome 6 by 14%; one decile increase in the rank of the SJT z-score independently increases the chance of an outcome 6 by 5% (p=0.02).
The variables that were statistically significant predictors at the p<0.05 level in a series of univariable analyses (see online supplementary material) were included in a third multivariable model (model 3, table 3). As there were no missing data for the final variables included, it was possible to use all cases. Trainees with no disability recorded by HESA in their final year of medical school had an approximately 66% higher odds of an outcome 6 compared with those with a disability recorded. Older trainees were less likely to be awarded an outcome 6: each additional year reduced the odds by approximately 9%. Trainees who had made additional applications were less likely to get an outcome 6, with each additional application reducing the odds by roughly 54%.
After controlling for age, disability, the number of applications made and the medical school, the EPM decile score remained a significant predictor of obtaining an outcome 6 while SJT z-score did not.
Discussion
In this study, we were able to show that the three main selection measures (SJT score, EPM and educational achievements) used in ranking applicants to the UK foundation programme were related to the odds of successful completion of this stage of training. However, the relationship between educational achievements and completion was not independent of the other two measures. In contrast, the SJT score appeared to offer some degree of incremental predictive validity over that provided by the EPM deciles, suggesting that it is capturing additional, and relevant, information on applicants as intended by its developers. As such, our findings add to the emerging evidence of the potential usefulness and validity of SJTs in medical selection across different career stages and for different clinical specialisations in relation to a number of educationally and clinically relevant outcomes. 24 25
Our findings in relation to trainee age are in keeping with those reported by an earlier study by Pyne and Ben-Shlomo,26 who reported that older doctors in their sample of specialty trainees were more likely to have problems with progression at ARCP than their younger colleagues. The relationship between disability and ARCP has not previously been reported on; here, we found that those trainees who had a disability (any category) as recorded by HESA were less likely to obtain an outcome 6.
Reflecting on our key findings, it is perhaps unsurprising that the educational achievements measure was not independent of the other measures. This metric would have been skewed by the relatively small number of students who had participated in research projects, often as part of intercalated degrees. Such students would also have been likely to have been ranked relatively highly, according to their medical school EPMs. It is also worth commenting that, at first glance, both the EPM deciles and the SJT scores appear equally predictive of completion of the foundation programme. However, when we attempt to place both measures, although be crudely, on the same scale (ie, divided into deciles), it is clear that EPM deciles are more predictive of this outcome, compared with SJT scores, with a ratio of roughly 2:1. Of course, the situation is complicated by the fact that EPM deciles are locally derived measures, while SJTs are nationally standardised tests. There may be ways in future research that the EPMs can be adjusted to make them more nationally comparable using ‘Peer-Competition Rescaling’.27 Nevertheless, despite the local nature of EPM deciles this finding remains relevant to policy as both SJT scores and EPM deciles are used in the national selection process. It is also known that SJTs are generally encountered as relatively easy tests by candidates, and therefore most of the information is available on those below the average level of performance.12 This infers that the SJT scores are likely to be relatively poor at differentiating more highly performing candidates from each other. We noted that once the scores were divided into deciles, this would have inevitably led to some loss of information, and resulted in a reduced degree of statistical significance in the relationship between this predictor and the outcome of interest, with the p value increasing from 0.01 to 0.02 when entered into a multivariable model with the other selection measures. In contrast, EPM deciles may be able to differentiate between both low and high performing candidates. This proposition is supported by our findings illustrated in figure 2: the centre portion of the graph is relatively flat with the slopes being steepest at the extreme ends of lower and highly EPM decile ranked applicants. We also noted that, in contrast to EPM, SJT scores were not independently and statistically significant predictors of outcome 6 s once three other background variables were put into a multivariable model (disability, number of applications and age). However, as applicant ranking does not take into account these latter three factors, this finding does not have direct importance to policy. Furthermore, it does suggest that at least some of the variance in SJT scores may be associated with these variables, although the directionality of influence could not be established from these data. Nevertheless, it is known that some demographic factors (such as female sex and ethnicity) are associated with SJT performance in general28 and therefore the use of such selection measures may have an indirect effect on the advantage (or disadvantage) experienced by certain subpopulations of applicant.
This was a relatively complete national dataset with few missing data. However, a number of limitations of the study are worth noting. First, the UKMED phase I cohort does not include graduates from non-UK medical schools who apply to foundation training. However, from 2015 onwards the non-UK students have been included in the data UKMED receives on foundation applications, permitting research into this area. Second, suboptimal ARCP outcomes are relatively rare in the foundation programme period of training. Unlike later periods of postgraduate medical training, there are fewer categories of ARCP outcome, and therefore at foundation stage they are a relatively information poor variable, picking up only cases where issues impacting performance were severe enough to prevent the doctor completing the programme. Moreover, there were no data on which trainees received remedial support during the foundation programme were available for this study. Thus, it is possible that a number of doctors who received outcome 6 s had required, sometimes considerable, support in order to achieve this. To establish whether the SJT and EPM deciles predict which trainees required additional support from their foundation schools would require the UKMED to have identifiable data on doctors in difficulty on the foundation programme. The UKFPO annual reports give figures for the numbers of doctors in difficulty: in 2014 there were 186 F1s and 163 F2s from UKMED medical school monitored via foundation schools’ doctors in difficulty (DiD) policies and processes. In 2015, there were 251 F1s and 210 F2s monitored via these policies.29 We do not know which ARCP outcomes these doctors were finally awarded. Similarly, at the other end of the scale, the outcome 6 category does not capture performance that exceeds that which is required to achieve the foundation competencies. Thus, in psychometric terms, the outcome would have generally yielded information on trainees at the lower end of performance. That is, the results may tell us relatively little about candidates who score relatively highly on the three selection measures.
More variance may also be present in the end of placement reports completed by trainees’ clinical supervisors in the e-portfolio each trainee is required to maintain. A score derived by summing across the six to eight clinical supervisor reports that are completed over the course of the foundation programme may provide a more granular outcome measure. Such an approach may be considered closer to the criterion used by Patterson et al, who employed supervisor ratings of trainee job performance at 1 year into training as an outcome to validate selection measures for entry to GP training against.7
Some variation in ARCP outcomes across foundation schools was noted. Moreover, EPM is a local rather than national measure. However, the use of a cross-classified multilevel model should have controlled for these potential clustering effects on the outcome of interest.
The present study relied on data that were already routinely collected and not specifically designed as a criterion to assess the validity of the selection measures. As Austin and Villanova noted using a general overall performance construct such as successful completion of the programme may not allow adequate matching to the predictive measures and it may be more fruitful to match selection measures to particular criteria representing particular aspects of job performance.30 Nevertheless, trainees undertaking the foundation programme and those responsible for managing the programmes are likely to regard it as an important criterion even if fails to capture the full range of foundation doctors’ performance. Other possible criteria include the multispecialty recruitment assessments used for selection into the next stage of training including GP training programmes.31
Our findings have clear indications for selection policy into the foundation programme. In particular, they provide evidence to support the intuitive sense, expressed by some, that excessive weight may be given to the SJT scores within the ranking process.16 Rather our results would suggest a 2:1 weighting ratio between the EPM decile and the SJT score may be the optimum, if the aim is to rank and advantage candidates most likely to successfully complete the foundation programme. Policywise, our findings provide less evidence to support using the educational achievements score in calculating applicant rankings for the foundation programme. If the aim is to select candidates most likely to complete this phase of training then our results suggest that the educational achievements score does not add any incremental value beyond the EPM deciles or SJT scores. However, we are aware we have used a somewhat circumscribed outcome, that is, completion of the programme. It may be that the selectors wish to also advantage applicants, according to their academic records, which are most likely to be educationally, and perhaps clinically successful in their long-term careers. If removal of the educational achievements and an increase in the weighting of the EPM deciles were to be considered then an exercise could be undertaken to model whether such a change would have a significant impact on the numbers of applicants whose rank changes to an extent that they would have been offered a different unit of application. Such weightings would be more in-line with research in selection outside of medicine, where measures of ability are more strongly predictive than personality-type measures. Schmidt and Hunter reviewed meta-analyses of selection methods: when predicting performance in job training programmes they report a mean correlation coefficient of 0.56 for cognitive ability, whereas for integrity and conscientiousness tests they report correlation coefficients of 0.38 and 0.30.32 One might argue that the EPM measure will inevitably reflect cognitive ability while the SJT is more akin to an integrity or personality test.
Further research could focus on the extent to which these foundation selection measures predict long-term success and career choices in medicine. Moreover, there is an immediate intention to further explore and describe the types of disability reported by medical graduates in a forthcoming UKMED project: UKMEDP54 declared disability in the UKMED dataset 2002–2016: an exploratory descriptive analysis. 33
In conclusion, the continued use of the SJT in selection into the foundation programme is justified by these findings, although it may be that excessive weight is being placed on the score, relative to the other two measures. Moreover, the UKFPO could consider discontinuing the use of educational achievements for ranking applicants to the foundation programme, unless it is shown to be associated with more distal markers of success in medical training.
Acknowledgments
Members of the UKFPO Rules Group as at Thursday 24 November 2016 kindly commented on an earlier version of this paper, which only used applicants to the 2013 Foundation Programme. The group advised re-running the study with another cohort of applicants. Ben Griffith, Andy Knapton and Kirsty White at the GMC commented on the paper. Olga Sierocinska King at the MSC collated information on the EPM and commented on the paper. Peter Tang at the MSC commented on the paper. Peter McNair and Ganesan Gurusamy contributed to the maintenance of the UKMED Database held by the GMC. Source of data was the UK Medical Education Database (UKMED) - UKMEDP03 extract generated for publication on 3 November 2016. The authors are grateful to UKMED for the use of these data. However, UKMED bears no responsibility for their analysis or interpretation. The data include information derived from the Higher Education Statistics Agency Limited (HESA) and provided to the GMC (HESA Data). Source: HESA Student Record (2002/2003 and 2012/2013) Copyright Higher Education Statistics Agency Limited. HESA makes no warranty as to the accuracy of the HESA Data, cannot accept responsibility for any inferences or conclusions derived by third parties from data or other information supplied by it.
References
Footnotes
Contributors DTS wrote the first draft of the paper and completed the analysis. PAT contributed to the supervision of the analyses, edited and reviewed and critically appraised the content of the paper.
Funding This research received no specific grant from any funding agency in the public, commercial or not-for-profit sectors. DS is employed by the GMC as a data analyst working on the UKMED project. The views expressed here are his views and not the views of the GMC. PAT is supported in his research by an NIHR Career Development Fellowship. This paper presents independent research part-funded by the National Institute for Health Research (NIHR). The views expressed are those of the authors and not necessarily those of the NHS, the NIHR or the Department of Health." PAT also wishes to acknowledge funding from the Worldwide Universities Network (WUN) that supports an academic collaboration furthering research into selection into the professions.
Disclaimer The views expressed are those of the authors and not necessarily those of the GMC, the NHS, the NIHR or the Department of Health.
Competing interests DTS is employed by the GMC as a data analyst working on the UKMED project. PAT is supported in his research by an NIHR Career Development Fellowship. This paper presents independent research part-funded by the National Institute for Health Research (NIHR). PAT has previously received research funding from the ESRC, the EPSRC, the DH for England, the UKCAT Board and the GMC. In addition, PAT has previously performed consultancy work on behalf of his employing University for the UKCAT Board and Work Psychology Group and has received travel and subsistence expenses for attendance at the UKCAT Research Group.
Patient consent Not required.
Ethics approval The authors did not need to seek formal NHS ethical approval for this study as it was a secondary data analysis of existing data. UKMED has received a letter from Queen Marys University of London Ethics of Research Committee on behalf of all UK medical schools to confirm ethics exemption for projects using exclusively UKMED data.
Provenance and peer review Not commissioned; externally peer reviewed.
Data sharing statement Researchers wishing to re-analyse the data used for this study can apply for access to the same data via UKMED.