Article Text

Abstract
Objectives To describe the prevalence of multimorbidity (presence of two or more long-term health conditions) in the New Zealand (NZ) population, and compare risk of health outcomes by multimorbidity status.
Design Cross-sectional analysis for prevalence of multimorbidity, with 1-year prospective follow-up for health outcomes.
Setting NZ general population using national-level routine health data on hospital discharges and pharmaceutical dispensing.
Participants All NZ adults (aged 18+, n=3 489 747) with an active National Health Index number at the index date (1 January 2014).
Outcome measures Prevalence of multimorbidity was calculated using two data sources: prior routine hospital discharge data (61 ICD-10 coded diagnoses from the M3 multimorbidity index); and recent pharmaceutical dispensing records (30 conditions from the P3 multimorbidity index).
Methods Prevalence of multimorbidity was calculated separately for the two data sources, stratified by age group, sex, ethnicity and socioeconomic deprivation, and age and sex standardised to the total population. One-year risk of poor health outcomes (mortality, ambulatory sensitive hospitalisation (ASH) and overnight hospital admission) was compared by multimorbidity status using logistic regression adjusted for confounders.
Results Prevalence of multimorbidity was 7.9% using past hospital discharge data, and 27.9% using past pharmaceutical dispensing data. Prevalence increased with age, with a clear socioeconomic gradient and differences in prevalence by ethnicity. Age and sex standardised risk of 1-year mortality was 2.7% for those with multimorbidity (defined on hospital discharge data), and 0.5% for those without multimorbidity (age and sex-adjusted OR 4.8, 95% CI 4.7 to 5.0). Risk of ASH was also increased for those with multimorbidity (eg, pharmaceutical discharge definition: age and sex-standardised risk 6.2%, compared with 1.8% for those without multimorbidity; age and sex-adjusted OR 3.6, 95% CI 3.5 to 3.6).
Conclusions Multimorbidity is common in the NZ adult population, with disparities in who is affected. Providing for the needs of individuals with multimorbidity requires collaborative and coordinated work across the health sector.
- multimorbidity
- long-term conditions
- chronic conditions
- epidemiology
This is an Open Access article distributed in accordance with the Creative Commons Attribution Non Commercial (CC BY-NC 4.0) license, which permits others to distribute, remix, adapt, build upon this work non-commercially, and license their derivative works on different terms, provided the original work is properly cited and the use is non-commercial. See: http://creativecommons.org/licenses/by-nc/4.0/
Statistics from Altmetric.com
Strengths and limitations of this study
This study uses national-level data for nearly 3.5 million New Zealand adults to provide robust estimates of the prevalence of multimorbidity.
Multimorbidity was defined using existing methods to classify and code long-term health conditions, based on well-established data sources for prior hospital discharge and pharmaceutical dispensing.
Health outcome measures (mortality and hospital admission) were available for everyone in the study population.
Due to the nature of the data sources, not all long-term health conditions could be measured: the estimates include only conditions recorded during a past hospital admission or those long-term conditions which can be treated by medication (and where medications are specific to treating a condition).
Results may be only partially comparable with those studies from other countries that have used a primary care-based sampling frame or data source to estimate prevalence of multimorbidity.
Introduction
Healthcare delivery in secondary care settings has typically been dominated by systems that focus on the treatment or management of a single disease,1 such as cancer or diabetes, with less attention paid to other health conditions (which are typically conceptualised as comorbidities). Recently, more attention has been given towards the concept of multimorbidity, defined as the copresence of two or more long-term health conditions,2 3 as a framework for viewing a patient’s health needs from a more holistic management perspective.4–6 While such management is considered best practice in primary care settings, the quality of care provided in both secondary and primary care settings could be improved by encouraging a greater emphasis on this approach and considering the complex needs of patients with multimorbidity.7–9
This view of multimorbidity also requires consideration of the social and economic determinants of health that lie upstream of poor health generally.10 11 Long-term conditions are patterned by these determinants of health such as greater exposure to social, environmental or workplace risk factors, which in term often pattern individual-level risk factors, for example, smoking, poor diet, lack of exercise and poorer access to healthcare resources in the socioeconomically disadvantaged.
At an individual level, those with multimorbidity have poorer health outcomes, including increased risk stemming from polypharmacy, worse functional status and lower quality of life.2 12 13 The implications of multimorbidity for health systems have been well described: expenditure on healthcare in high-income countries is dominated by the needs of those with multiple long-term conditions.5 14 Furthermore, while multimorbidity is not restricted to the elderly, it is more prevalent among older people.2 3 Therefore, the healthcare demands and costs associated with multimorbidity will continue to rise as populations age,15 though the rising prevalence of multimorbidity does not appear to be solely driven by ageing populations.16
There have been many prevalence studies of multimorbidity, as described in several systematic reviews.2 3 12 13 Studies have generally focused on multimorbidity in specific populations (eg, the elderly17 18 or among hospitalised patients18); examined the general population, either among registered populations using existing patient databases19 20 or using surveys of the general population15; or have measured multimorbidity during primary care interactions.21
A 2012 systematic review3 looked at variations in the prevalence of multimorbidity by country and research setting (eg, primary healthcare patients or across the general population). Unsurprisingly, studies that sampled individual patients during primary care consultations have typically reported higher prevalence of multimorbidity compared with studies that used broader health system-based populations as the denominator (eg, registered patients).3
This review made two major recommendations for studying multimorbidity: first, use a broad sample frame that matches the appropriate target population; and second, consider a reasonably comprehensive list of long-term conditions to capture the sheer variety of specific health needs that arise in long-term conditions (with a lower bound of 12 eligible conditions suggested as a minimum).3
Our primary objective was to describe the prevalence of multimorbidity for the general adult population in New Zealand (NZ), defining multimorbidity status using past hospital discharge and pharmaceutical dispensing records. To examine health inequities, we also analysed the patterning of multimorbidity by major sociodemographic and socioeconomic groupings. As a secondary objective, we examined subsequent health outcomes for those with multimorbidity, including mortality, ambulatory sensitive hospitalisations (ASH) and overnight admissions to hospital.
Methods
Study design, setting and participants
This study is a cross-sectional prevalence study of multimorbidity across the NZ adult population, defined at 1 January 2014, using routinely collected, national-level administrative health data. We also examined subsequent health outcomes for the year following this index date. Study size was determined by the total identified population at this index date.
The target study population was all NZ adults (aged 18+), operationally defined as individuals with an active National Health Index (NHI) number, based on active enrolment with a Primary Health Organisation (PHO) or recent interaction with the NZ health system in the year prior to the index date (n=3 489 747). No additional inclusion or exclusion criteria were applied. Further details are given under data sources below. This target population covers the vast majority of New Zealanders (it is estimated that around 94% of the entire population are enrolled with a PHO,22 and so the actual coverage should be in excess of 94% when including additional individuals who meet the recent interaction criteria for an active NHI number).
Patient and public involvement
Patients and members of the public were not involved in the design or conduct of this study.
Data sources
All data were sourced from the national collections as maintained by the NZ Ministry of Health.22 The population denominator and sociodemographic information were derived from the master NHI table. This source includes information on date of birth, sex, ethnicity and place of residence, and can be linked to other national health data using the unique NHI identifier.
Information on long-term conditions was sourced for an extended period prior to the index date from (1) the National Minimum Data Set, which captures all publicly funded hospital discharges in NZ (and some privately funded), with diagnostic information relevant to the admission coded using International Statistical Classification of Diseases 10 codes (ICD-10) and (2) the pharmaceutical collection, which includes all community-dispensed prescriptions across NZ, with medications coded using a modified version of the Anatomical Therapeutic Chemical Classification (ATC) system.23 24 The past hospital discharge data thus provides a measure for the general population of long-term conditions that have been recorded during hospital admissions (over an extended period of 5 years to capture all relevant long-term conditions); while the pharmaceutical data provides a similar measure for the general population (using a 1-year lookback period, assuming that these long-term conditions are under active management). Both data sources use the total adult denominator when calculating rates for the same population.
Long-term conditions were identified using the condition lists developed for the M3 index (for prior hospital discharge data,25 based on all diagnoses recorded for discharges in the 5-year lookback period) and the P3 index (for community pharmaceutical data (see online supplementary table A), based on dispensings in a 1-year lookback period from the index date). Both indices were developed for considering mortality risk in population health analyses, with the individual conditions chosen based on chronicity, expected impact on mortality and other long-term impacts on health. The M3 index includes a total of 61 conditions, with the list of conditions intended to capture long-term conditions known to have some impact on mortality and/or morbidity. The P3 index includes a different, shorter list of 30 conditions, as the underlying pharmaceutical dispensing data can only capture conditions for which pharmaceutical treatment is possible. Furthermore, since some medications are used to treat multiple disparate conditions, it is not always possible to determine the precise condition or indication for a given medication. These medications with multiple common indications were thus excluded in the creation of the P3 index. Both of these indices are described in full detail elsewhere for the M3 index25 and in online supplementary table A for the P3 index, including full details of the exact codes included in their definitions for any condition.
Supplementary file 1
Information on deaths during the follow-up period was drawn from the NZ Mortality Collection.
Variables
Multimorbidity was defined as having at least two conditions from the M3 or P3 condition list. Results are reported separately based on these two different data sources, as the conditions coded by each index do not fully align with each other. In addition to prevalence of multimorbidity, a number of identified conditions are reported using medians and IQR.
Prevalence estimates are reported stratified by several sociodemographic and socioeconomic factors. Age at the index date and sex were defined using information from the NHI master table (age grouped as 18–24, 25–34, 35–44, 45–54, 55–64, 65–74, 75–84 and 85+). Prevalence by broad ethnic groups (Māori, Pacific, Asian, European and Middle-Eastern/Latin American/African/Other (MELAA/Other)) is presented using a modified total ethnicity approach based on self-identified health as recorded in the NHI master table, in line with best practice in NZ health settings.26 Total ethnicity reporting means that individuals who self-identify with more than one ethnic group were counted in both numerator and denominator for each of those groups: to allow some comparison in prevalence estimates, the European group was treated as a mutually exclusive group (ie, containing individuals who only self-identified as NZ European or European). For regression analysis, ethnicity was prioritised so that individuals were only assigned to one group (in the order noted above) following standard practice.26
Socioeconomic status was measured using the NZDep 2013 Index of Deprivation (NZDep index),27 an area-based measure of socioeconomic deprivation produced from relevant information in the NZ census. This was matched to individual’s health records based on their geocoded residential address in the NHI master record: in some cases this information was missing and hence an NZDep score could not be assigned to a person’s record (missing data reported in table 1).
Sociodemographic and socioeconomic description of study population at index date (1January 2014)
We also considered several potential adverse outcomes from multimorbidity during the 1-year follow-up period (1 January 2014 to 31 December 2014). Data were available for all participants across this period. All-cause mortality was considered alongside ambulatory sensitive hospitalisations (ASH admissions) and overnight hospital admissions. ASH admissions were defined based on a primary diagnosis in a specified list28 29 where the admission type was defined as either acute or arranged (ie, excluding elective admissions, except in the case of dental procedures which are always coded as ASH regardless of admission type). Overnight hospital admissions were any admissions that included an overnight stay in hospital, with the exclusion of maternity-related events (defined as any admission with a primary diagnosis ICD code starting with ‘O’).
Statistical methods
Data coding and preparation was conducted in SAS V.9.4 (SAS Institute, Cary, NC); all subsequent analyses were conducted using R V.3.2 (R Foundation, Vienna, Austria).
Prevalence estimates for the NZ adult population are reported at the index date as crude percentages. For reporting of prevalence of multimorbidity stratified by other sociodemographic factors, we directly standardised estimates for each subgroup to reflect the total adult NZ age/sex distribution (as calculated for the entire study population) using R’s epitools package.30 Prevalence for the total NZ adult population is also reported following direct age-standardised to WHO world standard.31
We also compared adverse outcomes (death, ASH and overnight hospitalisation) within 1 year between individuals with and without multimorbidity, again in separate analyses with multimorbidity defined based on hospital diagnosis data or pharmaceutical dispensing data. Risks of outcomes within 1 year of the index date are initially presented as crude and age and sex-standardised risks for each outcome. We also report odds ratios (ORs, from binary logistic regression) comparing the odds of each outcome in models where we sequentially adjusted for confounder variables. The first model for each outcome presents unadjusted ORs; the second model adjusts for age group and sex; the third model additionally adjusts for prioritised ethnicity and the fully adjusted fourth model adds in adjustment for socioeconomic status using NZDep2013 (in quintiles as a categorical variable). Regression analysis was restricted to individuals with complete information on all covariates (complete case analysis).
Sensitivity analysis
To address the impact of missing covariate data (5.8% of individuals missing ethnicity and/or NZDep quintile), we used multiple imputation to examine whether the associations measured in the main analysis could have been biased due to exclusion of individuals with missing data (complete case analysis). Five imputation datasets were created using chained equations32 (using the mice package33 in R). These datasets imputed missing values for ethnicity and NZDep quintile (as polynomial variables) based on all other variables in the analytical model including exposure variables and outcome variables (multimorbidity status, age group, sex, ethnicity, NZDep quintile and all outcome variables). The imputation models also included auxiliary information on each person’s District Health Board of residence (the 20 administrative divisions of the public health system in NZ, which provides additional information on subnational distribution of people by ethnicity and socioeconomic deprivation). Further details on this sensitivity analysis and underlying assumptions are given with online supplementary table B.
Supplementary file 2
Results
Table 1 gives the sociodemographic profile of the 3.49 million NZ adults in the study population at the index date (1 January 2014). Table 2 gives a list of the top 15 condition categories (as single conditions) identified across the population (ie, not just among those with multimorbidity) for both the hospital diagnosis data (based on the M3 index categories) and the pharmaceutical dispensing data (based on the P3 index categories).
Prevalence of top 15 individual condition categories (study group total n=3 489 747) based on hospital admission data (top panel) and pharmaceutical dispensing data (bottom panel)
Prevalence estimates for multimorbidity in the adult population at the index date are also presented in table 1, for definitions of multimorbidity drawing from each of the two data sources (past hospitalisation discharge records and past pharmaceutical dispensing). Across the entire identified NZ adult population, 7.9% of the population were defined as having multimorbidity when using the past 5-year hospital diagnosis data source; prevalence was considerably higher at 27.9% when using the past year pharmaceutical dispensing data source. When age standardised to the WHO standard age structure, these prevalences were 6% and 23%, respectively.
As expected, the prevalence of multimorbidity increased with age for both definitions, as also shown in figure 1. Prevalence of multimorbidity was consistently higher based on pharmaceutical dispensing data compared with hospital admission data, with the difference widening in the older age groups. Multimorbidity based on hospital data was higher for males than females (8.6% and 7.4%, age standardised); while females had higher prevalence based on pharmaceutical dispensing (30.7% compared with 24.8% for males, age standardised). Differences between males and females in patterns of multimorbidity by age are shown in figure 2: the higher prevalence using hospital discharge data among males becomes manifest by the 55–64 age group, while higher prevalence for females compared with males based on pharmaceutical dispensing data was apparent across all age groups.
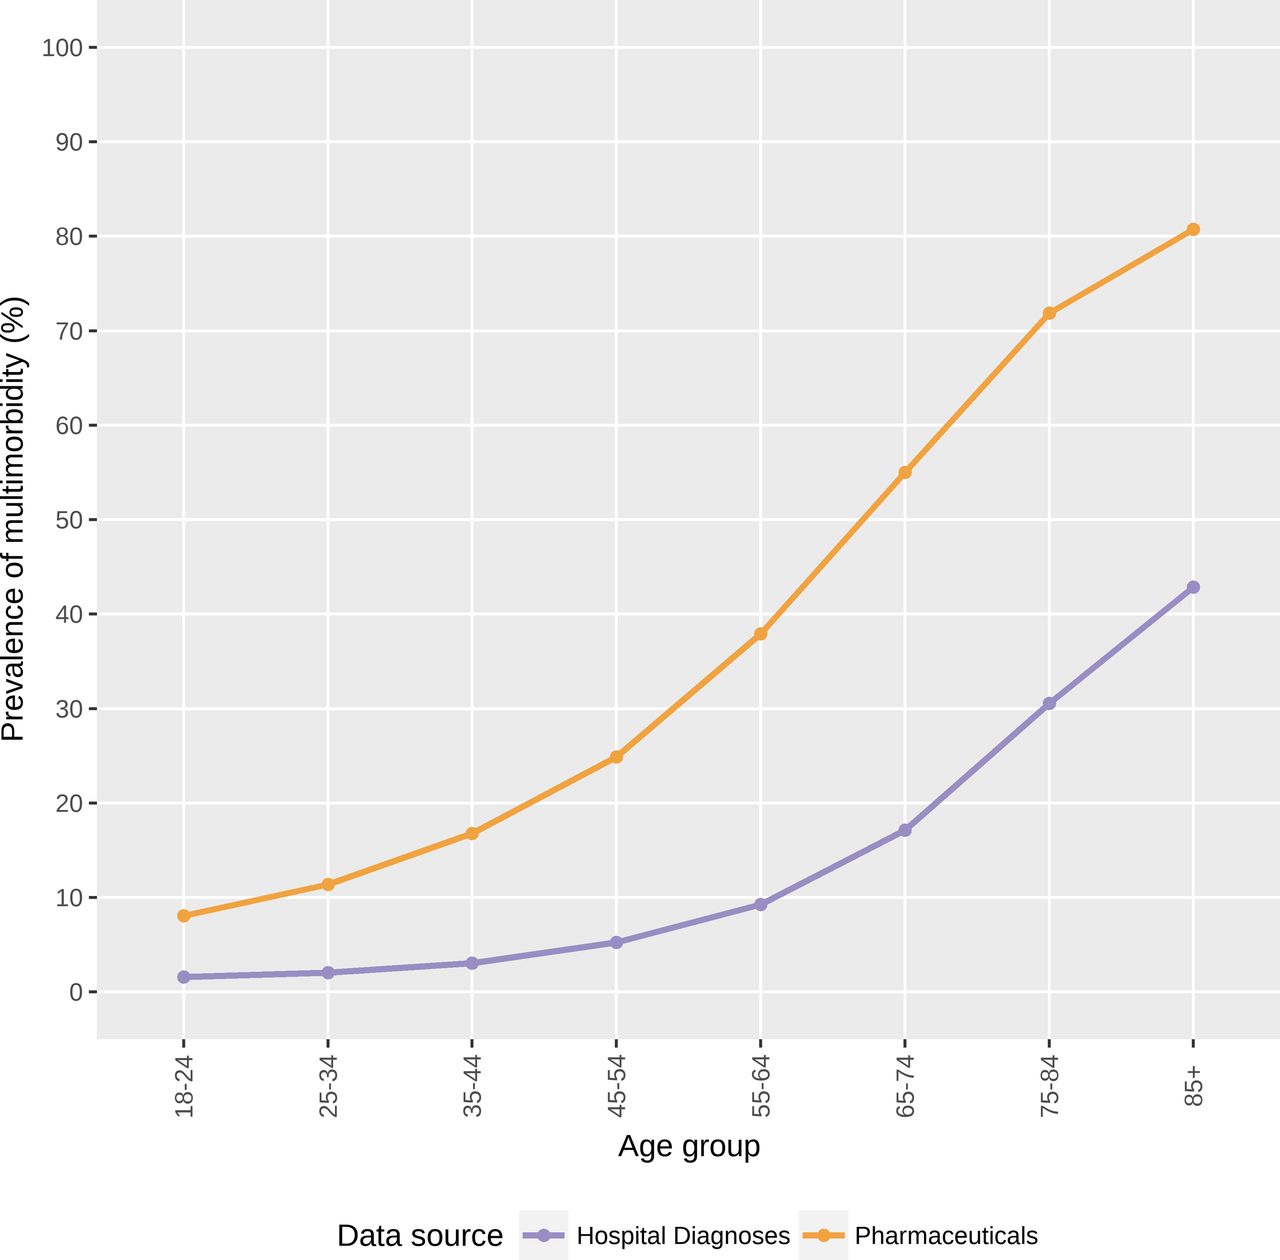
Prevalence of multimorbidity (two or more conditions) by age group, according to hospital discharge diagnosis and pharmaceutical dispensing data sources.

Prevalence of multimorbidity (two or more conditions) by age group and sex, according to hospital discharge diagnosis and pharmaceutical dispensing data sources.
The crude prevalence of multimorbidity based on hospital data (table 1, middle set of columns) was roughly similar across NZ European, Māori and Pacific populations (8.6%–9.3%) and lower for Asian and MELAA/other groups (4.6% and 4.7%). This was partially due to the NZ European group having an older population distribution: following age and sex standardisation, prevalence of multimorbidity was higher for Māori and Pacific ethnic groups (13.4% and 13.8% prevalence, respectively) than for NZ European (7.6% prevalence), and the Asian and MELAA/Other groups (6.9% and 8.7%, respectively) were also more in line with the NZ European prevalence. Figure 3 gives age-stratified estimates of multimorbidity by total ethnicity group, which shows early divergence by ethnicity in younger age groups but relatively similar trajectories of prevalence as age increases.

Prevalence of multimorbidity (two or more conditions) by age group and ethnicity, according to hospital discharge diagnosis and pharmaceutical dispensing data sources. MELAA/Other, Middle-Eastern/Latin American/African/Other; NZ, New Zealand.
Crude ethnic group differences in prevalence based on pharmaceutical dispensing (table 1, right-hand set of columns) were also confounded by age. Crude prevalence appeared relatively high in NZ European (31.6%) compared with the other ethnic groups (19.1%–24.2%), but following age standardisation these differences were less pronounced (prevalence between 29% and 32% for all groups except Asian, with a standardised prevalence of 24.3%). Age-stratified ethnic patterns of multimorbidity based on pharmaceutical dispensing data are shown in figure 3.
Multimorbidity was also more common among those in higher socioeconomic deprivation areas (based on NZDep2013), with standardised prevalence based on hospital diagnoses rising from 5.8% (least deprived quintile) to 10.8% (most deprived quintile); and for pharmaceutical-based definitions from 25.1% (least deprived) to 30.9% (most deprived). These patterns were consistent across the age spectrum (figure 4).

Prevalence of multimorbidity (two or more conditions) by age group and NZDep quintile, according to hospital discharge diagnosis and pharmaceutical dispensing data sources.
Those with multimorbidity were at substantially higher risk of an adverse outcome in the year following the index date (mortality, ASH admission, non-maternity overnight admission). Table 3 gives the crude and age and sex-standardised risk of each adverse outcome by multimorbidity status. Absolute risk was consistently higher across all outcomes for the multimorbidity group based on the past hospital diagnosis definition than for the past pharmaceutical dispensing definition. Figure 5 plots the age and sex standardised risks for each outcome according to multimorbidity status, based on the two data sources.

Age- and sex-standardised risk of mortality (left panel), ambulatory sensitive hospitalisation (ASH) admission (middle panel) and overnight non-maternity admission (right panel) within 1 year of index date, by multimorbidity status (defined based on hospital discharge diagnosis or pharmaceutical dispensing data).
Crude and age-standardised/sex-standardised risk of adverse outcomes within 12 months of index date
Table 4 shows the ORs for each adverse outcome by multimorbidity status, from logistic regression models. Unadjusted estimates (first row of table 4) were largely confounded by age and sex: further adjustment for ethnicity and socioeconomic deprivation (NZDep) had minimal impact on estimates of comparisons by multimorbidity status. All results in the following text are from the complete case analysis for the fully adjusted model (bottom row of table 4).
ORs for increased risk of mortality/hospital admission with multimorbidity (by multimorbidity defined using past hospital discharge or pharmaceutical dispensing data) from unadjusted and adjusted logistic regression models
All three outcomes were substantially more common for those with multimorbidity than those without. While 1-year mortality was just under 1% for the total adult population, those with multimorbidity had around a three to fivefold higher risk of death (fully adjusted OR = 3.9, 95% CI 3.7 to 4.0 for the pharmaceutical dispensing definition; and OR = 4.6, 95% CI 4.5 to 4.7 for the hospital diagnosis definition). Fully adjusted ORs for the ASH and non-maternity hospital admission outcomes also indicated higher risk of hospitalisation for those with multimorbidity: ORs from models using the hospital diagnosis definition were again higher than the corresponding ORs from the models using the pharmaceutical dispensing definition (table 4).
The analyses looking at health outcomes were repeated following multiple imputation for missing data on ethnicity and socioeconomic deprivation (5.8% of cases). As shown in online supplementary table B, adjusted estimates following imputation were not substantially different from the estimates from complete case analysis. For example, for the analysis of mortality risk according to multimorbidity defined on hospital discharge data: complete case analysis OR 4.6 (95% CI 4.5 to 4.7); multiple imputation pooled OR 4.7 (95% CI 4.6 to 4.8). Other estimates from the imputed data analysis were also of similar magnitude to the main results in table 4 (online supplementary table B).
Discussion
These results present the first nationwide report of the prevalence of multimorbidity in nearly 3.5 million NZ adults. Over one-quarter of the adult population of NZ had multimorbidity when defined from pharmaceutical dispensing data in the last year (27.9%), although estimates were consistently lower when based on past hospital discharge data over the previous 5 years (prevalence of 7.9% of all adults). Multimorbidity was more common among older people, those living in areas of higher socioeconomic deprivation, and in Māori and Pacific ethnic groups. People with multimorbidity were at higher risk of subsequent adverse outcomes (death and ASH or overnight hospitalisation) in the 1-year follow-up period, even following adjustment for confounding from age and other sociodemographic factors.
The prevalence estimates for multimorbidity were generally consistent with international results: the pharmaceutical dispensing-based estimate (27.9%) was firmly within estimates of prevalence from those studies that looked at a relatively broad range of age groups from early adulthood—these have typically ranged from 14% to 40%, with most studies reporting a prevalence between 20% and 30%.2 3 Estimates from low-income and middle-income countries have tended to be lower, supporting the hypothesis of epidemiological transition as an important driver in the prevalence of long-term disease,34 though methodological variations may explain this difference. These results are concordant with recent studies in countries with similar population structures. Recent estimates from the USA put multimorbidity in the general population at around 22%–26%, based on record linkage and survey data, respectively.20 35 In Canada, survey estimates from the general population have recently been put as high as 59%36 or as low as 13%.37 For future comparisons, the prevalence estimates following age standardisation to WHO age standard were 6% and 23%, respectively, for definitions based on the hospital discharge and pharmaceutical dispensing data sources.
In Australia, the most recent national population estimates demonstrate a multimorbidity prevalence of around 33%38 using primary care attendance numerators and population denominators. A regional Australian study from New South Wales of adults aged 45 and over found prevalence of 36.1%–37.4%, based on pharmaceutical claims data and survey data, respectively; and a prevalence of 19.3% based on past hospital discharge data.19 Restricting our own data to ages 45 and above returned a prevalence of 42.2% based on pharmaceutical dispensing data, and 13.1% based on hospital discharge data (not shown).
One result of interest for the regression analyses was that there was little change in the magnitude of the associations (between multimorbidity and each health outcome) when adjusting for ethnicity and socioeconomic deprivation (on top of adjustment for age group and sex). This is suggestive that ethnicity and socioeconomic deprivation were not substantial confounders of the association between multimorbidity and subsequent outcomes: it is important to note that the results of the fully adjusted regression models (not presented) indicated that these two factors were independently associated with the outcome, such that there was still evidence for ethnic inequities and a socioeconomic gradient in outcomes.
The key strengths of this analysis include the wide coverage of the NZ population, covering the vast majority of NZ adults engaged with the health system. The classification and coding of conditions in both the hospital discharge and pharmaceutical dispensing datasets also followed well-delineated methods25 that are reproducible across time and different countries. These two data sources provide complementary definitions of what it means to have multimorbidity.
The key weaknesses are discussed below with respect to the utility of these two data sources. It is worth noting that neither the hospital nor pharmaceutical data source perfectly align with the prevalence of multimorbidity that could be determined from primary care interaction data; however, the national coverage and internal consistency of the hospitalisation and dispensing data sources used in this study improve the generalisability and utility of these data sources above what could be discovered from more locally held primary care data sources, and the pharmaceutical dispensing data should provide a reasonable approximation for the prevalence of multimorbidity from primary care data. Unfortunately in NZ, there is no national collation of primary care data from which the prevalence of multimorbidity can be calculated, and so primary care-level definitions of multimorbidity are not feasible at a national level.
A second issue arising from the data sources was missing data for the regression models (which was 5.8% of total group missing ethnicity and/or deprivation measure). While there is no uniform consensus on when the amount of missing cases in a regression analysis is likely to bias results, in methodological work the threshold for considering the impact of missing data typically starts at around 10% of cases having missing data 39 40. Furthermore, regression models for complete cases (ie, those with all covariate data available) that adjust for covariates potentially related to missingness, including exposure and confounder variables, have been demonstrated to be unbiased in comparison to more complex analytical methods41. Our sensitivity analysis using multiple imputation suggested that the adjusted complete case logistic regression results presented in table 4 were not biased compared with using multiple imputation.
The final issue is that the data sources used cover adults defined as being engaged with the NZ health system (either through enrolment with a PHO, estimated to cover around 94% of the population; or having used publicly funded health services in the year prior to the index date). It is only possible to speculate about those individuals who are not covered in these data sources: however, we do know that they will not have been in contact with health services in the period used to define multimorbidity, and hence would not be able to meet the operational definitions of multimorbidity used in this study (as these are based on hospital admissions and pharmaceutical dispensing).
The difference in prevalence estimates when using hospital admission and pharmaceutical dispensing data sources has implications for future research and planning. Using past hospital admission data identifies a smaller group of individuals with multimorbidity, but this group is at particularly elevated risk of subsequent poor outcomes (following adjustment for confounders like age and sex). This is highly suggestive of a more severe level of multimorbidity, which may be additionally captured in other analyses by accounting for recent hospital admission as a separate risk factor variable. The appropriate choice of data source for considering multimorbidity based on routine data will ultimately depend on both data availability and the study question being addressed. The two systems also differ regarding the most commonly captured conditions: as one key example, mental health conditions were considerably more prominent when using the pharmaceutical definition than the hospitalisation definitions.
The number of long-term conditions used in defining multimorbidity is known to impact on the measured prevalence: a systematic review recommended a minimum of 12 conditions to facilitate comparable estimates across studies.3 The conditions included in the current study were selected as reflecting long-term conditions with some impact on subsequent serious health outcomes,25 and as such the definition of multimorbidity used here strikes a balance between the number of conditions considered and the severity of their impact.
The two indices also included different numbers of long-term conditions (61 for the hospital discharge definition; 30 for the pharmaceutical dispensing definition). Including a higher number of conditions should generally increase the recorded prevalence of multimorbidity, as there are more conditions that can be included in the definition: this was not the case in the current study, however, due to the nature of the data sources. To be coded as having multimorbidity based on the past hospital discharge data required at least one prior hospital admission in the past 5 years (with two or more different long-term conditions recorded across these admissions); whereas to be coded with multimorbidity based on the pharmaceutical dispensing data only required dispensings of medications for at least two long-term conditions in the past year. Thus, the definition based on past hospital discharge data sets a higher threshold for defining multimorbidity, and identifies people with multimorbidity who are at higher risk of subsequent poor health outcomes, as noted above.
While a pharmaceutical dispensing definition sits closer to primary care-level definitions of multimorbidity, determination of long-term health conditions from pharmaceutical data is limited in that (1) some medications are used to treat different conditions and (2) not all long-term health conditions might require or respond to pharmaceutical treatment. On top of this, cost-related factors that restrict the ability to access primary healthcare consultations and/or pay for prescriptions42 mean that pharmaceutical dispensing-based definitions may underestimate the prevalence of multimorbidity in socioeconomically deprived groups. Conversely, the number and breadth of diagnoses recorded on hospital discharge records are dependent on several factors, including the primary reason for the admission, requirements for reporting of health conditions in specific jurisdictions, and the quality of recording of information both by attending medical staff and clinical coders.43 44
Other studies comparing different designs or data sources for estimating prevalence of multimorbidity have reported higher prevalence when the denominator comprises those currently receiving care or medication, compared with when denominators are based on registered patients or the general population.3 35 Recent studies from Quebec and Australia have suggested a 10%–15% higher prevalence (respectively) when using a denominator based on primary care attendees rather than a general population denominator36 38; and another study suggested higher prevalence when using health survey methods compared with examining electronic health records.45 A recent Australian study that linked survey data (for ages 45 plus) with routine pharmaceutical and hospitalisation data returned comparable prevalence estimates between survey and pharmaceutical data sources (37.4% and 36.1%), which were both around 17% points higher than prevalence estimated using hospital data (19.3%).19
There are important equity considerations that arise from the patterning of multimorbidity by age, ethnicity and socioeconomic status, especially considered in conjunction with this group’s increased risk of subsequent hospital admission or death within the 1-year follow-up period. The higher prevalence of multimorbidity in the Māori and Pacific populations also raises issues of equity in health outcomes: as such, interventions in NZ that aim to prevent multimorbidity or improve outcomes for those with multimorbidity need to consider the equity impacts of such interventions.46 While these prevalence results are specific to NZ, we expect that patterning of multimorbidity by sociodemographic profile and the adjusted estimates for increased risk of poor health outcomes with multimorbidity should be generalisable to other countries.
Conclusions
Multimorbidity is common among NZ adults, with older people, Māori and Pacific ethnic groups and the socioeconomically disadvantaged having higher prevalence (on both of the measures used). Pharmaceutical dispensing data should give a better proxy for the prevalence of multimorbidity that could be determined from primary care-level data sources compared with using past hospital admission diagnosis data, although these estimates may be subject to bias arising from differential access to healthcare and pharmaceuticals between different population groups (eg, by ethnic groups).
Looking more broadly at the health system, these results support calls to consider the existence of multimorbidity in the design of health services, which requires a continued shift from management of individual diseases to care of the whole patient.8 9 47 The impact of an ageing population (and hence higher numbers of people with multimorbidity) combined with the substantial costs of providing healthcare for people with multimorbidity5 14 15 will also present a major challenge to the sustainability of healthcare systems. This has important implications for both planning health services to improve management for those who are already unwell, but perhaps more importantly for justifying appropriate targeting of interventions aimed at preventing long-term conditions.7
Acknowledgments
We would like to thank Jane Zhang (MSc, University of Otago, Wellington) for her help in developing the SAS code to sort and count clinical conditions; and the Ministry of Health for supplying the data used in this study. We would also like to acknowledge the input of our wider C3 research group and multimorbidity project team, especially those clinicians who provided initial feedback on processes for identifying conditions.
References
Footnotes
Contributors DS and JS conceived and obtained funding for the study. JS designed and conducted the analyses, had full access to all of the data in this study and took complete responsibility for the integrity of the data and the accuracy of the data analysis. DS, KS and EM contributed to the interpretation of the results. JS drafted the manuscript. All authors revised the manuscript for publication and approved the final version.
Funding This work was supported by the New Zealand Health Research Council grant number HRC 14/173.
Competing interests JS, KM, EM, and DS report grants from Health Research Council of New Zealand during the conduct of the study.
Patient consent Not required.
Ethics approval Ethical approval was given by the University of Otago Human Ethics Committee (Health) at the start of the study (HD14/29).
Provenance and peer review Not commissioned; externally peer reviewed.
Data sharing statement Data for this study were provided by the New Zealand Ministry of Health (reference number: 2017-0609) following ethical approval, and may be available to other researchers who meet data access requirements. Code for data processing and analysis is available from the first author (JS) on request.