Article Text

Abstract
Objectives When monitoring patients over time, clinicians may struggle to distinguish ‘real changes’ in consecutive blood parameters from so-called natural fluctuations. In practice, they have to do so by relying on their clinical experience and intuition. We developed Labtracker+, a medical app that calculates the probability that an increase or decrease over time in a specific blood parameter is real, given the time between measurements.
Design We presented patient cases to 135 participants to examine whether there is a difference between medical students, residents and experienced clinicians when it comes to interpreting changes between consecutive laboratory results. Participants were asked to interpret if changes in consecutive laboratory values were likely to be ‘real’ or rather due to natural fluctuations. The answers of the study participants were compared with the calculated probabilities by the app Labtracker+ and the concordance rates were assessed.
Setting and participants Medical students (n=92), medical residents from the department of internal medicine (n=19) and internists (n=24) at a Dutch University Medical Centre.
Primary and secondary outcome measures Concordance rates between the study participants and the calculated probabilities by the app Labtracker+ were compared. Besides, we tested whether physicians with clinical experience scored better concordance rates with the app Labtracker+ than inexperienced clinicians.
Results Medical residents and internists showed significantly better concordance rates with the calculated probabilities by the app Labtracker+ than medical students, regarding their interpretation of differences between consecutive laboratory results (p=0.009 and p<0.001, respectively).
Conclusion The app Labtracker+ could serve as a clinical decision tool in the interpretation of consecutive laboratory test results and could contribute to rapid recognition of parameter changes by physicians.
- medical application
- biological variation
- medical education
This is an Open Access article distributed in accordance with the Creative Commons Attribution Non Commercial (CC BY-NC 4.0) license, which permits others to distribute, remix, adapt, build upon this work non-commercially, and license their derivative works on different terms, provided the original work is properly cited and the use is non-commercial. See: http://creativecommons.org/licenses/by-nc/4.0/
Statistics from Altmetric.com
Strengths and limitations of this study
This study describes an objective scientific approach of distinguishing a ‘true change’ from a ‘random fluctuation’, when interpreting a change between two consecutive laboratory measurements.
Using the app Labtracker+ could be useful in reducing information overload and enabling rapid recognition of parameter changes by expert clinicians.
The database that was used to develop the app Labtracker+ presently contains only a limited number of laboratory parameters.
The cases we used to compare the concordance rates between Labtracker+ calculations and clinicians’ estimates were not presented in random order.
Introduction
Medical doctors frequently monitor the laboratory results of patients to determine whether their condition is stable, improving or deteriorating and to decide whether treatment should be continued, initiated or rather be postponed. Hence, an intuitive ‘reference frame’ of the patient can be formed by repeated assessment of laboratory parameters. An expertise-based reference frame is often lacking in less experienced clinicians, such as medical residents or medical students. Hence, it can be difficult for less experienced clinicians to distinguish natural fluctuations in laboratory results from ‘real changes’ and vice versa.
According to a study of Jones et al, one in five medical graduates identified themselves as being ‘less than competent’ in using laboratory testing.1 Additionally, a study of Hickner et al demonstrated that even experienced clinicians reported uncertainty in interpreting laboratory test results in approximately 10% of the ordered laboratory tests.2
To help (inexperienced) clinicians to make the distinction whether a change between measurements is real or not, we developed a medical app (Labtracker+), that calculates the probability of a ‘real change’ between two consecutive laboratory results. It is simple to use in clinical practice and provides evidence-based decision support to complement intuitive interpretation of changes in consecutive laboratory results.
The current study tests the hypothesis that experienced clinicians show better concordance rates with Labtracker+-based calculations than medical students and less experienced clinicians.
Methods
This study was approved by the Dutch Association for Medical Education (NVMO). Study participants provided written informed consent.
Study participants
A total of 135 participants were included: 92 medical students, 19 medical residents and 24 medical specialists. We scheduled 6 days on which medical students participated in our study. All students were at the same stage of their internship and 92% of them were in their first medical internship (usually in their fourth year of the 6 years training to become a medical doctor in the Netherlands). The medical residents and medical specialists, all employed at the department of internal medicine at Maastricht University Medical Centre, were recruited during the daily morning briefing. The mean number of clinical experience years was 24±9 for the internist and 3.5±2 for the residents.
Exclusion criteria were: medical students in the bachelor phase of their studies and residents or specialists of a specialty other than internal medicine.
Study design
Ten fictive clinical cases were presented to the study participants. These cases were conceived and developed by the authors of this article. Central to each case was to interpret the likelihood of change between consecutive measurements of a certain laboratory parameter. The time interval between the measurements varied for all cases. The cases can be found in the supplementary material.
Supplementary file 1
The participants were asked to categorise the presented changes in one of the four likelihoods: ‘unlikely’ (<50%), ‘doubtful’ (50%–80%), ‘probably’ (80%–95%) and ‘very likely’ (>95%). Participants answered these questions individually. The extent to which the responses of the participants were in accordance with the calculated probabilities by the app Labtracker+ was analysed.
The laboratory parameters that were incorporated in the cases were: haemoglobin, leucocytes, thyroid stimulating hormone (TSH), vitamin B12, alanine aminotransferase, glucose, glycosylated haemoglobin type A1c (HbA1c), creatinine, activated partial thromboplastin time (aPTT) and C reactive protein.
Statistical analysis
All answers given by the study participants were compared with the calculated probabilities by the app Labtracker+. Two statistical analyses were performed. First, differences among the study groups were calculated using one-way analysis of variance. p Values<0.05 were considered statistically significant. Comparisons between pairs of groups were adjusted for multiple testing using the Bonferroni correction.
Second, two groups were compared; the medical students formed the ‘inexperienced group’ and the medical residents and internists together formed the ‘experienced group’. The two groups were compared using the Fisher’s exact test. All statistical calculations were performed using SPSS version 23 (IBM SPSS Statistics, Armonk, New York, USA).
Calculating the probability of change using the app Labtracker+
For a change between consecutive measurements to become significant, the difference must be larger than the change that would reasonably be expected due to normal analytical and biological variation. This is termed the reference change value (RCV) and was first described by Fraser et al.3 The RCV has become an established concept in laboratory medicine.
The RCV differs for each parameter and depends on the within-subject biological variation (CVI) and the analytical variation (CVA) and can be calculated as follows:4 5

In this formula, the Z-score represents the number of SD and corresponds to the desired probability. Commonly used Z-scores are 1.96 and 2.56. These Z-scores calculate the percentage increase or decrease that is required to become statistically significant, with a false positive rate of 5%, (p<0.05) and 1% (p<0.01), respectively.
An important side note to calculate the RCV is that not all clinical decisions are made with statistical probabilities of >95%. In other words, some changes are strictly not statistically significant, but the probability may be high enough to lead to a treatment or clinical decision. For example, a haemoglobin concentration of 6.1 mmol/L was measured in a male patient. After a week, it dropped to 5.8 mmol/L. Although the likelihood probability of a 'real' decrease in haemoglobin level is less than 95% in this case—namely around 70%—the clinician may still decide to use additional diagnostic testing or to treat the patient.
For implementation in the smartphone app, we rearranged the RCV formula so that the Z-score (and therefore the likelihood probability) is the unknown. The probability of a real change between consecutive measurements will then be calculated. The rearranged RCV formula is:

The calculations of the app Labtracker+ are based on the above formula. This makes it possible to compare two consecutive laboratory results and to calculate the probability of a real change.
Time-dependency of within-subject biological variation in some parameters
In a number of laboratory parameters, the within-subject biological variation (CVI) changes over time. We systematically reviewed published biological variation studies of 106 laboratory tests and found a time-dependent increase of the biological variation for 21 parameters. For the laboratory parameters with sufficient information about their biological variation in the scientific literature, the associations between biological variation data and the time interval to which they apply were modelled statistically and integrated into Labtracker+. This enabled the calculation of probabilities of a change between measurements, while accounting for the time-span between consecutive measurements.
Practical functionality of the app Labtracker+
In total, 106 parameters are available in Labtracker+. When using the app, users can choose the desired parameter out of a list that is displayed in alphabetical order. Subsequently, they have to choose the ‘body liquid’ in which the measurements were performed and, if relevant, whether the blood sampling regards a male or a female person. However, this question is asked only to display an indication of the reference values, but it does not affect the final calculation of the probability. Then the user fills in the previous and the recent value as well as the time interval in days between the measurements. Also, the ‘a priori expectation’ of the change between the measurements has to be chosen (‘rise’ for an expected increase, ‘fall’ for an expected decrease or ‘either’ when there is no prior expectation). Labtracker+ will then calculate the probability that the change between the two measured values is a ‘real change’. In figure 1, screenshots of the app were presented to visualise the functionality of the app.

Screenshots of the app Labtracker+.
For a more detailed description of the practical use of Labtracker+, see the user manual on the website (http://www.labtracker.info).
Results
Data collection was incomplete for two subjects (1.5%); it concerns two medical students who did not fill in all questions and therefore, they were excluded from all analyses.
Psychometric analysis
We performed the ‘Item Test Correlation (RIT)’ test, a psychometric analysis to check the distinctiveness of the case questions.6 7 Briefly, the RIT is a correlation coefficient which can vary between −1 and 1; a question with a RIT score of 0 does not distinguish between good and poor performers. If the RIT score is negative then the question may not be valid and should be removed.6 7 The RIT score of the aPTT-question had a negative value and therefore, this question was excluded from further analyses. The RIT score of the other questions were all considered sufficient.
Comparison of the app Labtracker+ with the estimates of physicians
The correct answer was defined as the answer that matched exactly with the calculated probability by the app Labtracker+, that is, the answer category containing the calculated probability percentage.
In figure 2, the estimates of the study groups were shown. Participants with extensive clinical experience showed higher concordance rates with Labtracker+−calculations, with internists and the medical residents scoring significantly better than the medical students (p<0.001 and p=0.021, respectively). The percentage of questions answered correctly by the medical residents did not differ significantly from the internists (p=0.719; 95% CI −5.4 to 15.5).

Percentage concordant answers per group. Values are mean percentages ± SD. Medical students versus internists, p<0.001; 95% CI 6.96 to 22.59, medical students versus medical residents, p=0.009; 95% CI 1.10 to 18.28, medical residents versus internists, p=0.321; 95% CI −5.36 to 15.53 . p Values<0.05 were considered statistically significant (*).
A sensitivity analysis was conducted that allowed a broader range to define concordant answers. In this sensitivity analysis, the answer category that matched exactly with the calculated probability by Labtracker+ and the answer category adjacent to that category were both considered correct. The results of this analysis are shown in figure 3. On average, the medical students answered 69% of the questions correctly, the medical residents 78% and the internists 81%. Similar to the primary analysis, concordance rates of answers from internists with the Labtracker-calculated probabilities were significantly better than medical students (p<0.001; 95% CI 4.7 to 19.0). Again, the difference between medical residents and medical students was statistically significant as well (p=0.020; 95% CI 1.1 to 16.8). And, like the first analysis, concordance rates between the medical residents and Labtracker+ did not differ significantly from the internists (p=1.000; 95% CI −12.5 to 6.6). Therefore, in subsequent analyses, internists and medical residents were pooled as one group (the experienced clinicians) and compared with medical students.
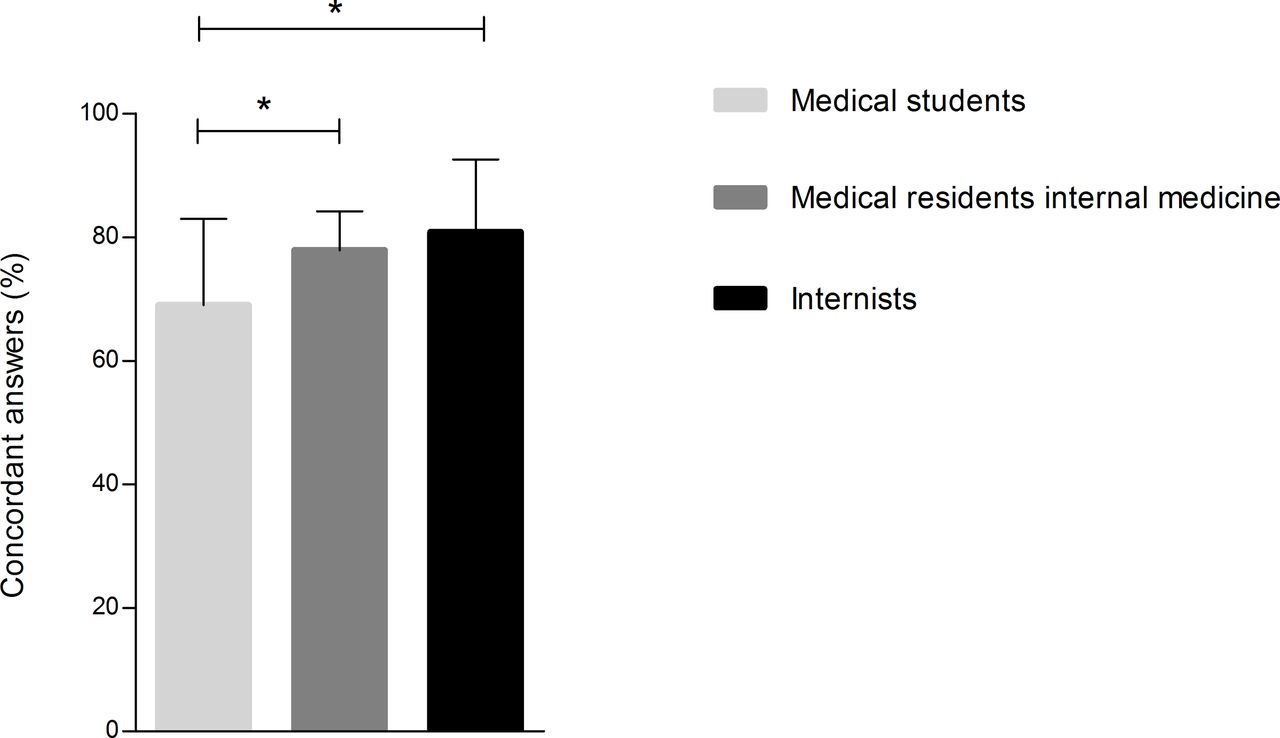
Percentage concordant answers when also the probability adjacent to the designated category was considered correct. Values are mean percentages ± SD. Medical students versus internists, p=0.007; 95% CI 4.72 to 19.00, medical students versus medical residents, p=0.031; 95% CI 1.07 to 16.76, medical residents versus internists, p=0.609; 95% CI −5.36 to 15.53 . p Values<0.05 were considered statistically significant (*).
Analysis per parameter
The scores of the study participants for each parameter were assessed separately. Figure 4 depicts the percentage of correct answers from the study groups per parameter. The experienced group (the residents and the internists) was compared with the medical students. In general, the experienced group demonstrated the most concordant answers compared with the inexperienced medical students. The experienced physicians scored best on the parameter haemoglobin (95%) and the parameter they scored the worst on was creatinine (28%). The medical students scored best on the haemoglobin parameter as well (82%). They scored worst on the TSH question (6%).

Percentage concordant answers per parameter. TSH: p<0.001, creatinine: p=0.012, vitamin B12: p=0.024, HbA1c: p=0.036, haemoglobin: p=0.056, ALAT: p=0.237, leucocytes: p=0.307, glucose: p=0.462, CRP: p=0.574. In this figure, the medical residents and the internists were combined into the group ‘clinicians with experience’. ALAT, alanine aminotransferase; CRP, C reactive protein; HbA1c, haemoglobin type A1c; TSH, thyroid stimulating hormone.
In accordance with the previous analysis, we conducted a sensitivity analysis in which the category adjacent to the correct answer was also considered to be correct. These results are shown in figure 5. Again, the experienced physicians gave the most concordant answers. In this analysis, the experienced group (residents and internists) scored 88% correct answers on average. They scored the best on the vitamin B12, leucocytes and haemoglobin questions (98%). The TSH question was the least well answered of all parameters (70%). The medical students scored 90% correct answers on the haemoglobin question. The least concordant question by the students was TSH (44%).

Percentage concordant answers per parameter when also the probability adjacent to the designated category was considered correct. Vitamin B12: p=0.002, TSH: p=0.006, leucocytes: p=0.012, haemoglobin: p=0.167, creatinine: p=0.012, ALAT: p=0.221, glucose: p=0.329, HbA1c: p=1.000, CRP: p=1.000. In this figure, the medical residents and the internists were combined into the group ‘clinicians with experience’. ALAT, alanine aminotransferase; CRP, C reactive protein; HbA1c, haemoglobin type A1c; TSH, thyroid stimulating hormone.
Discussion
The current study demonstrated that experienced clinicians show better concordance rates with the calculated probabilities by the app Labtracker+ than less experienced medical students. Stratified analyses reveal that this pattern holds true for the majority of studied laboratory parameters. Concordance rates with the app demonstrate an incremental improvement from medical students to residents and internists. The differences between clinicians with experience (internists and residents) and inexperienced medical students were statistically significant. This outcome illustrates the relevance and added value of the medical app Labtracker+.
The clear association between the degree of clinical experience and improved concordance rates with the calculated probabilities by the app supports the validity of Labtracker+ calculations. Improved concordance rates with increasing clinical experience suggest that Labtracker+ may well be of benefit for less experienced clinicians, such as medical students.
However, Labtracker+ is not only a useful tool for inexperienced clinicians. We believe the app can form a ‘bridge’ between laboratory science and clinical practice. Labtracker+ could be useful in reducing information overload and enabling rapid recognition of parameter changes by expert clinicians, especially in time-constrained and rapidly changing environments (eg, intensive care units). Clinicians do not have to make cumbersome calculations when estimating whether a change between consecutive measurements is a real change or not. By using the app, the quality of the laboratory information that often plays an important role in clinical decisions will improve. Labtracker+ enables clinicians to make efficient and standardised interpretations with minimal cognitive effort. Of course, the application will never replace clinical judgement, but it can serve as a supportive aid for diagnosis and treatment.
In addition, in current clinical practice, some clinical tasks that were always performed by physicians now more and more become the responsibility of physician assistants or nurse specialists. Such ‘shifts of tasks’ can be for instance, a diabetic nurse who monitors the routine diabetic check-ups. In 2014, Lenters-Westra et al demonstrated that there are significant differences in interpretation of changes in HbA1c results between physicians and nurses.8 Labtracker+ may serve as a useful support to standardise care in such a situation.
The benefit offered by the app may be parameter-dependent. According to this external validation study, the concordance rates with the calculated probabilities varied from 6% for students for the TSH question to 98% for experienced clinicians for the haemoglobin question. This difference in concordance rates suggests that the ‘number intuition’ of a clinician differs per laboratory parameter and varies with clinical experience. It may be difficult for a clinician to estimate how a ‘normal value’ of a parameter fluctuates over time in an individual if the clinician has little actual experience with that parameter. In other words, a clinician with more experience in interpreting a specific parameter can better estimate its biological variation. Since the scores of the medical residents were not significantly different from those of the internists, it might be assumed that medical residents develop their ‘number intuition’ early in the residency training.
The participants scored not all parameters equally concordant. A potential explanation for the ‘worse scored questions’ could be that not all laboratory parameters are widely used in clinical practice and that clinicians therefore have little experience in interpreting those parameters. Another potential explanation could be that not all questions were of equal difficulty.
Some limitations in the current study merit attention. First, the groups of medical residents and specialists were relatively small (n=19 and n=24, respectively). Second, only nine parameters were tested, with one single interpretation per parameter. However, our estimation is that the study groups are a good reflection of the total population of people in these groups. In addition, the parameters we studied are commonly used in clinical practice and cover a broad range of clinical domains. Therefore, it can reasonably be expected that the results of this study can be generalised to all commonly used laboratory parameters. Third, the cases were not presented in random order to the subjects. It is possible that the subjects’ performances were partially influenced by the order of case presentation. However, if there were a learning curve, then this should be the same for all three study groups.
Fourth, it remains unclear whether the use of the medical app Labtracker+ would affect clinical decision-making. In that respect, a study that incorporated medical decision-making, based on hypothetical cases involving laboratory test result interpretation(s), would be an interesting addition. The hypothesis that could then be tested is whether inexperienced clinicians make the same decisions as more experienced clinicians when they use the app Labtracker+.
In 2014, Abbot et al demonstrated that the self-assessed knowledge about interpreting laboratory results of inexperienced medical residents significantly improved after receiving an educational programme about ‘the basics of laboratory test ordering and interpretation.9 This finding endorses the importance of education for inexperienced clinicians. Elaborating on this, it would be interesting to investigate whether Labtracker+, as an educative aid, could provide better medical decision-making.
In conclusion, the current study has provided insight into the intuition of medical students with hardly any clinical experience, clinicians with some experience (medical residents from the department of internal medicine) and experienced clinicians (internists), when interpreting a difference between consecutive laboratory results The findings suggest the existence of a trend that the ‘number intuition’ of a clinician improves with more years of experience. The development of this intuition fosters a better interpretation of laboratory results and could possible improve clinical decision-making. In that sense, the use of the medical app Labtracker+ can be a useful tool, especially for inexperienced clinicians. Besides, Labtracker+ could be useful in reducing information overload and enabling rapid recognition of parameter changes by expert clinicians.
Footnotes
Contributors Concept and design of the study, interpretation of the data and drafting of the manuscript: JMH, SJRM and RPK. Statistical analysis: JMH. Critically revising the manuscript and providing important intellectual content: RJMWR, FHMV and OB.
Funding This work was supported by an Academic Incentive Research Grant from Maastricht University Medical Center+ to Dr Meex.
Competing interests Labtracker+ was conceived and developed by JMH, RPK, RJMWR and SJRM. It is a free medical app and therefore financial interests do not apply.
Ethics approval Dutch Association for Medical Education (NVMO).
Provenance and peer review Not commissioned; externally peer reviewed.