Article Text

Abstract
Objectives Few studies have explored the impact of neighbourhood socioeconomic status (SES) on health behaviours in youths in Germany. Our aim was to investigate the association of individual and neighbourhood SES with physical activity (PA) and screen time (ST) in students aged 12–13 years in Berlin.
Design Cross-sectional study.
Setting Secondary schools (high schools and integrated secondary schools) in Berlin, Germany.
Participants A total of 2586 students aged 12–13 years (seventh grade).
Main outcome measures Sociodemographics, anthropometric data and health behaviours were assessed by self-report during classes. Primary outcome was the association of individual and neighbourhood SES with meeting daily PA and exceeding daily ST recommendations. Students’ characteristics were described with means or percentages. Comparisons were performed using generalised linear mixed model yielding ORs with 95% CIs.
Results Mean (±SD) age was 12.5±0.5 years, 50.5% were girls and 34.1% had a migrant background. When adjusting for individual covariates, associations of low versus high individual SES were 0.85 (0.48; 1.52) for PA and 2.08 (1.26; 3.43) for ST. Associations of low versus high neighbourhood SES were 1.76 (1.12; 2.75) for PA and 1.54 (1.10; 2.17) for ST. After additional adjustment for school type and school neighbourhood SES, associations comparing low versus high individual and neighbourhood SES were attenuated for PA (individual SES 0.74 (0.41; 1.33) and neighbourhood SES 1.51 (0.93; 2.46)) and ST (individual SES 1.88 (1.12; 3.14) and neighbourhood SES 1.40(0.98; 2.00).
Conclusions Lower individual and neighbourhood SES were associated with higher ST. Lower neighbourhood but not individual SES was associated with higher PA. After consideration of school type and school neighbourhood SES associations were attenuated and became insignificant for the relationship between neighbourhood SES, PA and ST. Further research is warranted to unravel the complex relationships between individual SES, neighbourhood SES and school environment to develop more targeted health promotion strategies in the future.
- epidemiology
- community child health
- preventive medicine
- public health
- sports medicine
- social medicine
This is an Open Access article distributed in accordance with the Creative Commons Attribution Non Commercial (CC BY-NC 4.0) license, which permits others to distribute, remix, adapt, build upon this work non-commercially, and license their derivative works on different terms, provided the original work is properly cited and the use is non-commercial. See: http://creativecommons.org/licenses/by-nc/4.0/
Statistics from Altmetric.com
Strengths and limitations of this study
This study provides important new insights into the association of individual and neighbourhood socioeconomic status (SES) with physical activity (PA) and screen time (ST) among seventh grade boys and girls attending secondary schools in Berlin, Germany.
The study comprises a large sample with students recruited from all 12 districts of Berlin, including a variety of neighbourhoods with different levels of SES.
PA was not assessed objectively but via self-report and only ST was assessed, while other types of sedentary behaviours were not taken into account.
Introduction
Physical activity (PA) as well as sedentary behaviour have an important impact on health and well-being.1 Low levels of PA are associated with higher health risks already among children and adolescents2 and an increasing number of studies have identified sedentary behaviour as an independent risk factor for diseases such as diabetes and obesity in children and adolescents.3
In the last decades, however, sedentary behaviour among children and adolescents is increasing while the rates of children being active appear to be decreasing over time.4–7 In addition, longitudinal studies have shown a decline in PA and at the same time an increase in sedentary behaviour among children and adolescents with increasing age.8–10 Screen time (ST) (time spent watching TV or playing games on the computer or playing video games) is one important aspect of sedentary behaviour, even though it does not encompass the total time spent being sedentary.11
While there is evidence of an association of age and sex with PA,12 studies exploring the influence of socioeconomic status (SES) and built and social environment of children show heterogeneous results.13–16
A low individual SES is often associated with a higher body mass index (BMI) and more sedentary time, but not always with low PA.17–19 In addition to individual SES, studies investigating the social environment (ie, social support and social networks, socioeconomic position and income inequality, racial discrimination, social cohesion and social capital) of children found evidence of an association with PA and diet.20–22 The built environment has also been shown to be associated with PA among children and youth.23
Another aspect of the social environment is the neighbourhood SES. Studies investigating the influence of neighbourhood SES on health showed an association of disadvantaged neighbourhoods with worse health status24 or a higher risk for cardiovascular diseases.25 Mechanisms through which a lower neighbourhood SES may influence PA and sedentary behaviour could be reduced municipal services such as recreational facilities and playgrounds, financial stress or less possibilities to own a gym membership.22 Also, a higher crime rate may lead to less activities outside.26 With regard to these associations between PA, sedentary behaviour and the neighbourhood SES, study results are heterogeneous ranging from no association to a clear association.27–30 Other studies in turn found that the neighbourhood SES was only a positive modifier for the association of environmental factors with PA and sedentary behaviour.31 32 Knowing more about independent associations of individual and neighbourhood SES could help to address groups of adolescents in a more targeted way when implementing prevention strategies (eg, adapting the content of health promotion strategies to different neighbourhoods).
Our aim was therefore to investigate the association of individual and neighbourhood SES with PA and ST as one important form of sedentary behaviour in a population-based sample of boys and girls aged 12–13 years attending secondary schools in Berlin, Germany.
Methods
Study design and setting
The present cross-sectional analysis is part of the BEST-prevention study, a three-armed cluster randomised controlled trial that was conducted from 2010 to 2014 (baseline assessment was conducted from 2010 to 2011) with the aim to evaluate a parent involving smoking prevention programme for seventh grade students in Berlin.33 Here, we report cross-sectional data regarding PA and ST among the students at baseline including associations with individual and neighbourhood SES.
Participants and recruitment
Details of the recruitment are described elsewhere.34 Briefly, prior to recruitment, permission of the Berlin senate of education, youth and research (Senatsverwaltung für Bildung, Jugend und Wissenschaft) was obtained, and school principals and contact teachers from all 12 districts of Berlin were informed about the project. Students were eligible for the study if they: (1) were in the seventh grade, (2) attended one of the participating schools and (3) showed intellectual and physical ability to make an informed decision about study participation. Separate signed written informed consent was required from participating students as well as from at least one parent/caregiver. The study was approved by the ethical review committee of the Charité-Universitätsmedizin Berlin, Germany.
Measurements
The study questionnaire is based on existing and validated questionnaires investigating adolescent health behaviour (eg, Health Behaviour in School-Aged Children, HBSC35; German Children and Youths Survey, KIGGS).36 It includes questions related to sociodemographics, smoking and other health behaviours, such as alcohol consumption, nutrition, PA and ST, as well as height and weight. It took about 30–40 min to complete the questionnaire. Our study group has the status of an associated project of the HBSC.
During a first visit to schools, the BEST study was presented to the students by trained research personnel and consent forms were distributed for students and parents/caregivers. During the second visit, which took place a few weeks later, baseline data were assessed with the questionnaire in the classroom among children, who had provided both consent forms.
Outcome measures
Physical activity
PA was assessed using two adapted items of the HBSC questionnaire. The first question read: ‘On how many days in the past week were you physically active for at least 60 min?’ According to WHO guidelines, for our primary outcome we defined a student as meeting current guidelines if he or she was active at least 60 min on each of the last 7 days (yes/no).37 The other question asked for the number of hours of moderate intensity PA per week (‘How many hours per week are you physically active (any activity that increases your heart rate and makes you get out of breath)?’) with examples of such activities. This number was divided by seven to obtain the number of hours of PA per day.
Screen time
ST was assessed with two questions (also part of the HBSC questionnaire) asking for the time spent each day watching TV or playing with the computer. TV time was assessed by asking ‘How many hours/day do you usually watch television in your free time?’ for weekdays and weekend days separately. Computer time (minutes/day) was assessed by asking ‘How many hours/day do you usually play games on a computer, or use a game console in your leisure time?’. Total ST was computed by adding up TV and computer time. Using a smartphone or tablet was not assessed. According to the AAP38 recommendations, we defined more than 2 hours of ST per day as high ST.
Covariates
Individual level
Sex, age and anthropometric data (height and weight) of the students were assessed via self-report. The BMI was calculated using the self-reported data. BMI categories are presented using cut-offs defined by the specific percentiles which at age 18 years correspond to the adult cut-off points for underweight (<18.5 kg/m2), overweight (25 kg/m2) and obesity (30 kg/m2). According to that definition, underweight is defined as a BMI <10th percentile, normal weight as a BMI between the 10th and the 90th percentile, overweight as a BMI between the 90th and the 97th percentile and obesity as a BMI ≥97th percentile.39 40
According to official definitions, a student was defined as having a migration background if he or she was not born in Germany or if at least one parent was not born in Germany but moved to Germany after 1949.41
Individual SES
To assess the individual SES of the student, we used the Family Affluence Scale (FAS), a validated instrument to assess the material affluence of the family asking for the number of cars and computers in the family, for holidays during the past 12 months, and whether the child has its own room.42 The FAS consists of values from 0 to 7, with higher values indicating higher affluence, and can be categorised into three categories (low (0–3), moderate (4-5) and high affluence(6-7). The FAS was completely assessed only at the 24 months follow-up, we therefore used the 24 months follow-up FAS to describe family SES at baseline.
Neighbourhood SES
For the SES of the students’ neighbourhood, we used the social index defined and implemented by the ‘Atlas of Social Structure’ (Sozialstrukturatlas). It is an instrument used in Berlin to describe the social situation of Berlin by classifying 447 subareas (with on average 7500 habitants) of the 12 districts of Berlin accordingly.43 44 This social index reflects the distribution of social and health burden in Berlin. Social and health indicators are, for example, unemployment, welfare reception rate, average per capita income and also premature mortality and avoidable deaths. The index ranges from 1 reflecting the best to 7 reflecting the worst social situation of a district.
School types
In Berlin, two types of secondary schools exist: high schools with the possibility to achieve a high school diploma after 12 years, as well as integrated secondary schools (an integration of different school types) with the possibility to achieve a high school diploma after 13 years. More often than high schools, integrated secondary schools are left by the students after the 10th grade with a secondary school leaving certificate. The academic requirements are higher in high schools than in integrated secondary schools.45
School neighbourhood SES
Since the neighbourhood of the school can be different to that of students, we assessed this information (analogous to the individual neighbourhood SES) in order to take an additional influencing factor of the students’ behaviour into account.
Statistical analysis
All statistical analyses were performed for the students aged 12 and 13 years due to the small number of students younger than 12 and older than 13 years (8.1%). We used all data available for the respective analysis; missing data were not imputed.
Characteristics of schools and students were analysed by descriptive statistical methods (eg, mean and SD, frequencies and percentages; P values are derived from t-tests and χ2tests).
Because of the nested structure of the data with both fixed and random effects, a generalised linear mixed model with a logit link function was used for the analysis when comparing groups (models with random intercept). In general, the random factors ‘school’ and ‘class within school’ (as nested factor) were included into the models, with either PA or ST as the dependent variable. Results are presented as ORs and 95% CIs.
These models were used to determine the association of several factors. For PA as the dependent variable, sex, migration background, BMI and ST were included into all models, in addition with individual SES (FAS-score) (model 1) or students’ neighbourhood SES (model 2) or both (model 3a). A final model included the aforementioned plus the two school level variables school type and school neighbourhood (model 3b). The same procedure was performed for ST as the dependent variable, respectively. To be able to compare different models, the analyses were restricted to the number of students with non-missing data for the model with the largest number of variables included. As sensitivity analyses, to assess if associations are modified by gender, interaction effects on gender were included into the models. Additional sensitivity analyses were performed based on the maximum number of students with non-missing data for the respective model. All P values are considered exploratory (with no adjustment for multiple testing). Analyses were performed using the software package SAS release V.9.3 and V.9.4 (SAS Institute).
Results
Characteristics of the study population
Out of 214 contacted schools, 49 schools (23%; 4291 students) showed interest and were eligible for study participation. Before baseline assessment, 1268 out of these 4291 students dropped out including two entire schools. Two thousand, eight hundred and one students participated at the baseline assessment. Out of those, we included 2586 students aged 12 and 13 years in our descriptive analyses and 1523 in our complete case analyses. Figure 1 shows the recruitment process of the schools, classes and students.

Flow chart of the recruitment process.
Sociodemographic characteristics of all participating students are presented in table 1a. The mean (±SD) age of participants was 12.4±0.5 years (12.5±0.5 for boys and 12.4±0.5 for girls) and the distribution between girls and boys was similar (50.5% vs 49.5%). Of the entire sample, 34.1% were defined as having a migrant background. Boys reported more often a high individual SES than girls (53.7% vs 46.3%). Mean neighbourhood SES was similar among boys and girls (4.0±1.9 and 4.1±1.9). Individual and neighbourhood SES were moderately correlated (Spearman’s rank correlation coefficient=0.36; P<0.001). School characteristics are presented in table 1b. An association between the students’ neighbourhood SES and the school type could be observed, indicating that the mean students’ neighbourhood SES was higher among high school students than integrated secondary school students.
Characteristics of the study sample
Of the total sample, 12.8% fulfilled WHO criteria of being active for at least 60 min per day. The proportion of boys fulfilling the criteria was higher than in girls (15.9% of the boys vs 9.8% of the girls, OR 1.7 (1.4; 2.2); P<0.001) and boys also spent more time being active than girls (0.9±0.8 vs 0.6±0.6 hours per day, mean difference 0.3 hours (0.2; 0.3), P<0.001). 81.5% of the boys and 66.9% of the girls reported more than 2 hours ST per day, OR 2.2 (1.8; 2.6); P<0.001. Average ST was also higher among boys than among girls (3.9±2.7 hours vs 3.1±2.5 hours); P<0.001 on week days and 6.5±3.6 hours vs 4.9±3.4 hours on weekend days.
Characteristics of schools
Association of individual and neighbourhood SES with PA and ST
Results of multivariable analyses are presented in figures 2 and 3. These results presented in figures 2 and 3 and in (online supplementary tables 1 and 2 are based on an identical analysis population with complete information (n=1523). Results for the multivariable analysis not restricted to complete cases are additionally presented in online supplementary tables 3 and 4). The results did not differ markedly between both approaches.

Multivariable analysis of physical activity-associated factors among students aged 12–13 years (complete case analysis, n=1523). BMI, body mass index; SES, socioeconomic status.
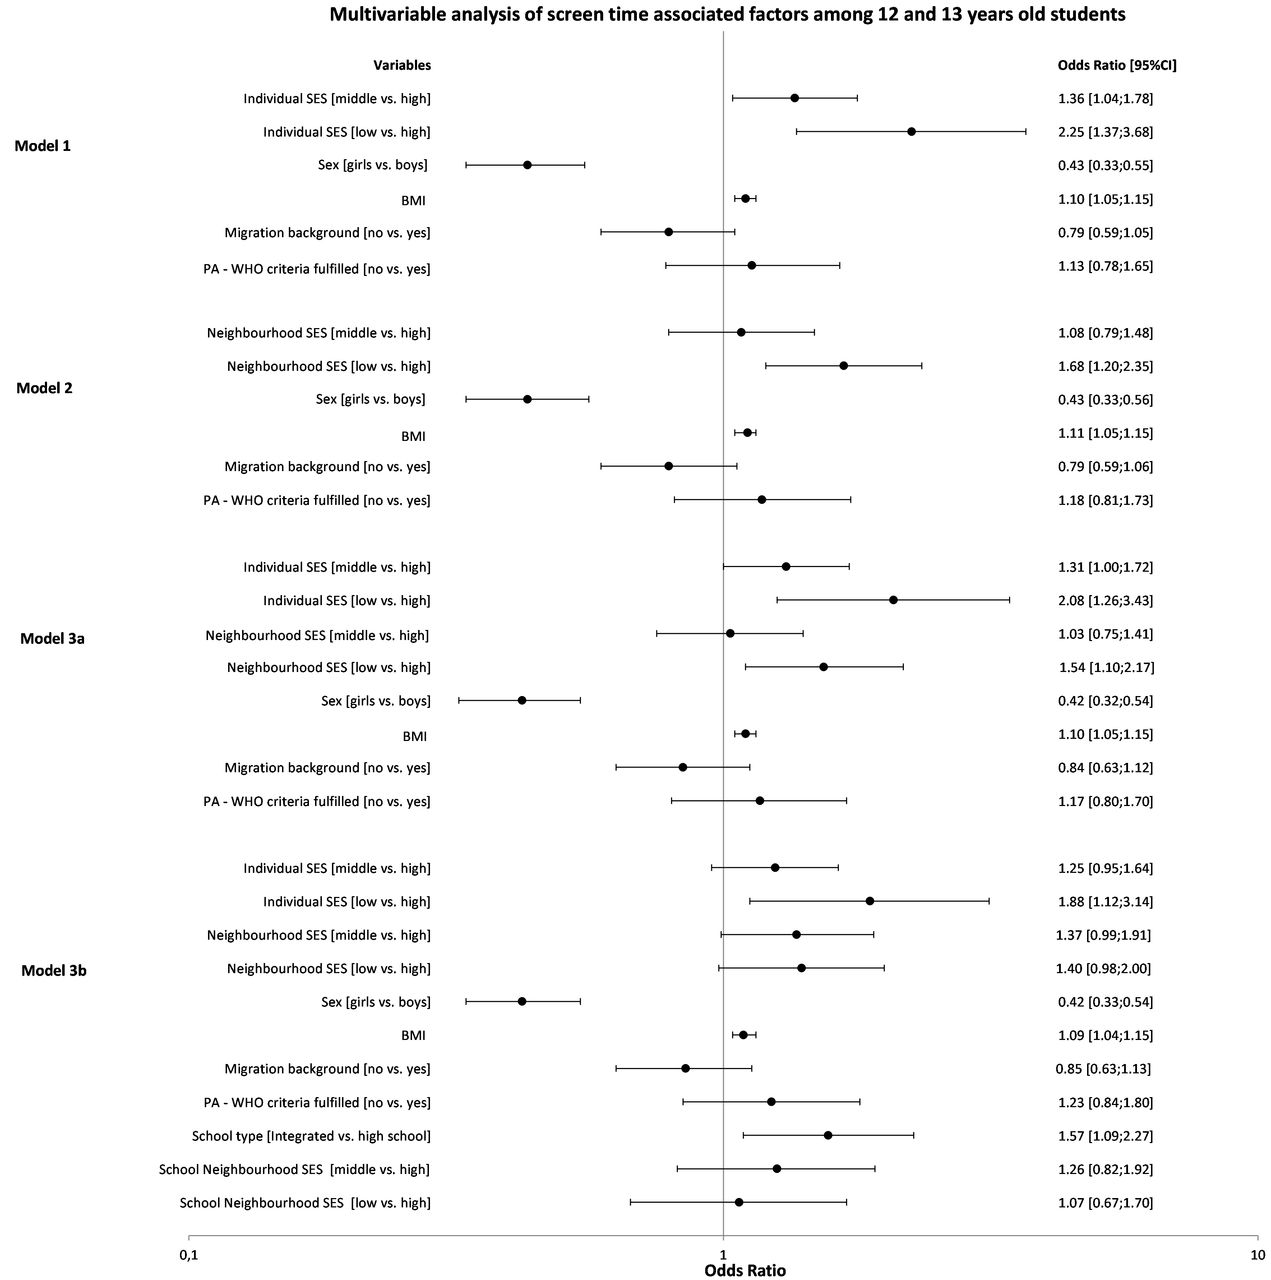
Multivariable analysis of screen time associated factors among students aged 12–13 years (complete case analysis, n=1523). BMI, body mass index; PA, physical activity; SES, socioeconomic status.
In multivariable analyses, individual SES was not associated with PA. The ORs after adjustment for individual factors were 0.90 (0.63; 1.29) and 0.85 (0.48; 1.52); P=0.792 for middle and low SES, respectively, compared with high SES. Additional adjustment for school type and school neighbourhood SES did not change the results notably (0.83 (0.58; 1.20) and 0.74 (0.41; 1.33); P=0.476). ST in contrast was associated with individual SES. The lower the students’ SES the higher the odds to spent more than 2 hours of ST per day (1.31 (1.00; 1.72) and 2.08 (1.26; 3.43); P=0.008) for middle and low individual SES, respectively, compared with high SES. This association was attenuated slightly when additionally adjusting for school variables (1.25 (0.95; 1.64) and 1.88 (1.12; 3.14); P=0.036).
In contrast to individual SES, a lower neighbourhood SES was associated with a higher odds of engaging in 60 min per day in PA (1.34 (0.86; 2.08) and 1.76 (1.12; 2.75); P=0.047) for middle and low neighbourhood SES, respectively, compared with high neighbourhood SES after adjustment for individual factors; after adjustment for school variables, the association of neighbourhood SES with PA was attenuated somewhat and no longer independently associated (OR 1.19 (0.78; 1.82) and 1.51 (0.93; 2.46); P=0.253).
Compared with high neighbourhood SES, students with low neighbourhood SES were more likely to spend more than 2 hours of ST per day (OR 1.54 (1.10; 2.17)), while there was no association for students with middle neighbourhood SES (1.03 (0.75; 1.41); P=0.019). When additionally adjusting for school variables, neighbourhood SES was no longer independently associated with ST and the OR of middle and low neighbourhood SES, compared with high neighbourhood SES, became almost equal (1.37 (0.99; 1.91) and 1.40 (0.98; 2.00); P=0.109). There was no interaction effect between gender and ST regarding PA, nor between gender and PA regarding ST (data not shown).
Discussion
In this study, we investigated the association of individual and neighbourhood SES with PA and ST among seventh grade school students. The individual SES of the students in our study sample, measured with the FAS, was significantly associated with ST. Students with lower SES were more likely to spend more than 2 hours per day viewing screen devices. Compared with high SES, low SES was more strongly associated with ST than middle SES. Similar results were found in other studies.16 46 47 Potential reasons for these findings are that parents with better education and higher statuses may be more aware of the health consequences of excessive ST and thus have stricter rules regarding ST behaviour.48 Children from families with lower SES may also more often have a TV in their room, which has been shown to be associated with higher ST levels.49 Moreover, it is well known that parents have an important role-modelling function, which influences children’s behaviours, such as screen viewing.50 Since children of families with lower SES may more often have parents that engage in higher ST and/or watch more often TV together with their parents, they may in turn engage in more ST.51
PA on the other hand was not associated with individual SES in our study population. This finding is in part consistent with the results of the HBSC study for Germany and with a few other studies.8 52 53 A possible explanation for this finding is that PA consists not only of organised sports or activities that require a club membership or sports equipment. On the contrary, a large part of PA among youths may be daily life activities, such as active commuting, or sports and activities in the neighbourhood and in parks which is independent from the individual SES.54 However, in contrast to our findings and the other studies, a variety of studies do show an association between SES and PA, which has been highlighted in reviews by Hanson and Chen or Sallis et al.16 55 It should be noted that most of these studies are from the USA or Australia and the explanations for the observed associations, such as the higher prevalence of unsafe neighbourhoods or of neighbourhoods with less green space may not be directly transferable to Germany and Berlin.
The other main aspect of our study was the investigation of the neighbourhood SES and its association with PA and ST. The neighbourhood SES represents the social and health indicators of a city or of its districts, including unemployment rate, welfare reception rate, average per capita income and others. In our study, students living in low SES neighbourhood areas were more likely to be physically active than those with middle or high neighbourhood SES. To a certain extent, this is surprising and in contrast to many earlier studies that have reported mostly no or inverse associations between neighbourhood SES and PA.28 56–59 However, as suggested in an earlier study the observed finding in our study may be related to higher active transportation among adolescents of families with lower SES because they may be less likely to own a car resulting in more students using the bicycle or public transportation to school.60 Similar to individual SES, another explication could be that the major part of PA among adolescents consists of unstructured activities rather than organised team sports.54 Thus, a membership in a sports club (which is less probable in neighbourhoods with lower SES) would not affect the overall amount of PA.
Low and middle neighbourhood SES were also associated with higher ST compared with high neighbourhood SES. This result is in line with a study by Carson et al.61 Neighbourhood safety, as suggested by Carson et al, may be one possible explanation for this finding. In addition, the lack of suitable and well-maintained recreation facilities could lead to more ST as replacement of other leisure time activities. In contrast to our results, many studies investigating neighbourhood SES and its association with sedentary behaviour reported null results as shown in a recent review by Stierlin et al, suggesting that other factors may be more important than neighbourhood SES in the context of adolescents’ sedentary behaviour.30 Possible reasons for these differences between findings may be related to different study populations across individual studies but also the fact that our study only focused on ST instead of total sedentary behaviour. Screen viewing as a health behaviour has not been investigated widely in the context of individual and neighbourhood SES, but it appears that in Berlin it is more closely linked with these factors than PA. Hence, promoting alternative activity opportunities for adolescents living in lower SES neighbourhoods could be a worthwhile target for interventions. In the context of the existing literature, it would be useful to also investigate total sedentary behaviour in future German studies.
In addition to individual and neighbourhood SES, school level factors play a role in the health behaviour of school children.62 Moore and Littlecott found that school level affluence was independently associated with health behaviours (except PA) of the school students after adjusting for the individual SES.63 When additionally including school type and school neighbourhood SES as covariates in our analysis, presented results for PA and ST were attenuated somewhat and neighbourhood SES was no longer independently associated with PA and ST, indicating the potentially important role of school type and school neighbourhood SES on PA and ST.
A possible explanation for this finding could be that adolescents living in areas with lower neighbourhood SES are more often attending an integrated secondary school which has been shown in table 1b. Since the academic standards of integrated secondary schools tend to be lower than those of high schools, it is possible that students of the first-mentioned have more leisure time than those of the latter.64 65
Some studies found that the school socioeconomic environment, that is, social networks and peer influences had a greater effect on health behaviour among adolescents than the individual SES.63 66 This illustrates the complex interplay of individual SES, neighbourhood SES and the school environment (school type and school neighbourhood SES), that may also be affected by parental choice of schools and other parental influences on school activities.67 A recent study from the UK has provided some further evidence for these complex relationships.63 Studies from Germany have also shown that the neighbourhood SES as well as the SES of the students tends to be correlated with the school type.68 Better educated parents tend to send their children to high schools rather than integrated secondary schools,69 which could imply that it is the school type itself influencing PA and ST, and the social environment of the student. But even if the choice of the school type is done by the parents and is influenced by their SES, targeting integrated secondary schools may be important and could be emphasised more in health promotion activities. It appears that this may help to address the issue of individual SES on the one hand (more children with low SES in secondary schools) but also neighbourhood SES on the other hand. Further research is needed to disentangle these complex relationships between individual and neighbourhood SES, as well as school environment. With additional research it could be investigated if some neighbourhoods might benefit more from ST-related activities, while others might benefit more from PA-related activities. The aim should be the ability to target the content of health promotion activities according to school type and neighbourhood to meet greatest needs.
In addition to individual and neighbourhood SES, other factors like the built environment (ie, number of public transport stops, residential density, intersection density and the number of parks) could also play an important role in adolescents’ health behaviours.70 These factors may be mediators of the observed associations, but studies have also suggested that associations may be moderated by the built environment (studies have shown that individuals with low neighbourhood SES had a greater benefit of good walkability than those with a high neighbourhood SES).31 32 Future research should therefore also include measurements of the built environment in Berlin to provide new insights into the associations with PA.
Strengths and limitations
Strengths of our study include the size of our sample, as well as the proportion of students with migration background, SES and gender distribution, which appear to be very similar to the student population of Berlin.71 However, the results are only valid for regions with similar characteristics as Berlin: an urban well-connected region with relatively safe neighbourhoods and good infrastructure for transportation and cycling.
Some limitations have to be considered as well. First, FAS was only assessed at the 24-month follow-up. However, we assessed one item of the FAS (holiday) additionally at baseline and at the 12-month follow-up. The answers were quite similar over the 2 years. We thus think that the period of 2 years was not associated with major changes in the FAS level. We also found differences in the self-report FAS of boys and girls, which is somewhat surprising. It is possible that the structure of the questionnaire led to an overestimation among boys due to a higher interest in cars and computers (ie, two key elements of the FAS). Second, PA was not measured objectively. Self-report of children and adolescents, especially regarding PA, may lead to biased results through misreporting.72 Measurement errors associated with self-report may further be influenced by SES of adolescents.73 Future studies should use accelerometers or other means to objectively measure PA and sedentary behaviour.74 Another limitation of our study is that we did not assess total sedentary behaviour and that ST was determined based on the use of TV, computer and video games as assessed by the HBSC questionnaire.35 75 Other increasingly popular screen devices (eg, smartphones, tablets) and other kinds of sedentary behaviours like sitting during homework, talking on the phone and sitting at school were not taken into account, which may have led to an underestimation of ST.
Conclusion
Lower individual and neighbourhood SES were associated with higher ST. Lower neighbourhood but not individual SES was associated with higher PA. After consideration of school type and school neighbourhood SES associations were attenuated and became insignificant for the relationship between neighbourhood SES, PA and ST. Further research is warranted to unravel the complex relationships between individual SES, neighbourhood SES and school environment to develop more targeted health promotion strategies in the future.
Supplemental material
Supplemental material
Supplemental material
Supplemental material
Acknowledgments
The authors thank the Berlin City Council (Senatsverwaltung für Bildung, Jugend und Wissenschaft, Berlin) and the participating schools, teachers and students for supporting the project.
References
Footnotes
Contributors LK and FM-R drafted the manuscript with intellectual input from SR, NR, JM-N and NS-B. FM-R supervised the study and LK carried out the data collection and parts of the data analysis. FL and SR were responsible for data assessment and statistical analyses, FM-R, CB, NR, JM-N and NS-B were responsible for the design of the recruitment methods and the assessment tools, FM-R, NR, JM-N and SNW conceptualised the study. All authors read and approved the final manuscript.
Funding This work was supported by ‘The German Cancer Aid (Deutsche Krebshilfe e.V.)’.
Competing interests None declared.
Ethics approval The study was approved by the ethical review committee of the Charité-Universitätsmedizin Berlin, Germany.
Provenance and peer review Not commissioned; externally peer reviewed.
Data sharing statement No additional data are available.