Article Text

Abstract
Objectives Emergency admission is associated with the potential for adverse events in older people and risk prediction models are available to identify those at highest risk of admission. The aim of this study was to externally validate and compare the performance of the Probability of repeated admission (Pra) risk model and a modified version (incorporating a multimorbidity measure) in predicting emergency admission in older community-dwelling people.
Setting 15 general practices (GPs) in the Republic of Ireland.
Participants n=862, ≥70 years, community-dwelling people prospectively followed up for 2 years (2010–2012). Exposure: Pra risk model (original and modified) calculated for baseline year where ≥0.5 denoted high risk (patient questionnaire, GP medical record review) of future emergency admission.
Primary outcome Emergency admission over 1 year (GP medical record review). Statistical analysis: descriptive statistics, model discrimination (c-statistic) and calibration (Hosmer-Lemeshow statistic).
Results Of 862 patients, a total of 154 (18%) had ≥1 emergency admission(s) in the follow-up year. 63 patients (7%) were classified as high risk by the original Pra and of these 26 (41%) were admitted. The modified Pra classified 391 (45%) patients as high risk and 103 (26%) were subsequently admitted. Both models demonstrated only poor discrimination (original Pra: c-statistic 0.65 (95% CI 0.61 to 0.70); modified Pra: c-statistic 0.67 (95% CI 0.62 to 0.72)). When categorised according to risk-category model, specificity was highest for the original Pra at cut-point of ≥0.5 denoting high risk (95%), and for the modified Pra at cut-point of ≥0.7 (95%). Both models overestimated the number of admissions across all risk strata.
Conclusions While the original Pra model demonstrated poor discrimination, model specificity was high and a small number of patients identified as high risk. Future validation studies should examine higher cut-points denoting high risk for the modified Pra, which has practical advantages in terms of application in GP. The original Pra tool may have a role in identifying higher-risk community-dwelling older people for inclusion in future trials aiming to reduce emergency admissions.
- GERIATRIC MEDICINE
- ACCIDENT & EMERGENCY MEDICINE
- PRIMARY CARE
This is an Open Access article distributed in accordance with the Creative Commons Attribution Non Commercial (CC BY-NC 4.0) license, which permits others to distribute, remix, adapt, build upon this work non-commercially, and license their derivative works on different terms, provided the original work is properly cited and the use is non-commercial. See: http://creativecommons.org/licenses/by-nc/4.0/
Statistics from Altmetric.com
Strengths and limitations of this study
This study externally validates the Probability of repeated admissions (Pra) risk model. This tool is easy to use and apply in the general practice (GP) setting but recent external validation is limited.
GP record data were used to record the medical conditions and healthcare usage questions of the Pra reducing the risk of response bias for these questions.
This study examines the original Pra and compares its performance to a modified version which substitutes self-rated health and informal carer availability questions (which require patient questionnaire completion) with a measure of multimorbidity. This modified Pra model could be applied using the GP medical record data only in order to risk-stratify patients and has advantages for clinical utility.
This study was conducted across 15 GPs in Ireland and the findings may not be generalisable to other settings.
Background
Emergency hospital admission in older people is associated with an increased risk of adverse events including falls, functional decline and nosocomial infections.1 ,2 Recent healthcare policy initiatives in the UK and the USA suggest the use of risk prediction models to identify community-dwelling older people at highest risk of future emergency admission.3 ,4 A recent systematic review identified 27 such models developed and validated for use in primary care.5 One such risk model is the Probability of repeated admission (Pra) tool.6 This self-report questionnaire includes eight items relating to patient demographics (age and gender), specific medical diagnoses (diabetes mellitus and coronary artery disease), healthcare usage (number of doctor visits and emergency admissions in the previous year), self-rated health and the availability of an informal caregiver. Developed in the USA in 1993 for use in older community-dwelling people, the Pra tool is calculated using a logistic formula, with a score of ≥0.5 indicative of high risk of experiencing an emergency admission over the next year.6 ,7
We previously undertook a systematic review and meta-analysis of the Pra tool and identified 10 community-based validation studies and reported a pooled c-statistic of 0.7, representing poor model discrimination, with high summary specificity (pooled specificity 95%, 95% CI 95.8% to 96.7%).8 However, the most recent study was conducted over 10 -years ago, so recent external validation is lacking. In addition, the Pra tool, originally designed as a postal questionnaire, has been validated successfully in two US studies using data extracted from health administrative databases and the medical record.9 ,10 These studies excluded Pra questionnaire items relating to self-rated health and caregiver availability and instead substituted a measure of multimorbidity, the Chronic Disease Score and the Deyo-Charlson index, respectively.9 ,10 The advantage of this approach is that the modified Pra tool could be applied to a research database or medical record software system without needing the patient to complete a questionnaire, reducing the risk of questionnaire response bias.
The aims of this study were: (1) to externally validate the Pra tool in predicting future emergency admission over 1 year follow-up in a cohort of older community-dwelling people; and (2) to externally validate a modified version of the Pra tool (that substitutes a measure of multimorbidity) in the same study setting and compare predictive accuracy.
Methods
The Strengthening The Reporting of Observational Studies in Epidemiology (STROBE) guidelines were adhered to in the conduct and reporting of this cohort study.11 In addition, to account for the specific methodological requirements for externally validating a risk-prediction model, the Transparent Reporting of a multivariable prediction model for Individual Prognosis or Diagnosis (TRIPOD) statement was adhered to.12
Study design and study population
This is a 2-year prospective cohort study of older general-practice (GP) patients recruited from 15 urban practices in Leinster in the Republic of Ireland (2010–2012). At baseline in 2010, a proportionate stratified random sampling approach was used to recruit patients for study participation. Study inclusion criteria were: (1) aged ≥70 years on 1 January 2010, and (2) in receipt of a valid general medical services (GMS) card. Approximately 96% of all people aged ≥70 years in the Republic of Ireland are in receipt of a GMS card which entitles the holder to free public health services (including GP visits) and prescriptions, subject to a maximum co-payment of €25 monthly.13 The following exclusion criteria were applied: (1) receiving palliative care; (2) cognitive impairment at the level that would impact their ability to complete the outcome measure (defined as Mini Mental State Examination (MMSE) ≤20); (3) significant hearing/speech/visual impairment; (4) currently experiencing a psychotic episode; (5) hospitalised long-term, in a nursing home, homeless or in sheltered accommodation; and (6) recent bereavement (within 4 weeks). Each participant's general practitioner applied the exclusion criteria and determined eligibility for participation at baseline in 2010. Ethical approval for this study was granted by the Royal College of Surgeons in Ireland (RCSI) Human Research Ethics committee (reference number REC462bbb) and all participants gave informed consent prior to participating.
Risk prediction tool: calculation of the Pra score
The Pra score was calculated using postal questionnaire and GP medical record review data collected in 2010. In addition, each patient's GP medical record was reviewed. The original Pra questionnaire items are: (1) age; (2) gender; (3) presence of diabetes mellitus; (4) presence of coronary heart disease; (5) hospital admission in previous year; (6) >6 physician visits in previous year; (7) self-rated health; and (8) availability of an informal caregiver.6 A logistic formula is applied to produce a score from 0 to 1. (See online supplementary 1) Patients who score ≥0.5 are considered at high risk of admission over the next year. As the Pra model is under copyright, a no-fee study licence was applied for and granted by the Pra developers to allow use of the Pra logistic formula for the purposes of this study.6 The Pra was examined across its three risk categories; low (<0.35), moderate (0.35–0.49) and high (≥0.5) as well as an exploratory very-high-risk category of ≥0.7.
Supplemental material
In addition, a second modified version of the Pra was calculated. This modified Pra model, validated in two previous studies, substitutes the questionnaire items relating to self-rated health and availability of an informal caregiver for a measure of multimorbidity.9 ,10 The RxRisk-V, a measure developed specifically for older people which classifies patients' chronic medical conditions based on the WHO Anatomical Therapeutic Chemical (WHO-ATC) medication classification system of their dispensed medications, was used as the measure of multimorbidity in this instance.14 Therefore, the modified Pra comprised of seven questions; (1) age, (2) gender, (3) presence of diabetes mellitus, (4) presence of coronary heart disease, (5) hospital admission in the previous year, (6) >6 physician visits in previous year and (7) RxRisk-V score. The Rx-Risk-V was calculated using linked pharmacy claims data from the national Health Services Executive (HSE)-Primary Care Reimbursement Scheme (PCRS) pharmacy claims database. This was available for those who provided consent and who had a valid identifier for linkage purposes. In the HSE-PCRS, dispensed prescriptions are coded using the WHO-ATC classification system, and defined daily doses, strength, quantity of medication and mode of administration are available. This version of the Pra is referred to as modified Pra score and the logistic formula used for calculation is presented in online supplementary material 2. The Pra was examined across three risk categories; low (<0.35), moderate (0.35–0.49) and high (≥0.5) as well as an exploratory very-high-risk category of ≥0.7.
The data source used to record each of the Pra questionnaire items (original and modified) is outlined in table 1.
Data source for each item of the original and modified Pra score
Primary outcome: emergency hospital admission
Emergency admission was defined as ‘unplanned overnight stay in hospital’.5 This outcome was measured by reviewing the GP medical record over 1 year of follow-up where details regarding emergency admissions (number of admissions, date(s), date of admission(s), length of stay and reason for admission) were recorded for the follow-up year.
Statistical methods
All descriptive statistics and analysis presented were completed using Stata version-13 (StataCorp, Texas, USA). Two aspects of the Pra model performance were examined in this validation study; discrimination and calibration. Discrimination refers to the ability of the Pra to distinguish correctly the patients with and without the outcome of interest, that is, emergency admission.15 The c-statistic with 95% CIs was estimated using non-parametric receiver operating curve (ROC) analysis with cut points of 0.1 increments. In addition, sensitivity, specificity, positive predictive values (PPVs), negative predictive values (NPVs) and likelihood ratios are presented. Calibration refers to how closely predicted outcomes agree with observed outcomes and therefore is concerned with the number of emergency admissions predicted to occur by the Pra versus the number of emergency admissions actually observed during the prediction period. The Hosmer-Lemeshow goodness of fit statistic was used to estimate the calibration of the Pra score and calibration plots were generated across deciles of risk.16
Results
Baseline characteristics
Of 904 baseline study participants, a total of 862 (95%) participants were included in this study. Participants were excluded if there was incomplete hospital admission data for the prediction year. The reasons for exclusion were as follows: 19 moved GP, 14 moved to a nursing home and 9 GP medical record reviews were missing.
The baseline characteristics of the study participants, according to the items in the original and modified Pra models are summarised in table 2.
Baseline characteristics of study participants by the original or modified Pra
The proportion of patients at high risk (≥0.5) according to the original Pra was 7% (n=63) compared with 45% (n=391) for the modified Pra. This higher proportion was largely due to the higher number of patients with ≥5 RxRisk-V conditions (n=433) using the modified Pra, compared with patients who reported poor or fair health status (n=158) and lack of an informal caregiver (n=49) applying the original Pra.
Performance of the Pra score: discrimination
The performance of the two versions of the Pra score in predicting emergency admission over the next year is presented in table 3.
Prediction of ≥1 emergency admission(s) during 1 year of follow-up by two versions of the Pra score (original and modified)
The c-statistic for the original Pra was 0.65 (95% CI 0.61 to 0.70) compared with 0.67 (95% CI 0.62 to 0.72) for the modified Pra. There was no statistically significant difference in these c-statistics (p=0.38). A total of 41% (n=26) of patients identified as high risk by the original Pra were subsequently admitted to hospital, while 26% (n=103) of those stratified as high risk using the modified Pra were subsequently admitted.
Figure 1 presents the ROC curve, a graph of the sensitivity (y-axis) and the 1-specificity (x-axis), for the original Pra and the modified Pra, respectively, at incremental Pra score cut-points of 0.1. The maximum original Pra score in this cohort was 0.71 and the maximum modified Pra score was 0.83. Both models demonstrated poor model discrimination for the outcome for emergency admission during the 1 year follow-up period. Table 4 presents, at each cut-point, the number of study participants, number admitted, sensitivity, specificity, PPV, NPV and likelihood ratios.
Number of study participants, number admitted, sensitivity, specificity, predictive values and likelihood ratios at cut-points of 0.1 increments for the original and modified Pra
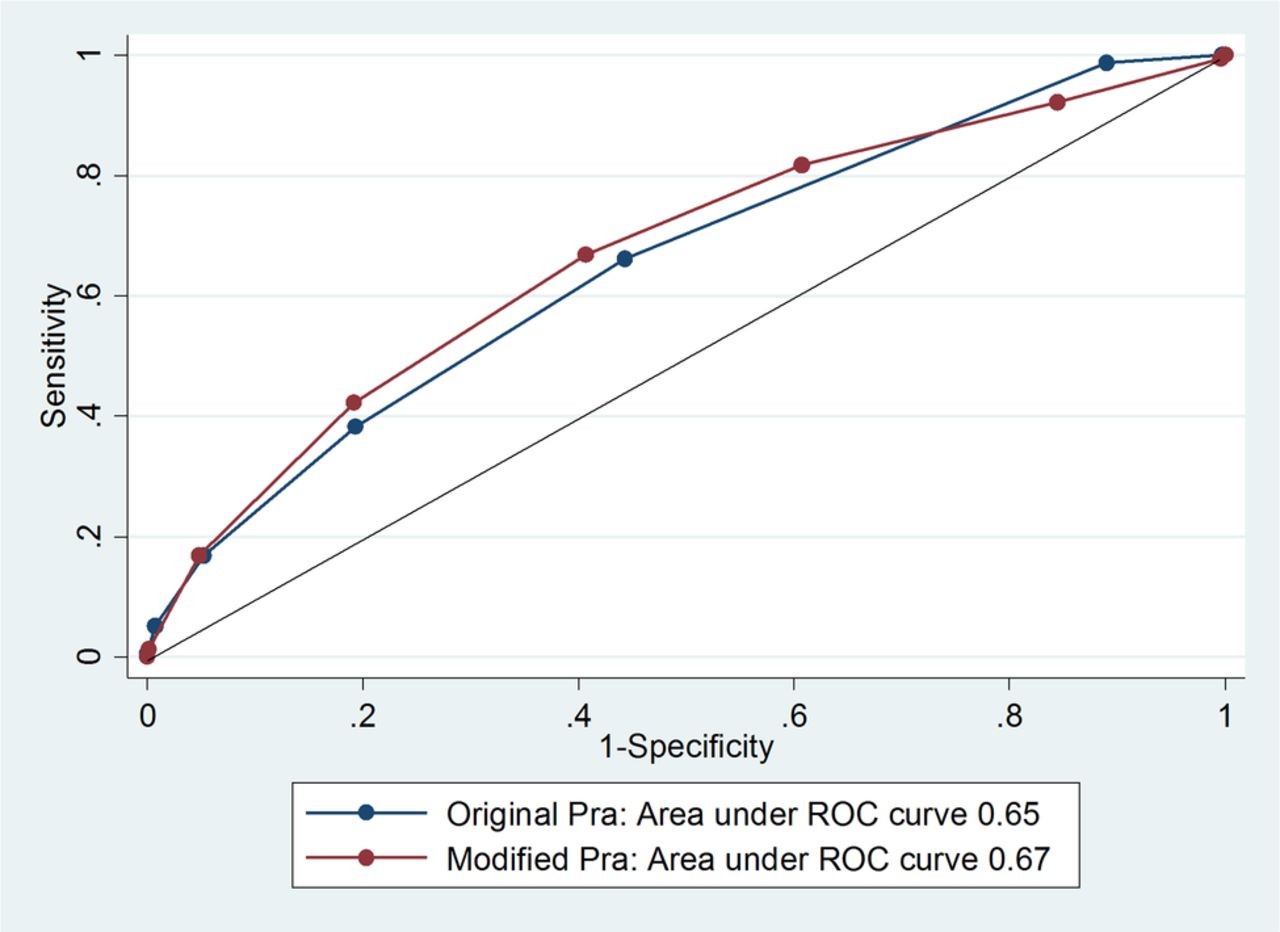
Receiver operating characteristic (ROC) curve for the original and modified probability of repeated admission validation cohort.
Performance of Pra models at low, moderate, high and very high risk: discrimination
The number of patients per risk category, number admitted, sensitivity, specificity, PPV, NPV and likelihood ratios of the original and modified versions of the Pra at the low, moderate and high-risk cut-off points are presented in table 5.
Number of study participants, number admitted, sensitivity, specificity, predictive values and likelihood ratios at low, moderate, high and very-high-risk categories for the original Pra and modified Pra
The original Pra at a cut-point of ≥0.5 had high specificity of 95% but low sensitivity of 17%. The NPV for the high-risk category was 84%. The modified Pra reported lower specificity of 59% at the same cut-point of ≥0.5 but higher sensitivity (67%). At a ‘very-high-risk’ category of ≥0.7, the specificity was 95% with NPV of 84%.
Performance of the Pra score: calibration
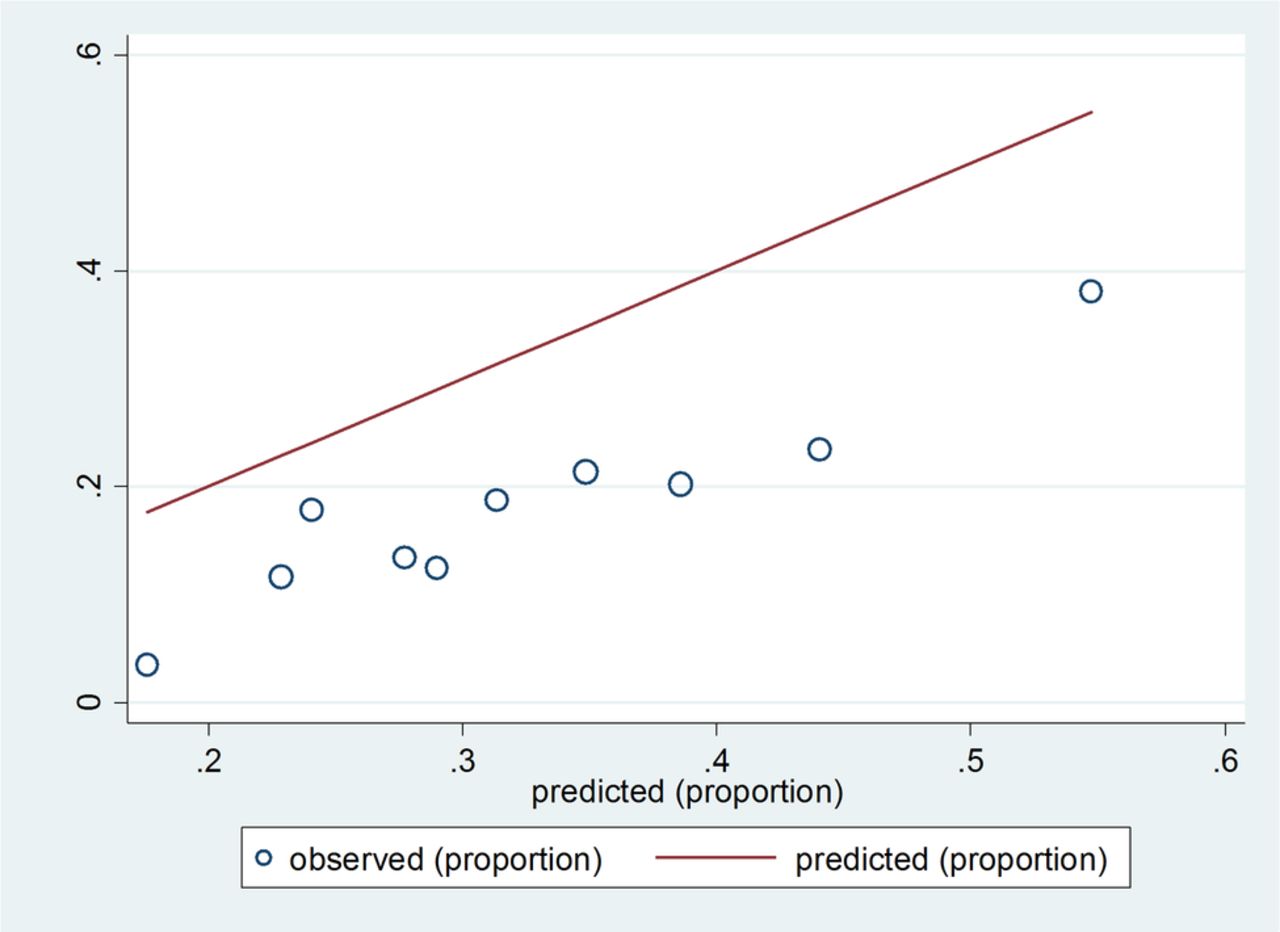
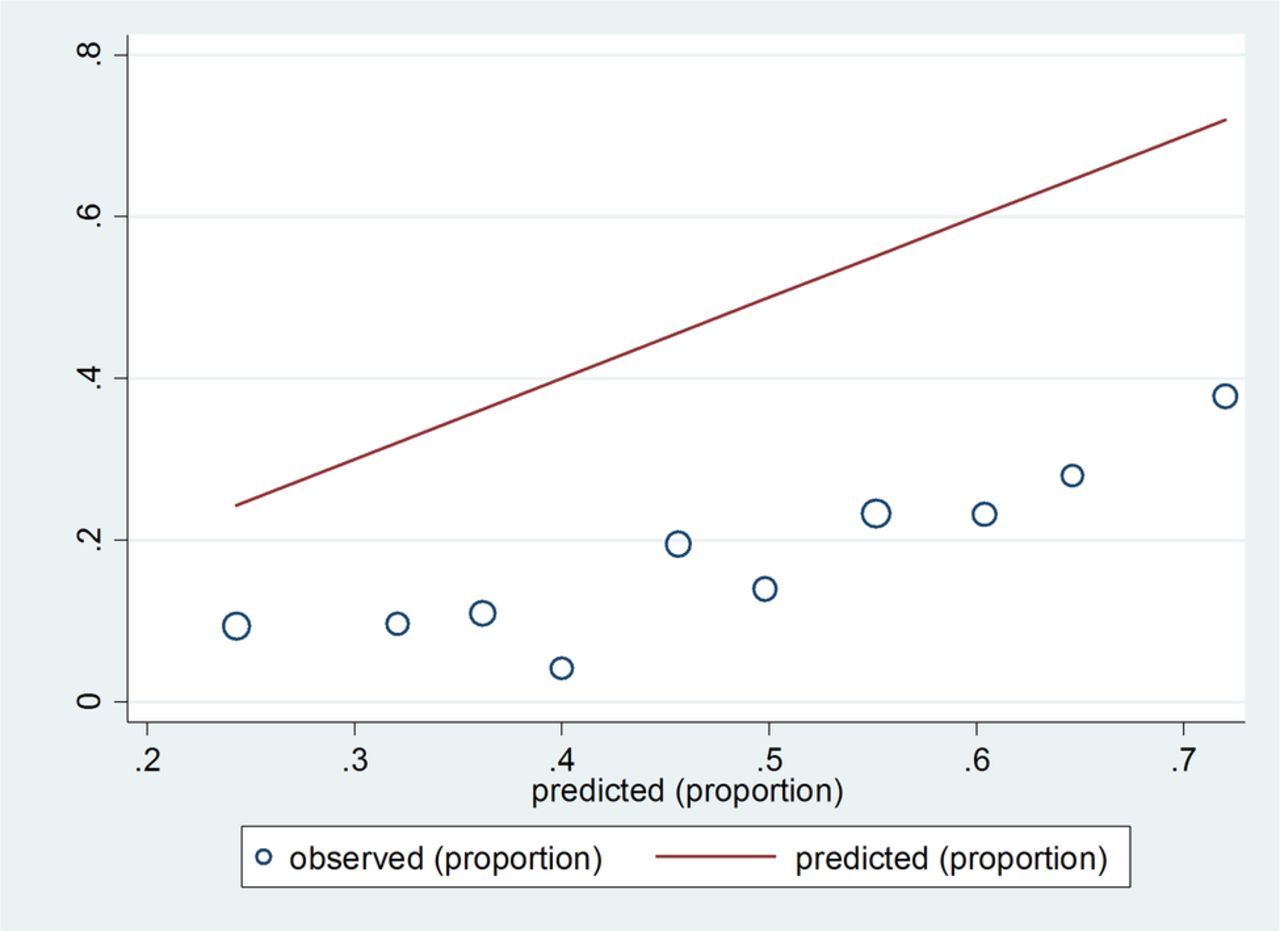
The original and modified versions of the Pra score overestimated the number of hospital admissions in this study population across all levels of risk strata in the 1 year prediction period. The calibration performance of the original and modified Pra models is presented graphically in the calibration plots presented in figures 2 and 3, respectively. The Hosmer-Lemeshow goodness of fit statistic demonstrated a significant difference between observed and predicted admissions for the original Pra (χ2 84.67, p value <0.001) and the modified Pra (χ2 330.23, p value <0.001) indicating overprediction of admissions.

Calibration performance in deciles of risk for the original probability of repeated admission score.

Calibration performance in deciles of risk for the modified probability of repeated admission score.
Discussion
Statement of principal findings
This validation study compares the predictive accuracy of the original Pra tool and a modified version of the Pra, substituting two self-report items with a measure of multimorbidity, in predicting future hospital admission in older community-dwelling adults.
The original Pra score demonstrated poor discrimination performance (c-statistic 0.63) but identified a relatively small number of people as high risk (n=63, 7%), of whom more than one-third (n=26) were admitted to hospital in the outcome year. The modified Pra demonstrated similar poor discrimination performance (c-statistic 0.67) but identified a much higher number of people as high risk (n=391, 46%), of whom less than one-third were subsequently admitted (n=103, 26%). However, adding a ‘very-high-risk’ category (Pra score ≥0.7) for the modified Pra identified only 60 people of whom over one-third (n=26, 43%) were admitted. Therefore, if this modified model is to be used in future studies then adding an additional risk stratum may be necessary.
Both the original and modified Pra risk models were poorly calibrated in this validation study, with fewer observed emergency admissions compared with predicted admissions across all three strata of risk (low, moderate and high).
Comparison with existing literature
In the systematic review and meta-analysis of the original Pra described previously, the summary c-statistic was 0.70 with low pooled sensitivity of 12% (95% CI 10.5% to 13.6%) and high pooled specificity of 96% (95% CI 95.8% to 96.7%).8 The current external validation of the Pra demonstrated poorer model discrimination but the specificity for those classified as high risk was similar in this new setting.
Previous validation studies have been largely conducted in the USA and all were conducted over 10 -years ago.8 One of these studies (n=6924 aged ≥65 years), examined the performance of the original Pra in a randomised controlled trial (RCT) across three European countries (UK, Switzerland and Germany).17 Similar proportions of patients were classified as high risk, ranging from 4% to 7%, with similar predictive accuracy in different settings (combined sites c-statistic: 0.64 (95% CI 0.62 to 0.66)).17 Two US community-based studies examined a modified version of the Pra, substituting self-report items (caregiver availability and self-rated health status) for a measure of multimorbidity. One study compared the performance of the original Pra with a modified version (using the Deyo-Charlson index as a multimorbidity measure) in a cohort of older community-dwelling people (n=296, ≥65 years) for the primary outcome of healthcare costs over 6-month follow-up.10 This study was limited by a poor response rate to the Pra questionnaire (53%) but did report similar performance between the two approaches. The specificity of the original Pra at a cut-point of ≥0.5 denoting high risk was 90% for the outcome of inpatient stay over 6 months, while the modified Pra reported specificity of 92% for the same outcome.10
A second study of US older community-dwelling people (n=2174, aged ≥65 years) used the Chronic Disease Score as a surrogate for self-reported health status and caregiver availability.9 This study reported similar predictive accuracy using either model (original Pra c-statistic: 0.69, modified Pra c-statistic: 0.69) and similar proportions of patients identified as high risk (14% and 16%, respectively, for original and modified Pra).9 However, as this study was published in 1998 and was based on data from one USA state, the generalisability of its findings to current practice and other healthcare settings is somewhat limited.
The Pra tool performs similarly to other models based on self-report and designed for use in primary care.5 Examples include the Sherbrooke questionnaire and the Emergency Admission Risk Likelihood Index (EARLI), which include similar items relating to previous healthcare use, self-rated health and medical diagnoses with similar predictive accuracy.18 ,19 In external validation studies, the Sherbrooke questionnaire reported poor model discrimination (c-statistic: 0.60 (95% CI 0.53 to 0.67)) similar to the EARLI with reported c-statistic of 0.67 (95% CI 0.63 to 0.70).18 ,19 Other risk prediction models designed using routine data sets or clinical record review data tend to include a much larger numbers of variables and often require the availability of linked data sets (eg, inpatient/OPD/primary care) for application.5 For example, the UK QAdmissions model was developed using linked computerised GP and hospital inpatient data and includes 30 variables (c-statistic 0.77 (95% CI 0.771 to 0.774).20 The predictive accuracy of these types of models tends to be higher overall but their application depends largely on the availability of large linked data sets. In many countries, including Ireland, there is no data set available that links primary care and hospital usage data, so applying a model, such as the QAdmissions, for risk-stratification purposes would be very challenging.
Regarding calibration performance, the Pra models overpredicted admissions across all risk categories in the current study. Case mix variation is a particular issue for external validation studies with heterogeneity of predictor variables and outcomes of interest across study populations.21 Differences in the prevalence of the outcome of interest, in this case emergency admission, can impact on the performance of the model. This is one reason for updating the original risk model where the intercept is updated to recalibrate predictive performance for a new setting.21
Clinical and research implications
Recent policy initiatives internationally suggest the application of community-initiated risk stratification to identify higher-risk people who can be prioritised for an intervention to reduce their risk of future emergency admission.3 However, this approach requires an accurate admission risk-stratification tool as well as effective community-based interventions and current evidence for both is limited.22
The Pra tool has been used as a risk-stratification tool in two studies examining the effectiveness of community-based interventions in improving different patient outcomes including reduced healthcare usage.23 ,24 In one of these RCTs targeting older people at increased risk of functional decline, the Pra was used to identify higher-risk people who were then prioritised for an intervention.23 This complex intervention included the following components: (1) training of health professionals; (2) administration of the Health Risk Appraisal for Older persons questionnaire; (3) group education sessions with additional personal reinforcement; (4) home visits by a trained nurse with detailed feedback and discussion with the geriatric team; and (5) written feedback to the participant's general practitioner.23 This intervention had moderately favourable effects on the primary outcomes of preventative care use (uptake of vaccinations eg, influenza vaccinations, adjusted OR 1.7, (95% CI 1.4 to 2.1) and more favourable health behaviour (physical activity and diet, eg, high fruit/fibre intake, OR 2.0, (95% CI 1.6 to 2.6), as compared with controls.23
The Pra has also been used in a similar context to identify high-risk patients for inclusion in another RCT measuring the effectiveness of an outpatient geriatric evaluation and management plan on functional decline.24 Patients in the intervention group were significantly less likely than the control group to lose functional ability (adjusted OR 0.67, (95% CI 0.47 to 0.99)) at 18-month follow-up. However, other outcomes such as mortality, use of most health services (with the exception of home health services), and total healthcare costs did not differ significantly between the two groups.24
Based on the findings of the current study, use of the original Pra at cut-point of ≥0.5 may have a role in identifying higher-risk patients for enrolment in RCTs in community settings, as it identified a much smaller number of patients as high risk and demonstrated similar predictive accuracy and better calibration than the modified Pra score at this cut-point. However, at a higher cut-point of ≥0.7, the modified Pra demonstrated similar predictive accuracy and has the advantage of applicability to the GP record rather than relying on patient questionnaire data, so could be explored in future validation studies at this cut-point. The NPV of the Pra is quite high (≥84%) for patients risk-stratified as moderate or high risk and therefore can be useful as a screening test in determining which patients in the community would not benefit from an intervention aiming to reduce future emergency admission rate. However, its PPV is low (∼40% for high-risk group or very-high-risk group) indicating that a significant proportion of patients who are stratified as high risk will not go on to experience an emergency admission.
Study limitations
The items of the Pra score relating to presence of diabetes, coronary artery disease and previous healthcare use were recorded from the GP record rather than the patient questionnaire as per the original Pra. However, it may be argued that this is a more accurate representation of these items as self-report is more prone to response bias. In addition, the outcome of interest, emergency admission in the follow-up year was also recorded from the GP medical record. Previous studies have used different approaches in ascertaining future admission including survey and medical record review. This study recruited patients from 15 urban GP practices in Leinster in the Republic of Ireland and excluded patients with moderate or severe cognitive impairment which may reduce the generalisability of the findings. However, the Pra model was designed as a patient questionnaire which relies on the respondent's ability to recall, among other items, doctor visits and emergency admission. As such, it was not designed for use in a cognitively impaired population. The modified Pra may have a role in this population but this needs to be tested in future validation studies.
Conclusions
The original Pra tool demonstrated poor discrimination but high specificity in this external validation study and identified a relatively small proportion of patients as high risk. This study suggests that the modified Pra tool, incorporating a multimorbidity measure, is more useful at a higher cut-point indicating high risk which could be examined in future validation studies. The Pra tool may have a role in identifying higher-risk older people for inclusion in future trials aiming to improve outcomes for older community-dwelling people.
Acknowledgments
We thank Dr Caitriona Cahir who led the baseline study data collection and the Health Services Executive (HSE)-Primary Care Reimbursement Scheme (PCRS) for use of pharmacy claims database.
References
Footnotes
Contributors EW led the study, did the statistical analysis and wrote the paper. RMcD offered methodological guidance for the statistical analysis and contributed to the paper. KB offered significant methodological guidance to the planning of the study, the data analysis and contributed to the final paper. TF provided clinical and methodological guidance, and contributed to the final paper. SMS provided clinical and methodological guidance and contributed to the final paper.
Funding EW is funded by the Health Research Board (HRB) of Ireland under the Research Training Fellowship for Healthcare Professionals award, grant no. HPF/2012/20.This research was conducted as part of the HRB Scholar's programme in Health Services Research under grant no. PhD/2007/16 at the HRB Centre for Primary Care Research, grant HRC/2007/1.
Competing interests None declared.
Patient consent Obtained.
Ethics approval Research Ethics Committee at the Royal College of Surgeons in Ireland.
Provenance and peer review Not commissioned; externally peer reviewed.
Data sharing statement No additional data are available.