Article Text

Abstract
Objectives To evaluate the effects of a government insurance programme covering tertiary care for the poor in Karnataka, India—Vajpayee Arogyashree Scheme (VAS)—on treatment seeking and postoperative outcomes.
Design Geographic regression discontinuity.
Setting 572 villages in Karnataka, India.
Participants 3478 households in 300 villages where VAS was implemented and 3486 households in 272 neighbouring matched villages ineligible for VAS.
Intervention A government insurance programme that provided free tertiary care to households below the poverty line in half of villages in Karnataka from February 2010 to August 2012.
Main outcome measure Seeking treatment for symptoms, posthospitalisation well-being, occurrence of infections during hospitalisation and need for rehospitalisation.
Results The prevalence of symptoms was nearly identical for households in VAS-eligible villages compared with households in VAS-ineligible villages. However, households eligible for VAS were 4.96 percentage points (95% CI 1 to 8.9; p=0.014) more likely to seek treatment for their symptoms. The increase in treatment seeking was more pronounced for symptoms of cardiac conditions, the condition most frequently covered by VAS. Respondents from VAS-eligible villages reported greater improvements in well-being after a hospitalisation in all categories assessed and they were statistically significant in 3 of the 6 categories (walking ability, pain and anxiety). Respondents eligible for VAS were 9.4 percentage points less likely to report any infection after their hospitalisation (95% CI −20.2 to 1.4; p=0.087) and 16.5 percentage points less likely to have to be rehospitalised after the initial hospitalisation (95% CI −28.7 to −4.3; p<0.01).
Conclusions Insurance for tertiary care increased treatment seeking among eligible households. Moreover, insured patients experienced better posthospitalisation outcomes, suggesting better quality of care received. These results suggest that there are several pathways through which tertiary care insurance could improve health, aside from increasing utilisation of the services that the programme directly subsidises.
- PRIMARY CARE
- India
- Cardiac Care
- Health Insurance
- Regression Discontinuity
This is an Open Access article distributed in accordance with the Creative Commons Attribution Non Commercial (CC BY-NC 4.0) license, which permits others to distribute, remix, adapt, build upon this work non-commercially, and license their derivative works on different terms, provided the original work is properly cited and the use is non-commercial. See: http://creativecommons.org/licenses/by-nc/4.0/
Statistics from Altmetric.com
Strengths and limitations of this study
This paper used a rigorous quasi-experimental approach (geographic regression discontinuity) to estimate the causal effect of public tertiary care insurance for the poor on treatment-seeking behaviour and quality of care received.
The results of this study will help inform the decision of several Indian states that are contemplating implementing this type of insurance scheme.
Although the approach is rigorous, the study is limited in that assignment of the insurance was non-random, which could have created meaningful unobservable differences between people that were eligible and ineligible for the insurance scheme.
Introduction
There is extensive evidence on how health insurance programmes in developing countries affect healthcare utilisation of covered services.1 ,2 Prior research suggests that health insurance expansions in Thailand, China and Mexico resulted in an increase in utilisation of covered services.3–5 Similarly, removing user fees in Ghana increased utilisation of formal healthcare providers by 12%.6 ,7 However, just evaluating the effects of health insurance on utilisation of covered health services is not adequate to understand how and whether insurance improves health. For example, insurance schemes in Ghana, Costa Rica and China increased utilisation but did not exhibit any improvements in health outcomes,8–10 whereas in Thailand and Colombia increased utilisation seems to have led to health improvements. What is needed is a better understanding of the contextual factors surrounding insurance coverage, as well as a more comprehensive examination of the multiple pathways through which insurance can affect health. For example, several insurance programmes in India, the location of this study, cover only costly tertiary care. Such programmes could not only increase use of tertiary care but also increase incentives to use primary care as a means of early detection of illnesses that could be treated by tertiary care.11 ,12 Similarly, insurance not only influences the amount of healthcare used but can also impact quality of care. For example, several insurance programmes mandate basic quality standards in order to be deemed eligible for insurance reimbursement. Thus, insurance can improve quality by steering patients to providers who meet quality standards and by increasing incentives for providers to meet quality standards.
In this paper, we examine the impact of an insurance scheme that covered tertiary care services for the poor in India on seeking medical care for symptoms associated with covered illnesses and on postoperative outcomes after hospitalisations in tertiary care facilities. The programme that we evaluate was called Vajpayee Arogyashree Scheme (VAS) and it was launched in the state of Karnataka in India in 2010. VAS was initially only rolled out to the northern half of the state of Karnataka, resulting in a natural experiment that allowed for causal assessment of VAS's impact. A recent study demonstrated that VAS led to a significant decline in mortality from covered health conditions.13 The study found that VAS increased utilisation of covered services but did not explore other mechanisms that might have led to improved health. Understanding such mechanisms will provide insight into why VAS was successful at improving health and also help in understanding how insurance in general can influence patient and provider behaviour.
We used the same empirical strategy as in Sood et al13 to identify the causal effect of VAS on seeking medical care for symptoms and on postoperative outcomes for illnesses covered by VAS. Increasing treatment seeking for symptoms leads to earlier and greater detection of VAS illnesses, which allows for earlier intervention and could help to explain the findings of reduced mortality. VAS also enlisted many state-of-the-art hospitals to participate in the programme, which provides beneficiaries with access to higher quality facilities that were likely too expensive otherwise. Higher quality of care in these facilities could lead to better postoperative outcomes, which could also help to explain reduced mortality.
Methods
VAS insurance
Most VAS beneficiaries were poor and lived in rural areas with little or no access to tertiary care. Residents in eligible areas who possessed a Below Poverty Line (BPL) card issued by the state government were automatically enrolled in VAS. VAS enabled beneficiaries to receive free tertiary care at both private and public hospitals empanelled by VAS as capable of providing tertiary care. Beneficiaries paid no premiums or copayments at the point of service. As of June 2013, VAS empanelled about 150 hospitals capable of providing tertiary care, including all major medical centres in the state. Empanelled hospitals were required to have all necessary licences and certificates, a general ward with at least 50 beds, at least 5 feet of space between beds, an ICU with at least 3 beds, a step down ICU with at least 2 beds, a postoperative ward and an in house pharmacy. Hospitals were also required to have diagnostic facilities that included radiology and biochemistry equipment, MRI and CT scan capabilities, a blood bank, and ambulance services. Hospital operating rooms were required to have an array of standard operating equipment.14 Hospitals received a fixed bundled payment based on a reimbursement schedule for more than 400 tertiary care service packages in the areas of cardiology, oncology, neurology, nephrology, neonatology, burn care and trauma care. Since most hospitals are located in urban centres in southern Karnataka while beneficiaries are located in villages as far as several hundred miles away, empanelled hospitals were required to organise health camps in rural areas to screen patients for tertiary care and transport eligible patients to hospitals. Hospitals signed an agreement to conduct these health camps during the empanelment process and received a fixed payment per health camp conducted.
Study design
Following the empirical strategy reported in Sood et al,13 we exploited the phased roll out of VAS to measure its impact on treatment-seeking behaviour. In February 2010, VAS offered insurance to residents in the northern part of the state of Karnataka; in August of 2012, VAS decided to extend insurance coverage to the entire state. During this staggered implementation, we evaluated the programme's outcomes using a quasi-experimental design that took advantage of the arbitrary boundary in VAS coverage. In particular, we conducted surveys in September 2012, and compared outcomes in neighbouring villages on either side of the boundary drawn between the communities chosen for early versus late implementation. Although surveys were conducted after VAS coverage had been announced for the southern part of the state, implementation in southern districts was slow and spillover was minimal. Of the 4000 VAS covered hospitalisations that occurred in our six study districts prior to conducting the surveys, only 140 hospitalisations were from southern districts.
The close geographical proximity within one Indian state of the early and late implementation villages was plausibly unrelated to outcomes of interest. We were thus able to use the geographic discontinuity in order to compare outcomes in VAS-eligible areas to outcomes in adjoining VAS-ineligible areas without introducing selection bias. To reinforce similarity between eligible and ineligible households, we selected treatment and control villages to study by matching on geographic proximity, demographics and socioeconomic status (SES) characteristics. In particular, we used the last available census data (2001) to randomly select 300 control villages using probability proportional to size (population) in the three VAS-ineligible districts just south of the eligibility border (in Shimoga, Davangere and Chitradurga districts) and matched these villages (with replacement) to 272 similar treatment villages in the three districts just north of the eligibility border (Uttara Kannada, Haveri and Bellary). Twenty-four villages were sampled twice and one village was sampled five times. Figure 1 presents a map demonstrating the geographical proximity of the sampled villages. The villages were matched by identifying the ‘nearest neighbour’ based on propensity scores. The census variables used to estimate propensity scores included fraction of population greater than 6 years of age, sex composition of population less than 6 years of age, fraction schedule caste and fraction schedule tribe (historically disadvantaged communities), female literacy rate and population employed. Table 1 shows that treatment and control villages were balanced on all characteristics included in the propensity score models.
Village-level characteristics used for propensity score matching

Study area map (VAS, Vajpayee Arogyashree Scheme).
Study population
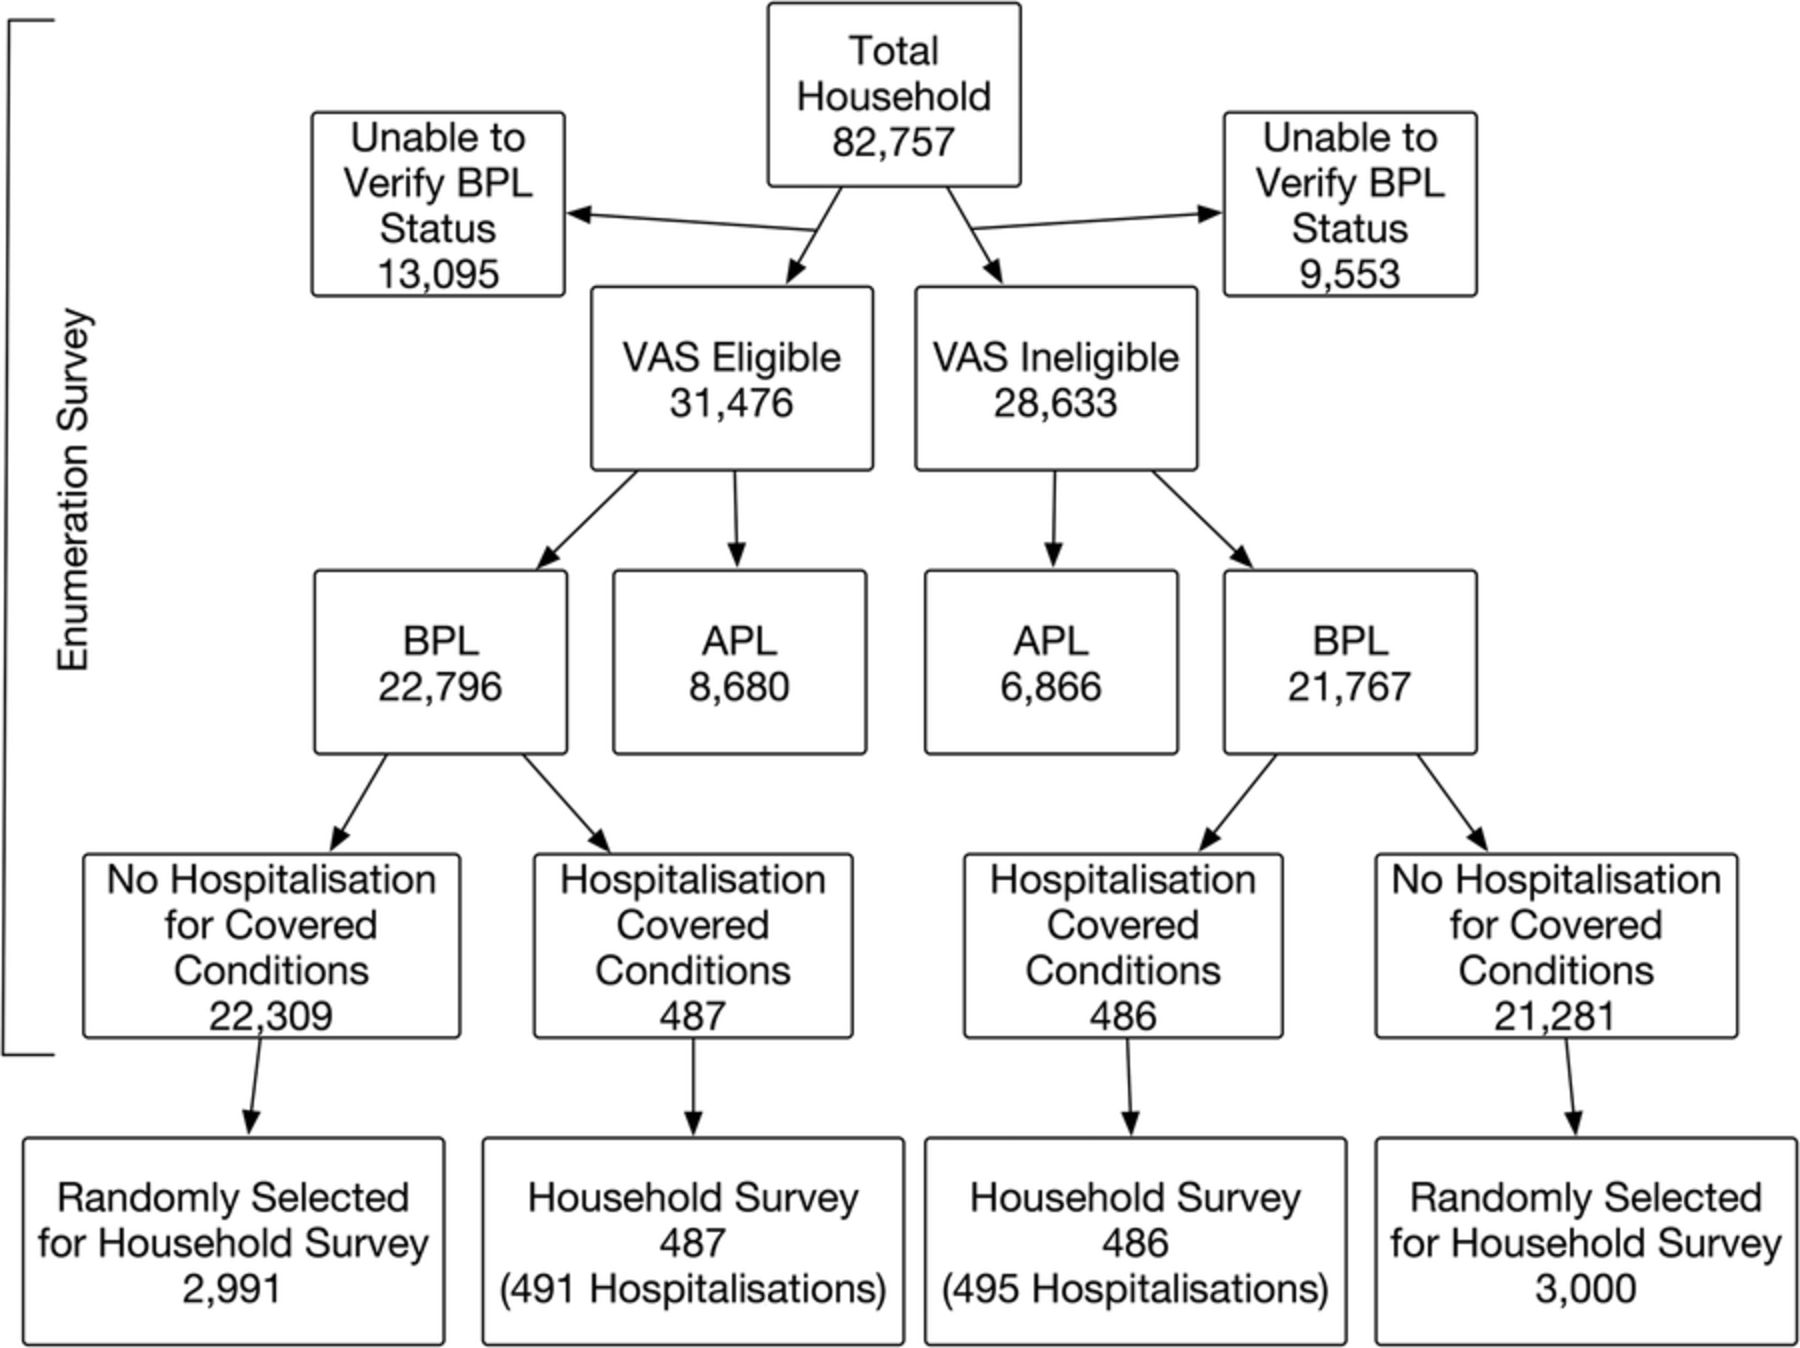
Our study population comes from a random sample of 6964 BPL households in villages eligible and ineligible for VAS with oversampling of households who experienced a hospitalisation for covered health conditions. The sampling process is described in the flow chart (figure 2). In September 2012, we enumerated all households in the selected villages (44 562 and 38 186 households in the VAS-eligible and VAS-ineligible villages, respectively). Respondents were asked for the primary reason for any hospitalisation during the past year from a list of 33 broad conditions; we then conducted an additional survey in all households with a hospitalisation for a potentially covered condition and a random sample of households without a covered hospitalisation. The surveys are further described below.
Flow diagram of sample (APL, Above Poverty Line; BPL, Below Poverty Line; VAS, Vajpayee Arogyashree Scheme).
Data sources
Enumeration survey
All households in sampled villages were asked to participate in a door-to-door survey and 81% of the households completed the survey. Surveyors recorded information on whether or not (1) the household had a state-issued BPL card, and (2) anyone in the household was hospitalised in the past year. All questions were administered in Kannada, the local language. After excluding 22 648 households that claimed BPL status but could not produce the card, we analysed information on 22 796 households in VAS-eligible villages and 21 767 households in VAS-ineligible villages.
Household survey
All households below the poverty line with a hospitalisation for a potentially covered condition, and a simple random sample of households with no covered hospitalisation participated in a detailed household survey. We thus surveyed 487 and 2991 households with potentially covered and no covered hospitalisations, respectively, in VAS-eligible villages; and 486, and 3000 households with potentially covered and no covered hospitalisations, respectively, in VAS-ineligible villages (see figure 2).
The household survey asked respondents (usually the head of household) whether they suffered from any of 16 symptoms including chest pain, back pain, blurred vision, cough for extended period of time that does not respond to treatment, frequent urination, lesions, pain in stool, seizures or fainting, difficulty urinating, vomit blood, weakness, sudden weight loss, oral ulcers, blood in sputum and pain in limbs. If the respondent reported suffering from any of these symptoms, they were asked whether they sought treatment for the symptom. We used this information to develop our measure of medical care use or treatment-seeking behaviour.
Households with a hospitalisation in the year prior to the survey were asked to identify the cause of hospitalisation from a list of 33 causes, translated into laymen's terms. Interviewers were able to verify self-reported cause of hospitalisation with hospitalisation records available at time of interview from about two-thirds of participants. We used this information to identify which hospitalisation were from a VAS covered or non-VAS condition. We used the reported facility where the hospitalisation took place to identify whether tertiary care was likely to be provided.
The household survey asked respondents with hospitalisations to provide details about the facility, staff and their satisfaction with the care provided. Respondents were also asked about posthospitalisation outcomes including infections that occurred and whether they had to be rehospitalised for the same condition. To measure changes in well-being, respondents were asked to rate several aspects of well-being ‘a few days’ prior to the hospitalisation and to rate the same aspects on the day of the survey. Specifically, respondents were asked to rate the following six characteristics from 1 to 5 (5 being the highest level of well-being): ability to conduct usual activities, ability to conduct self-care, walking ability, anxiety level, pain level and overall health status (see online supplementary appendix part 3 for full questions). We used this information to estimate the change in well-being after the hospitalisation.
ASHA survey
In addition to the enumeration and household surveys, the study team interviewed one community health worker (Asha) in each village (sample size=572). We collected village-level information on demographics, socioeconomic characteristics and health behaviours.
Census
We used two existing data sets to characterise differences or similarities between VAS-eligible and VAS-ineligible areas. We used the latest available 2001 census for data on demographic indicators including fraction of population less than 6 years of age, fraction from historically disadvantaged communities (referred to as scheduled caste or tribe), female literacy rate and fraction employed. We used the third round of the District Level Household Survey conducted in our study area between December of 2007 and March of 2008 for data on mortality rates prior to VAS implementation. The District Level Household Survey is an ongoing survey commissioned by the government of India that surveys about 1500 households in each district. We used responses to a question, which asked respondents about any deaths in the family since January 2004 to characterise baseline mortality rates in the study districts.
Statistical analysis
We first evaluated differences between VAS-eligible and VAS-ineligible villages. We focused on differences in demographics, mortality, health-related behaviours, and socioeconomic or development indicators. Demographic indicators were extracted from the 2001 census, and baseline mortality indicators were extracted from the 2007/2008 District Level Household Survey. Indicators for health-related behaviours were extracted from the Asha survey and included whether the majority of men used tobacco or were heavy drinkers. Development indicators were also extracted from the Asha survey and included village availability of piped water, electricity, banks, an all weather road, government primary health centres and private clinics.
Next, we compared the proportion of respondents that sought treatment for any of the 16 recorded symptoms (conditional on experiencing the symptom) in villages that were eligible for VAS to villages that were ineligible for VAS. We combined symptoms into three broad categories in order to increase the power of our estimates. First, we measured differences in seeking treatment for any of the 16 symptoms. Next, we grouped symptoms by whether they were potentially associated with cardiac conditions (eg, chest pain) since (1) a majority of the procedures reimbursed by VAS during the study period were for cardiac conditions and (2) beneficiaries can more easily match the symptom (chest pain) to the disease condition (heart disease) for cardiac conditions. This helps to identify whether any differences are indeed a result of VAS or some other confounding difference between eligible and ineligible villages. We used logit regression models for these estimates and controlled for village-level and household-level characteristics. Village-level characteristics included access to piped water; all weather road in village; distance to nearest town; share of men who are heavy drinkers; share of people who use tobacco; whether there is a primary care clinic, hospital or private health centre; availability of electricity; access to a bank; and literacy rate. Household-level controls included age, gender, income, land ownership, main source of income and self-reported health status. We also included weights to adjust for oversampling of households with hospitalisations. These weights ensure that our analysis is representative of the population in the sampled villages.
Next, we estimated the impact of VAS on posthospitalisation well-being. We estimated this only for hospitalisations resulting from illnesses covered by VAS. Specifically, we measured differences in the change in self-reported well-being from prehospitalisation to posthospitalisation between respondents in eligible versus ineligible villages. Therefore, the dependent variable in this analysis is the difference between the well-being reported a few days before the hospitalisation and the well-being reported the day of the survey. We estimated this effect for all hospitalisations as well as for hospitalisations at tertiary care facilities. The latter are more likely to have been covered by VAS. We used ordinary least squares to control for differences in the composition of illnesses that led to the hospitalisation and for differences in age, gender, income and literacy. In addition to the difference-in-differences analysis described above, we also conducted an analysis of covariance for comparison.
Finally, we measured differences in postoperation infections and rehospitalisation rates. We used logistic regression for these estimates and controlled for illness composition, age, gender, income and literacy. SEs were clustered at the village level in all analyses to account for intravillage correlation in the error term.
Results
Baseline data
We found no pre-existing differences in mortality rates (measured during 2004–2008) between treatment (north of border and eligible for VAS) and control (south of border and ineligible for VAS) villages (table 2). Socioeconomic and health behaviour characteristics were also balanced on all but one measure (table 2). The only significant difference was that a bank was available in a greater proportion of control villages (37.7% compared with 25.7% of treatment villages, p=0.002).
Village-level development and health-related characteristics
Treatment-seeking behaviour
We found that about two-thirds of households reported at least one of the symptoms, but the prevalence of recorded symptoms was nearly identical on either side of the eligibility border. However, households eligible for VAS were 4.4 percentage points (95% CI 0.7 to 8.2; 6.76% increase; p=0.022) more likely to seek treatment for their symptoms (table 3). The increase in treatment seeking was more pronounced and more statistically significant for symptoms associated with cardiac conditions at 4.38 percentage points (95% CI 0.1 to 8.7; 7.04% increase; p=0.046) than for non-cardiac symptoms at 3.92 percentage points (6.4%, p=0.085). Results for cardiac symptoms and the difference between cardiac and non-cardiac symptom were even more pronounced when we controlled for differences in access to health infrastructure, development indicators, demographics and SES. Although the effect of VAS was shown to be larger for cardiac conditions, the difference in effects was not statistically significant.
Fraction of respondents that sought care for symptoms by VAS eligibility
Postoperation well-being
Respondents from VAS-eligible villages reported greater improvements in well-being after the hospitalisation in all categories and they were statistically significant in three of the six categories (walking ability, pain and anxiety; table 4). When we control for illness composition, results are similar; however, when we include controls for demographics and village-level fixed effects, the results reduce slightly in magnitude and significance.
Effect of VAS on postoperation well-being
Postoperative infections and readmissions
There were substantial differences in postoperative infections and readmissions between VAS-eligible and VAS-ineligible hospitalisation (table 5). Respondents eligible for VAS were 6.74 percentage points less likely to report any infection after their stay at a tertiary care facility (95% CI −13.1 to −0.36; 88% reduction) and 15.8 percentage points less likely to have to be rehospitalised after the initial hospitalisation (95% CI −27.7 to −3.9, 48% reduction). Results increased in magnitude when we controlled for differences in illness composition, age, gender, income and literacy between eligible and non-eligible areas, although we lose some statistical power due to the small sample of tertiary care hospitalisation.
Effect of VAS on postoperative outcomes (tertiary care facilities)
Sensitivity analysis
We conducted a series of sensitivity analyses to address potential concerns and sources of bias. The first concern we addressed was the possibility that there was measurement error in illnesses reported as reasons for hospitalisation, which could bias our estimates for quality of care and posthospitalisation well-being. To address this we restricted our analysis to hospitalisations that could be verified through hospitalisation records available at the household (about two-thirds of the full sample). Results were unchanged with this restriction (see online supplementary appendix tables A1 and A2). Next, we estimated models for infections, readmissions and posthospitalisation well-being for non-VAS covered hospitalisations (see online supplementary appendix tables A3 and A4). We expected smaller differences in outcomes across VAS-eligible and VAS-ineligible areas for non-VAS conditions as these hospitalisations were not covered by VAS. However, it is possible to get some spillover effects for non-VAS conditions if VAS patients influenced the hospital choice of patients in the same area or village. For example, a patient with a cardiac condition in a VAS-eligible area might narrate his or her experience to others in their village and thus influence the hospital choice of others with non-VAS conditions. Also VAS empanelled hospitals organised health camps in VAS-eligible villages. It is possible that these health camps increased awareness about VAS empanelled hospitals and thus influenced hospital choice of all patients irrespective of whether their condition was covered by VAS. We found that the magnitude of the point estimates for infections and readmissions were somewhat smaller for non-VAS conditions compared with VAS conditions. However, the estimates are imprecise and statistically indistinguishable from estimates for VAS covered conditions. We get qualitatively similar results for posthospitalisation well-being, with positive but imprecise estimates. Next, we sought to understand the extent to which improvements in posthospitalisation outcomes were driven by changes in patient experience during the hospitalisation. We found that patients in VAS-eligible areas were more likely to reports that (1) the hospital was clean, (2) discharge instruction were given, (3) doctor advised on follow-up care, (4) patient had contact information for the doctor and (5) patients were more satisfied. Patients also reported greater satisfaction with the quality of treatment. Although, these differences are suggestive of improved quality of care for VAS patients; the differences were not statistically significant (see online supplementary appendix table A5).
Finally, it is possible that patients who seek tertiary care in the absence of insurance are sicker or worse off than patients who seek tertiary care that is covered by insurance. Therefore, our estimates of postoperative outcomes could be overstated. To address this, we examine the difference in self-reported preoperative well-being between VAS-eligible and VAS-ineligible areas using the same analytical strategy. We find the opposite, that VAS-eligible hospitalisations had lower self-reported well-being prior to their hospitalisation (see online supplementary appendix table A6). Therefore, any bias in postoperative outcomes driven by preoperative differences is likely driving our results towards the null.
Discussion
Previous work demonstrated that VAS led to increased utilisation of tertiary care along with mortality reductions from covered conditions. This paper adds new insight into why these outcomes may have been observed. First, we demonstrated that there are several pathways through which VAS may have improve health, aside from increasing utilisation of tertiary care services. We have shown that people in VAS-eligible villages were significantly more likely to seek treatment for symptoms, particularly those known to be covered by VAS, which could have led to greater and earlier medical intervention. We also found that VAS patients had better postoperative outcomes and experienced better posthospitalisation well-being. All of these mechanisms help to support the mortality reductions from VAS previously reported.13
Combining our estimates of increased treatment seeking induced by VAS with estimates from prior literature on the probability of myocardial infarction (MI) conditional experiencing chest pain (0.053),15 the relative risk of MI conditional on getting treatment (aspirin, β-blocker, ACE inhibitors and statins; 0.27),16 and the risk of mortality from MI in developing countries (0.33),17 we roughly estimate that VAS's effect on treatment seeking could have led to a 2–6% reduction in mortality from cardiac conditions depending on how many people seeking treatment actually get treatment (see online supplementary appendix part 2 for details on calculation). Prior work reports that VAS led to a 64% reduction in mortality from VAS covered conditions and a 75% reduction in mortality from cardiac conditions. Therefore, although non-trivial, the reduction in mortality generated from increased treatment seeking is likely to have played only a small role in the overall mortality reduction attributable to VAS.
Increased treatment seeking might arise as a result of increased access to otherwise costly tertiary care, which might increase the perceived value of seeking treatment for symptoms potentially requiring tertiary care. For example, poor patients with chest pain might be more motivated to visit a doctor if they know that they do not have to pay out of pocket for any follow-up cardiac surgeries or major procedures. Some of the effects might also be due to health camps organised by VAS that screened patients for conditions requiring tertiary care. In this analysis, we are unable to untangle increased demand for treatment from increased availability of screening. If increased access to screening is driving the increase in treatment seeking we observe, this would imply that mandating empanelled tertiary care providers to implement health screening outreach could be an effective strategy for increasing screening rates and improving health. In any case, such an increase in treatment-seeking behaviour should be taken into account when considering the benefits of programmes similar to VAS as greater diagnosis and treatment of disease can significantly reduce premature morbidity and mortality.
VAS also made a concerted effort to empanel state-of-the-art facilities. Therefore, VAS beneficiaries might have sought care at higher quality facilities than those ineligible for VAS. This might explain why we observe a lower infection rate and better posthospitalisation well-being among VAS beneficiaries. It is also possible that insured patients received better care than uninsured patients within the same facility. Another possibility is that empanelled facilities were able to improve quality as a result of VAS since they might get higher reimbursement for treating poor patients under VAS since such patients are often unable to pay. Such additional revenue could be used to invest in quality infrastructure. This effect has been observed in the USA where expansion of Medicaid was shown to influence the adoption of neonatal intensive care units.18 ,19 Regardless of the mechanism, our findings suggest that access to tertiary care insurance might lead to better quality of care received.
This work has several limitations. First, the study was quasi-experimental in that VAS was not randomly assigned to villages. This posed several methodological challenges, but also presented opportunities for employing rigorous approaches designed to reduce selection bias. The northern portion of Karnataka was selected for coverage because the state government felt that Karnataka's northern regions were in greater need of tertiary healthcare. The extent to which this is true is unknown, but for that reason we selected villages on the southern border of the eligibility area and matched them to villages just south of the eligibility boundary. The baseline data support our assumption that villages just north and just south of the border were similar on relevant characteristics including access to primary care.
Second, we show that VAS-eligible patients that had a tertiary care hospitalisation reported worse well-being prior to the hospitalisation. Therefore, even though our difference-in-differences estimates show a relative improvement in well-being among eligible patients compared with ineligible patients, it is unclear if this is a result of better quality of care as a result of VAS or simply regression to the mean (posthospitalisation well-being was similar between eligible and ineligible patients).
Third, due to data limitations, we cannot untangle whether VAS patients sought care at higher quality facilities or whether they received better quality care within the same set of facilities. However, since VAS empanelled mostly state-of-the-art expensive facilities, we expect that non-VAS patients were not able to afford VAS empanelled facilities at the same rate as VAS beneficiaries, and that the quality difference is occurring across facilities, not within facilities.
Fourth, it is not clear that the increase in treatment-seeking behaviour that we find is a good thing since we are unable to directly link it to better outcomes. If the increased treatment seeking does not lead to better outcomes, then it could be wasteful.
Fifth, we could not measure directly which hospitalisations were covered by VAS, only whether the hospitalisation was related to a condition whose management was potentially covered by VAS. In making this leap, we likely analysed hospitalisations that were outside of the scope of VAS together with the truly covered services, thus diluting our effect size estimates for postoperative outcomes.
Sixth, we are unable to assess whether it was increased demand for treatment (through lower cost and higher value of diagnosis) or increased supply of primary care (through health camps) that increased the share of people who had sought treatment for a symptom. Future work should isolate these two channels by holding one constant.
It was previously demonstrated that VAS created substantial health benefits through reduced mortality. This work shows that mortality reductions are likely a result not only of increased utilisation of covered services, but also increased treatment seeking and access to better quality facilities. Such indirect effects of insurance should be considered when insurance schemes are assessed in the future.
References
Supplementary materials
Supplementary Data
This web only file has been produced by the BMJ Publishing Group from an electronic file supplied by the author(s) and has not been edited for content.
- Data supplement 1 - Online supplement
Footnotes
Contributors NS led all aspects of the study. ZW conducted the analysis and preparation of the manuscript.
Funding This project was funded by the Health Results Innovation Trust Fund at the World Bank and the National Institute on Aging (Grant #T32-AG000246). The grant proposal was peer reviewed for scientific merit.
Competing interests None declared.
Ethics approval The study was approved by the IRB based at the Center for Public Policy, Indian Institute of Management Bangalore. The IRB's NIH Registration Number is IORG0004307.
Provenance and peer review Not commissioned; externally peer reviewed.
Data sharing statement Technical appendix, statistical code and data used in this study are available on request from the corresponding author at nsood@healthpolicy.usc.edu.