Article Text

Abstract
Objectives Obesity has been an alarming public health issue in the UK. Socioeconomic inequalities in obesity have been well-studied, however limited studies addressed inequality trends over time and none of them in Scotland.
Methods We used nationally-representative data from the Scottish Health Survey (SHeS) across four time points between 1995 and 2010/2011. Respondents were economically active adults aged 16–65 years (N=27 059, 12 218 men). Socioeconomic position (SEP) was assessed by highest educational qualification, occupational social class and household income (2003 and 2010/2011 only) as well as a composite SEP score. We carried out sex-stratified logistic regression analyses (adjusted for age, smoking status, alcohol consumption, self-rated general health and physical activity) and we computed the relative index of inequality (RII).
Results Between 1995 and 2010/2011, obesity prevalence increased in both men (from 17% in 1995 to 30.2% in 2010/2011, 2010/2011 OR of obesity compared with 1995=2.07; 95% CI 1.83 to 2.34) and women (from 18.4% to 30.2%; OR=1.85; 95% CI 1.66 to 2.07). Increase in obesity prevalence was observed across all socioeconomic strata, within which the most rapid increase was among males from the highest socioeconomic groups. RII showed that educational inequalities in obesity narrowed for both men (p=0.007) and women (p=0.008). Income inequalities in obesity between 2003 and 2010/2011 in women were also reduced (p=0.046) on the relative scale.
Conclusions Obesity prevalence in Scotland increased substantially between 1995 and 2010/2011, although socioeconomic inequalities have decreased due to the more rapid increase in the higher socioeconomic strata.
- EPIDEMIOLOGY
- PUBLIC HEALTH
- PREVENTIVE MEDICINE
- SOCIAL MEDICINE
This is an Open Access article distributed in accordance with the Creative Commons Attribution Non Commercial (CC BY-NC 4.0) license, which permits others to distribute, remix, adapt, build upon this work non-commercially, and license their derivative works on different terms, provided the original work is properly cited and the use is non-commercial. See: http://creativecommons.org/licenses/by-nc/4.0/
Statistics from Altmetric.com
Strengths and limitations of this study
Large sample drawn from nationally representative surveys over a 16-year period.
The inclusion of multiple socioeconomic position (SEP) indicators and a SEP score.
The response rate reduced in recent years and sample in this study could not be weighted.
Introduction
In Great Britain, adult obesity prevalence increased threefold between 1980 and 2002 with higher prevalence in Scotland than in England.1 ,2 Obesity is closely associated with many morbidities and major chronic diseases including hypertension, cardiovascular diseases, diabetes mellitus, depression and cancer.3 ,4
The association between socioeconomic position (usually defined through educational attainment, occupational class or income) and obesity is well-documented.5–7 A review of the literature in 1989 reported inverse associations between socioeconomic position and obesity for women in most studies, but mixed findings for men and children.5 Another review in 2004 found inverse associations between occupation and weight gain, with less consistent associations for education and income.6 In developed countries, strong inverse associations were observed between SEP and weight gain, people that are socioeconomically disadvantaged are more likely to be obese compared to their advantaged counterparts.7 The socioeconomic disparities in obesity arguably resulted partially from the differences in obesity-related health behaviours such as the choices of diet and levels of physical activities between SEP strata. People from lower socioeconomic background are likely to consume more unhealthy food such as cheaper but high-energy dense food8 but less likely to participate in leisure time physical activity and more likely to be sedentary than their advantaged counterparts.9–11 Education may be linked to obesity through individual's beliefs, knowledge and health behaviours.12 ,13 Occupational status implies influences on weight control through self-autonomy, shared peer beliefs and financial ability.13 Income level represents the material resource available for healthy food and healthy life style as well as advantages in the access to healthcare.13 ,14
Studying the temporal trends of such inequalities will promote a better understanding of potential driving force from the population level. Only few studies have estimated changes in obesity prevalence between socioeconomic strata over time and none of them in Scottish adults. In the UK, Wardle and Boniface15 analysed cross-sectional data sets from Health Survey for England (HSE) between 1993/1994 and 2002/2003, they found a similar increase in obesity prevalence across the socioeconomic groups on the absolute scale. Zaninotto et al16 also reported comparable increases in obesity prevalence for manual and non-manual social classes but predicted a widening inequality trend based on the extrapolation of linear trend in England between 1993 and 2004. Mixed results were reported in non-UK developed countries. In the USA, Zhang and Wang17 found that in spite of the overall increase in obesity prevalence in the general population between 1971 and 2000, socioeconomic disparities in obesity largely reduced over the study period on both absolute and relative scale. In Sweden, a cohort study which followed up 6069 participants for 17 years also showed a decline in inequalities in obesity based on concentration index.18 A relative increase in socioeconomic inequalities in obesity prevalence was found in Belgian men between 1997 and 2004.19
Most studies examining the association between SEP and obesity use only one indicator of SEP.16 ,17 ,20 Different SEP indicators describe different aspects of social gradient and are differentially associated with the population obesity patterning and have different strengths and limitations.6 ,21 ,22 Using multiple SEP indicators provides a more comprehensive picture of how the relative position in the social ladder may be associated with obesity risk allowing better descriptions of the socioeconomic patterning and trends in obesity. Further, composite indicators that are structured using several SEP markers increase accuracy and reduce measurement error compared with using individual markers.23
The aim of the study was to investigate the temporal trends in socioeconomic inequalities in adult obesity in Scottish population between 1995 and 2010/2011 using multiple socioeconomic indicators (education, occupational social class and household income) as well as a composite SEP score. It is hypothesised that socioeconomic inequalities in adult obesity have widened throughout the study period in Scotland. This article is going to investigate the overall trends in adult obesity prevalence in Scotland between 1995 and 2010/2011 and temporal trends in each socioeconomic group as well as in inequalities between SEP groups by commonly used SEP indicators and a derived SEP score. Gender difference is also going to be analysed.
To our knowledge, this is the first study to investigate socioeconomic inequalities in obesity prevalence over time in the Scottish adult population.
Methods and materials
Study sample
This study uses data from the Scottish Health Survey (SHeS) conducted between 1995 and 2011. The survey design has been described in detail elsewhere.24 In summary, a nationally representative sample was drawn from private households in Scotland using a two-stage stratified sampling system with the first stage selected by postcode sectors and the second stage by household address.25 The response rate was 81% over all in 199525 and gradually dropped to 56% in 2011.26 Analyses were performed across four distinct time points (1995, 1998, 2003 and 2010/2011). 2010 and 2011 were combined due to the smaller sample size in the more recent SHeSs. Analyses were restricted to adults aged 16–65 who were economically active to allow the comparison between SEP indicators (highest education, occupational class and income). Non-respondents, refused and armed forces are excluded from the study, given that these numbers include unemployed and unemployed are more likely to belong to lower SEP groups and have a higher prevalence of obesity,27 ,28 the results may be prone to underestimation of overall obesity prevalence rates and for those at lower SEP. In this study, total missing value including unemployed for occupational social class is only 6.7% within the study sample. These are population based surveys over 16-year period with large sample sizes, the effect of excluding unemployed makes minimal impact, therefore study results are deemed robust. Other socioeconomic indicators also have missing value are education (2.6%) and income (13.8%). Body mass index (BMI) is not available in 12.3% of study population. The final sample includes 27 059 men and women, a total 18.5% sample reduction. Details of missing value are included in online S1-supplementary table 1.
Data handling
Obesity
Height (m) and weight (kg) were measured by trained technicians. BMI was calculated by dividing weight in kilograms by height in metres squared. Obesity was defined as a BMI≥30 kg/m2.29
Socioeconomic position
We used three indicators of SEP: education level, occupational social class and household income. Participants education levels were grouped into three levels: (1) Limited/standard grade (grouped together due to small sample size in limited education group)—for those who finished education at age 16 or under; (2) Higher/advanced higher—for those who finished education at age 17 or 18; and (3) Tertiary—for those who finished education at 19 or over. Occupational social class was categorised by Registrar General's Social Class.30 Owing to unequal sample size, the participants were then collapsed into four groups of roughly comparable size: (1) Semiskilled or unskilled manual; (2) Skilled manual; (3) Skilled non-manual; and (4) Professional or managerial. Household income was recorded on the continuous scale from which it was also divided into time point-specific quartiles. To examine the combined power of the three SEP markers, we developed a composite SEP score. Like previously,11 ,31 the composite SEP score was calculated by adding up scores from all three SEP markers (each of them have four groups, coded from 0 to 3). Only a small number of respondents reported limited education, but for the calculation of the composite SEP score limited and Standard Grade level education were separated into two independent groups to make the number of categories comparable with the other SEP indicators. This resulted in a SEP score ranging from 0 to 9. To increase the power, the SEP score was collapsed into four groups to create groups of roughly equal size. All socioeconomic variables in these analyses are coded in ascending order from the most to the least deprived.
Demographic and contextual variables
Information was also collected on age (years), sex, smoking status (never regular smoker, ex-smoker, current smoker), alcohol consumption (never drank, ex-drinker, ≤once every couple of months, 1–2 times a month, 1–4 times a week, 5 or more times a week), self-assessed general health (very good/good, fair, bad/very bad) and self-reported physical activity (no or yes based on if the individual meets UK physical activity guidelines). These variables have been found to be associated with obesity1 ,9 ,10 ,13 ,32–35 and may have changed over time36 and were therefore considered to be potential confounders. Data was also collected on ethnicity which is also associated with obesity.37 However, due to the small ethnic minority population in Scotland the sample size of some ethnic minority groups in the study population were too small (≤0.6%) to be considered as a confounder.
Statistical methods
All analyses were conducted using statistical software STATA11 (StataCrop.2009). Previous studies have found that socioeconomic inequalities in obesity prevalence are stronger and more consistent in women than that in men,13 ,34 therefore analyses were stratified by sex. Descriptive univariate analyses included oneway ANOVA and χ2 tests. Like in previous analyses of this type,38 ,39 multiple logistic regression analyses were conducted to investigate the independent effect of time point (1993 (referent), 1998, 2003 and 2010/2011) on the odds for obesity, which was the outcome. Model 1 was adjusted for age only; model 2 was additionally adjusted for smoking status, alcohol consumption, self-rated general health and self-reported physical activity; and model 3 was also adjusted for socioeconomic position (education, occupational social class, income). Data on income was only available from 2003 onwards, therefore separate regression models were run to test the effect of income and SEP score on the odds of obesity from SHeS 2003 to SHeS 2010/2011. Between SHeS 2003 and 2010/2011, in a separate model, SEP score was adjusted for instead of individual SEP indicators.
To examine the obesity prevalence within each SEP stratum over the study survey period, age-standardised obesity prevalence was calculated following the direct method. The overall study sample (SHeSs 1995, 1998, 2003 and 2010/2011) was used as the standard population distribution. Temporal trends in obesity prevalence within each SEP stratum were estimated by χ2 test and χ2 test for trends.
To measure the magnitude of socioeconomic inequalities in obesity, Relative Index of Inequality (RII) and Slope Index of Inequality (SII)27 ,40–42 were calculated for each SEP marker and the SEP score. RII and SII measure risk ratio and risk difference respectively, they are regression-based index that compare rate of occurrence between those at the lowest SEP level and those at the top. They are used for making socioeconomic comparisons over time in terms of disease prevalence or occurrence.27 ,34 ,40 ,43 ,44 In this analysis, the lowest (most disadvantaged) SEP group was set as the reference group instead of the highest.34 ,42 One of the advantages of RII and SII is that it is not dependent on the comparison groups being equal or roughly equal in size.34 ,40 To achieve this, a Ridit-score45 was calculated as the mid-point of the cumulative distribution of sample in each SEP stratum (percentage participants in the lower SEP level+1/2 percentage participants from the next level up). For example, if the percentage of the sample in the lowest education category was 20%, the Ridit-score for this category would be 10% (20%/2). If the percentage of the sample in the second lowest education category was 30%, the Ridit-score for this category would be 35% (20%+30%/2).40 ,42 There was no significant trend emerged for SII over the study years. Relevant methods and results of SII are shown in online S2-supplementary document and S3-supplementary figure 1.
Age adjusted generalised linear models (log-binomial regression) were used to model RII as guided by Ernstsen et al42 RII was modelled by log arithmic link function. The temporal trends of RII were assessed by adding a two-way interaction term between the Ridit-score and survey years. Gender differences in SEP inequality were assessed by inserting a two-way interaction term between the Ridit-score and gender. To find out if the differences in SEP inequality between genders have changed over time, a three-way interaction term was also included in the model (the Ridit-score by sex and by survey year) including all other two interaction terms. For example, a positive significant result of the three-way interaction term would suggest a bigger increase in RII in women than in men over the study period.41
Results
Descriptive statistics
Table 1 gives the summary of characteristics of participants in each SHeS survey. The total sample size for this study was 27 059 (12 218 men; 14 841 women). During the study period, there was a steady increase in the mean age for both sexes. The mean BMI increased (from 26.3 to 28.0 in men and from 25.9 to 27.9 in women) as did the percentage obese (from 17% to 30.2% in men and from 18.4% to 30.2% in women).
Descriptive characteristics of participants aged 16–65 in Scottish Health Survey 1995, 1998, 2003, 2010–2011
Temporal trends in obesity
Table 2A, B present the multivariable adjusted ORs and 95% CIs of obesity prevalence in men and women from 1995 to 2010/2011 and from 2003 to 2010/2011 respectively. In table 2A, after adjusting for education and occupational social class as well as other known potential confounding factors, the odds of being obese in 2010/2011 were 2.07 (1.83, 2.34) higher than in 1995 for men (p<0.001) and 1.85 (1.66, 2.07) for women (p<0.001). As table 2B shows, the odds of being obese in 2010/2011 was 33–38% higher for male (p values<0.001) and 16% higher for female (p=0.014 and 0.018) compared to 2003, even when analyses were adjusted for household income (model 3a) and SEP score (model 3b).⇓
ORs for obesity in men and women from 1995 to 2010/2011
Age standardised temporal trends of obesity prevalence by SEP indicators
Figures 1 and 2 present the age standard obesity prevalence and temporal trends by SEP indicators for economically active Scottish men and women respectively. There was an inverse gradient in obesity prevalence among education groups with men in higher education groups having lower obesity prevalence (figure 1A). Male obesity prevalence increased in all occupational groups over the study period, with the largest increase between1998 and 2003 seen for the skilled-manual group (from 20% to 26%) and the largest increase between 2003 and 2010/2011 for men doing professional/managerial jobs (from 22% to 31%; figure 1B). Statically significant increases in male obesity between 2003 and 2010/2011 were observed for the top and the bottom income quartiles only (figure 1C) and all SEP groups apart from SEP score 2 (second most deprived; figure 1D). For women (figure 2) similar results were observed for education and occupational social class (figure 2A, B). Between 2003 and 2010/2011, the increase in the prevalence of female obesity by household income were not significant apart from in income quartile 3 (p=0.001; figure 2C), and for composite SEP score an increase was only seen for SEP score 3 (p<0.001; figure 2D).

Age-standardised temporal trends of obesity prevalence in Scottish men aged 16–65 years (95% CI).

Age-standardised temporal trends of obesity prevalence in Scottish women aged 16–65 years (95% CI).
Relative index of inequality
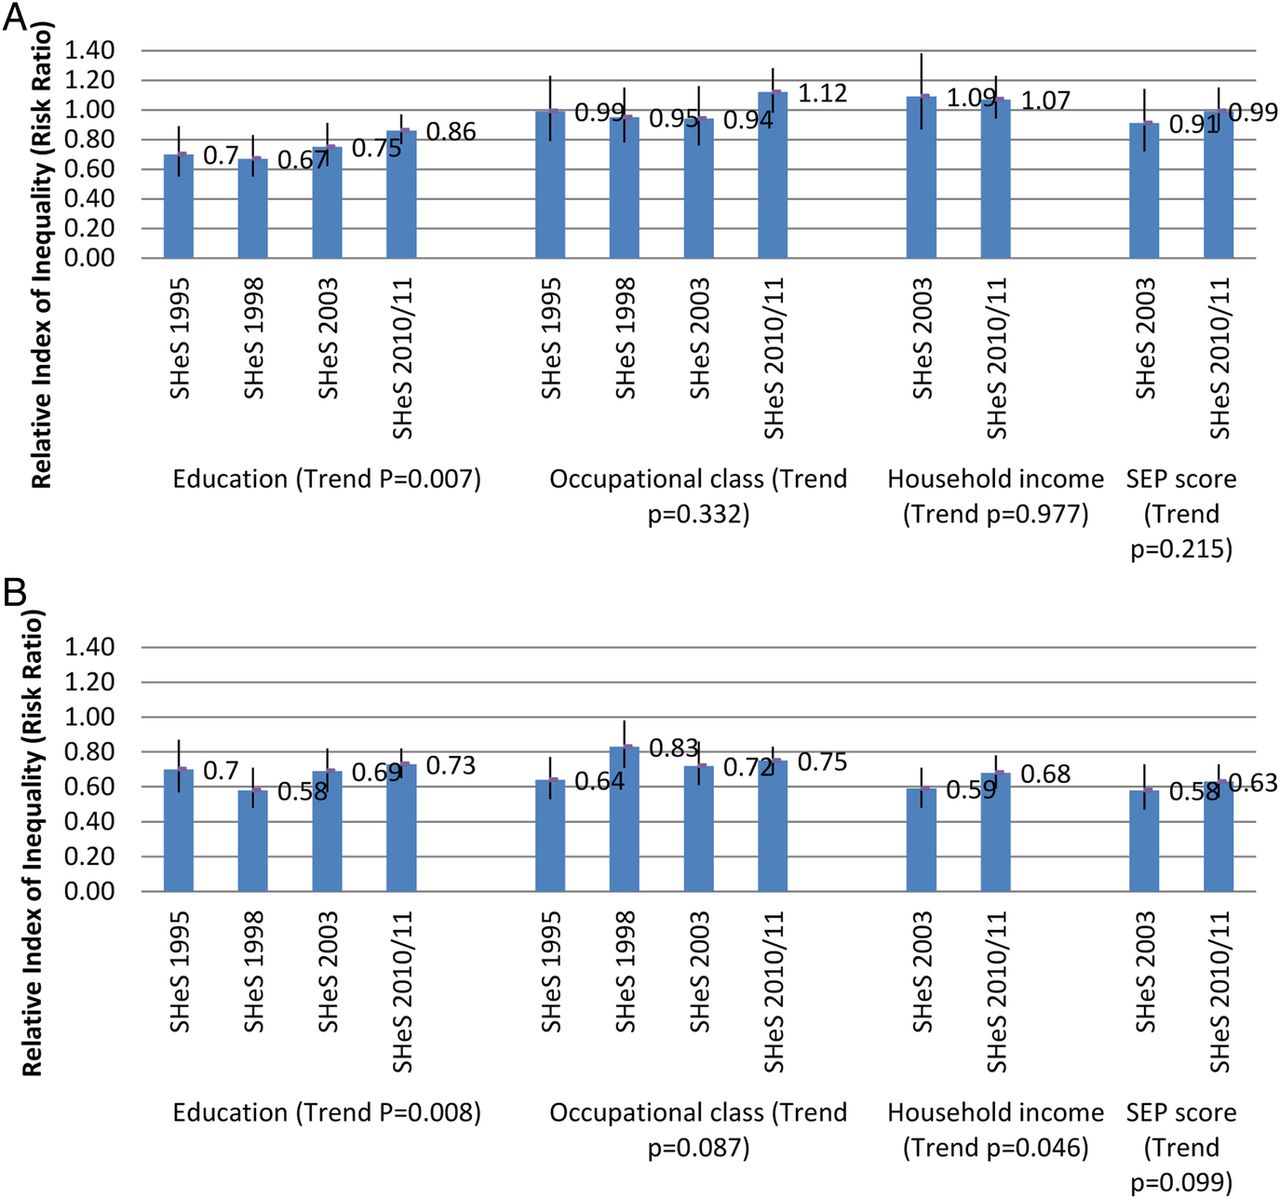
Figure 3A, B present the results of RII and their trends in obesity in males and females, respectively. In men, those in the highest educational category had significantly lower risks of being obese than those in the lowest educational category in all survey years (all RIIs <1; figure 3A). No difference was observed for other SEP indicators. In women, lower risks of being obese were found for those at top SEP compared to their counterparts at the bottom for all SEP indicators in all survey years (all RIIs <1; figure 3B). A reduction in inequality in the risk of obesity over time was seen for education among both men (p=0.007) and women (p=0.008) between 1995 and 2010/2011 as well as for household income among women only between 2003 and 2010/2011 (p=0.046).

Relative index of inequality (RII).
Sex differences
Table 3 illustrates gender differences in socioeconomic inequalities in obesity and their changes over the study period. There was no gender difference in educational inequalities in obesity (all p>0.05). However, there were sex differences when comparing obesity inequalities by occupational social class, household income and SEP score (most RII p values <0.05). The change of socioeconomic inequalities over time was similar for both men and women on the relative scale (all p values >0.05).
Gender differences in RII in obesity and their temporal trends
Discussion
To the best of our knowledge, this is the first study that looked at obesity prevalence and its socioeconomic disparities over time in the Scottish adult population. Obesity prevalence in Scotland was socioeconomically patterned throughout the study period; higher SEP was associated with a lower risk of being obese. Previous experience of targeting obesity prevalence such as promoting healthy diet and encouraging physical activity focused on lower SEP groups.18 The results of this study provided evidence for the broad audience including public health researchers, policymakers, healthcare service providers in inspiring future research studies, shaping healthcare policies and services as well as restructuring living environment that aims to target the current obese epidemic from the population level. On the relative scale, socioeconomic inequalities in obesity in Scotland became narrower between educational groups for both sexes and between income groups for females. This is due to the greater increase in obesity prevalence among the highest SEP groups in recent years (2003–2010/2011). Such results suggest that the effectiveness of current policies and measures in Scotland needs to be re-assessed to target the obese epidemic from population level including those economically better-off.
In line with the findings from previous studies in developed countries and in the UK,16 ,18 the obesity prevalence in Scotland increased markedly between 1995 and 2010/2011. Population aging probably explains part of the reason. During study period, male obesity prevalence increased faster (from 17% to 30.2%) than for females (from 18.4% to 30.2%). The SEP inequalities in obesity were more indicative and consistent in females (significant by all SEP indicators in all years) than in male (only educational inequalities in obesity were significant: RIIs in all years). Gender difference is probably resulted from differences in environment, beliefs, work stress, peer pressure, etc such as in high-SEP groups female concern more about their weight gain than their male counterparts and in manual group physical demand is much higher in male while not exact the same for female.13 Further studies are needed to investigate the exact determinants.
The results from this study reflect that among all three SEP markers, education is the most consistent indicator in revealing obesity patterns. Education is the only SEP marker that does not show differences in predicting SEP inequalities between men and women (see table 3). The robust effect of education is probably due to its relative stability over adult life, easy to collect, less missing value and less measurement bias.17 ,46
Strengths of the study include the large sample drawn from nationally representative surveys over a 16-year period, giving a comprehensive picture of the prevalence, patterns, socioeconomic inequalities and temporal trends in obesity among Scottish adults. The inclusion of three commonly used SEP markers plus a derived SEP score allowed the identification of trends by multiple SEP indicators. The SEP score takes consideration of multiple aspects of socioeconomic disadvantage, hence reducing bias in the results.17
There are a few limitations to this study. The response rate reduced between 1995 (81%) and 2011 (56%) and the sample in this study could not be weighted for non-response due to the unavailability of weight factors in the early SHeS surveys (1995 and 1998). Online S1-supplementary table 1 shows a total 18.5% of sample reduction mainly from missing values in BMI and income. Missing value in occupational social class includes unemployed (6.7%) might cause underestimation of obesity prevalence for those at lower SEP and over estimation of the reduction in SEP inequalities in obesity.
Acknowledgments
ES and NC are funded by the National Institute for Health Research through a Career Development Fellowship (ES).
References
Supplementary materials
Supplementary Data
This web only file has been produced by the BMJ Publishing Group from an electronic file supplied by the author(s) and has not been edited for content.
- Data supplement 1 - Online supplement
- Data supplement 2 - Online figure
- Data supplement 3 - Online table
Footnotes
Contributors JZ designed the project, planned and conducted all analyses, wrote the first draft of the manuscript and rewrote new drafts based on input from coauthors. NC supervised and designed the project, planned the analyses and gave input on manuscript drafts. ES conceived the initial idea and supervised and designed the project, planned the analyses and gave input on manuscript drafts. All authors read and approved the final version of the manuscript.
Funding This research received no specific grant from any funding agency in the public, commercial or not-for-profit sectors.
Competing interests ES and NC are funded by the National Institute for Health Research through a Career Development Fellowship (ES).
Ethics approval Scottish Health Survey (SHeS) has been approved by a Multi-Centre Research Ethics Committee.
Provenance and peer review Not commissioned; externally peer reviewed.
Data sharing statement SHeS data sets are publically accessible and can be downloaded from UK data service at http://www.data-archive.ac.uk. No additional data available. Researchers are not required to obtain ethical approval to carry out their studies using the data.
Linked Articles
- Corrections