Article Text

Abstract
Objectives Low levels of physical activity may have considerable negative effects on bone health in adolescence, and increasing screen time in place of sporting activity during growth is worrying. This study explored the associations between self-reported screen time at weekends and bone mineral density (BMD).
Design In 2010/2011, 1038 (93%) of the region’s first-year upper-secondary school students (15–18 years) attended the Tromsø Study, Fit Futures 1 (FF1). A follow-up survey (FF2) took place in 2012/2013. BMD at total hip, femoral neck and total body was measured as g/cm² by dual X-ray absorptiometry (GE Lunar prodigy). Lifestyle variables were self-reported, including questions on hours per day spent in front of television/computer during weekends and hours spent on leisure time physical activities. Complete data sets for 388/312 girls and 359/231 boys at FF1/FF2, respectively, were used in analyses. Sex stratified multiple regression analyses were performed.
Results Many adolescents balanced 2–4 h screen time with moderate or high physical activity levels. Screen time was positively related to body mass index (BMI) in boys (p=0.002), who spent more time in front of the computer than girls did (p<0.001). In boys, screen time was adversely associated with BMDFF1 at all sites, and these associations remained robust to adjustments for age, puberty, height, BMI, physical activity, vitamin D levels, smoking, alcohol, calcium and carbonated drink consumption (p<0.05). Screen time was also negatively associated with total hip BMDFF2 (p=0.031). In contrast, girls who spent 4–6 h in front of the computer had higher BMD than the reference (<2 h).
Conclusions In Norwegian boys, time spent on screen-based sedentary activity was negatively associated with BMD levels; this relationship persisted 2 years later. Such negative associations were not present among girls. Whether this surprising result is explained by biological differences remains unclear.
- EPIDEMIOLOGY
- PUBLIC HEALTH
This is an Open Access article distributed in accordance with the Creative Commons Attribution Non Commercial (CC BY-NC 4.0) license, which permits others to distribute, remix, adapt, build upon this work non-commercially, and license their derivative works on different terms, provided the original work is properly cited and the use is non-commercial. See: http://creativecommons.org/licenses/by-nc/4.0/
Statistics from Altmetric.com
Strengths and limitations of this study
Large, representative population-based study.
High attendance at the first and second wave of the study.
Consistency in findings between associations over time, and with previous observations for boys.
The use of self-reported instruments for important determinants.
Lack of information on non-screen-based sedentary behaviour.
Introduction
The last decades have introduced rapid changes in use of technological devices for work, study and entertainment. The population’s opportunity to be sedentary, rather than active, has increased, and children, adolescents and adults are spending more time in front of different screens than ever.1 ,2
The negative health effects of sedentary behaviour are a case for concern, especially during childhood and adolescence, a vulnerable time of life. The concept sedentary behaviour refers to activities that result in levels of energy expenditure slightly above resting level. In contrast, light physical activity such as walking slow, cooking, doing the dishes, etc, involves energy expenditure at higher levels.3–5
Some studies distinguish between various types of sedentary behaviour. Social activities such as talking or hanging around, reading and playing musical instruments, and motorised travelling, are regarded as non-screen-based sedentary behaviour, whereas watching television (TV) and videos or playing traditional video games are regarded as screen-based sedentary behaviour.6
As increasing screen time during growth may replace time spent on sports and play,7 it is possible that adverse health outcome may follow. Physical activity's positive effect on adolescents’ health in general is well stated,8 and so is its positive association to bone health measured as bone mineral content (BMC), bone mineral density (BMD), bone size and strength.9–11 Several reviews have synthesised the deleterious effect of TV viewing linked to obesity, metabolic changes, cardiovascular fitness as well as psychosocial health in youth.4 ,12 By contrast, only a few studies have investigated screen-based sedentary behaviours’ effect on bone. Results from existing cross-sectional studies vary as the measurement of exposure and outcome differ,13–16 and longitudinal data are lacking.
A prospective cohort study among girls reported higher TV viewing time during weekends compared with weekdays. During follow-up, TV viewing time increased both on school days and on weekends, but to a greater extent during weekends.17 As adolescence is a time of increasing independence and adoption of new behaviours, we regarded screen time spent during weekends (ScTWends) as the best expression of the participants preferred pastime with a plausible effect on health.
In this study, we explored the associations between hours of ScTWends and BMD levels among adolescents participating in Fit Futures 1 (FF1), as well as the persisting association with repeated bone measurements 2 years later, in Fit Futures 2 (FF2).
Methods
Study population and design: Fit Futures
The Tromsø Study18 is a population-based study with repeated health surveys in the municipality of Tromsø inviting all residents in specific age groups. Fit Futures is an expansion of the Tromsø Study, in collaboration between the University Hospital of North Norway (UNN HF), UiT The Arctic University of Norway and the National Public Health Institute. In 2010/2011, all first-year upper-secondary school students in the two neighbouring municipalities Tromsø and Balsfjord were invited to participate in the cross-sectional study FF1.19 The invited cohort included 1117 participants aged 15–19 years, of which 1038 adolescents (530 boys) attended the survey, providing an attendance rate of 92.9%. This paper includes participants younger than 18 years in FF1 (469 girls and 492 boys). A second wave of the survey, FF2, carried out in 2012/2013, invited all the third-year students to a follow-up. In total, 820 students attended, providing repeated BMD measurements in 372 girls and 316 boys, that is, 66% of the original cohort. Information of the study was given in classrooms; written information was handed out and also distributed through the schools’ websites. Participants 16 years and older signed a declaration when arriving at the study site, and younger participants had to bring written permission from their guardians. Dedicated research technicians performed the examinations in a well-established research unit at UNN HF.
Measurements
The main outcomes in the present study were BMD at the total hip, femoral neck and total body measured as g/cm², by dual X-ray absorptiometry (DXA; GE Lunar prodigy, Lunar Corporation, Madison, Wisconsin, USA), with enCORE paediatric software.20 At arrival, information on pregnancy was obtained through a clinical interview. In cases of possible pregnancy, those participants were excluded from DXA scanning.
Height and weight were measured in all participants to the nearest 0.1 cm and 0.1 kg on an automatic electronic scale, the Jenix DS 102 stadiometer. Measurements were performed according to standardised procedures in the Tromsø Study, wearing light clothing without shoes. Body mass index (BMI) was calculated as weight (kg) divided by height squared (m2). Non-fasting blood samples were drawn and analysed for serum 25 hydroxy vitamin D levels.21
Questionnaires
Screen-based sedentary behaviour in leisure time was examined through two questions: “How many hours per day do you spend by the PC, watch TV, DVD etc, outside school during weekends?”, correspondingly “…during weekdays?”. The alternatives were (1) “None”, (2) “About half an hour”, (3) “About 1 to 1.5 hours”, (4) “About 2 to 3 hours”, (5) “About 4 to 6 hours”, (6) “About 7 to 9 hours” or (7) “10 hours or more”. We categorised the information into 0–2, 2–4, 4–6 and >6 h per day of ScTWends. We estimated time per day as follows: (1)=0 h, (2)=0.5 h, (3)=1.25 h, (4)=2.5 h, (5)=5 h, (6)=8 h and (7)=10 h for continuous variables of ScTWends and screen time during weekdays (ScTWdays), separately.
Following the Gothenburg instrument,22 the participants rated their time spent on physical activity in an average week during the past year. They graded their physical activity as (1) sedentary activities only, (2) moderate activity such as walking, cycling or exercise at least 4 h/week, (3) participation in recreational sports at least 4 h/week or (4) participation in hard training/sports competitions several times a week.
Sexual maturation was based on girls’ menarche age and boys’ rating at the Pubertal Development Scale (PDS).23 The boys rated four secondary sexual characteristics on a scale ranging from (1) not yet started, to (4) complete.
The variables on smoking habits and alcohol consumption are fully described elsewhere.19 Participants who reported no alcohol intake were compared with those who reported ‘sometimes’; ever smokers were compared with never-smokers.
Nutritional information was collected by a food frequency questionnaire on daily calcium and soft drinks. As calcium intake in Nordic population in general is sufficient,24 we estimated calcium consumption separating low consumers, with potential inadequate calcium levels, from the rest. The questions were: “How often do you usually eat cheese (all kinds)”, and four similar questions about dairy drinks, with amount and frequency. We dichotomised the calcium consumption into “Low”, not eating cheese once a week or not drinking milk daily; and “Sufficient”, when having cheese weekly or milk daily.
For information on carbonated drinks consumption we asked: “How often do you usually have soft drinks with sugar (a ½ litre bottle equals 2 glasses)?”, and correspondingly “…soft drinks with artificial sweetener…?”. Participants rated drinking frequency and amount from 1 (rarely/never) to 5 (four or more glasses per day), which we categorised as “Rarely”, “1 glass per day” or “≥2 glasses per day”, respectively.
Statistics
As bone mass acquisition varies between girls and boys,19 all statistical analyses were stratified by sex. Student t test and Pearson’s χ2 test were used to compare baseline characteristics. Next, we checked the normal distribution for screen time variables and their correlation to possible bone mass determinants. We compared means and trends of the determinants, stratified for screen time, by analysis of variance with the Bonferroni correction for multiple comparisons and Pearson’s χ2 test.
The association between screen time and BMD was first explored in univariate linear regression models. Then, multivariable regression was performed including adjustments for age, BMI, height, sexual maturation, leisure time physical activity, smoking habits and alcohol consumption. Possible confounders such as serum levels of vitamin D, calcium intake and carbonated drink consumption were also included. Hormonal contraceptives and ethnicity were not included in the models since we found no association with bone density in this study population.19 Finally, the models were adjusted for ScTWdays. All variables were checked for normality before entering the models. Residual analyses (histogram, normal P-P Plot and residual plots) were used to assess linearity, normal distribution and variance heterogeneity, and multicollinearity was assessed with variance inflation tests. All analyses were performed using the Statistical Package of Social Sciences software (SPSS V. 22) and all values of p<0.05 were considered significant.
Results
Boys spent more time in front of computers and TV than girls; mean 5.1 (SD 2.7) and 3.8 (2.2) hours per day in weekends and weekdays, respectively, compared with 4.0 (2.3) and 3.2 (2.0) hours in girls (p<0.001; table 1).
Characteristics of the study participants aged 15–18 years, The Tromsø Study, Fit Futures 1
Reported ScTWends were positively correlated with ScTWdays (approximately 0.6, p<0.001). The distribution of ScTWends is displayed in figure 1. For ScTWdays, the pattern is quite similar, with the curve drawn slightly more to the left (not shown). As illustrated in figure 2, there was a trend of decreasing BMD levels across ScTWends; however, the trend was statistically significant only in boys in FF1 (p<0.05).
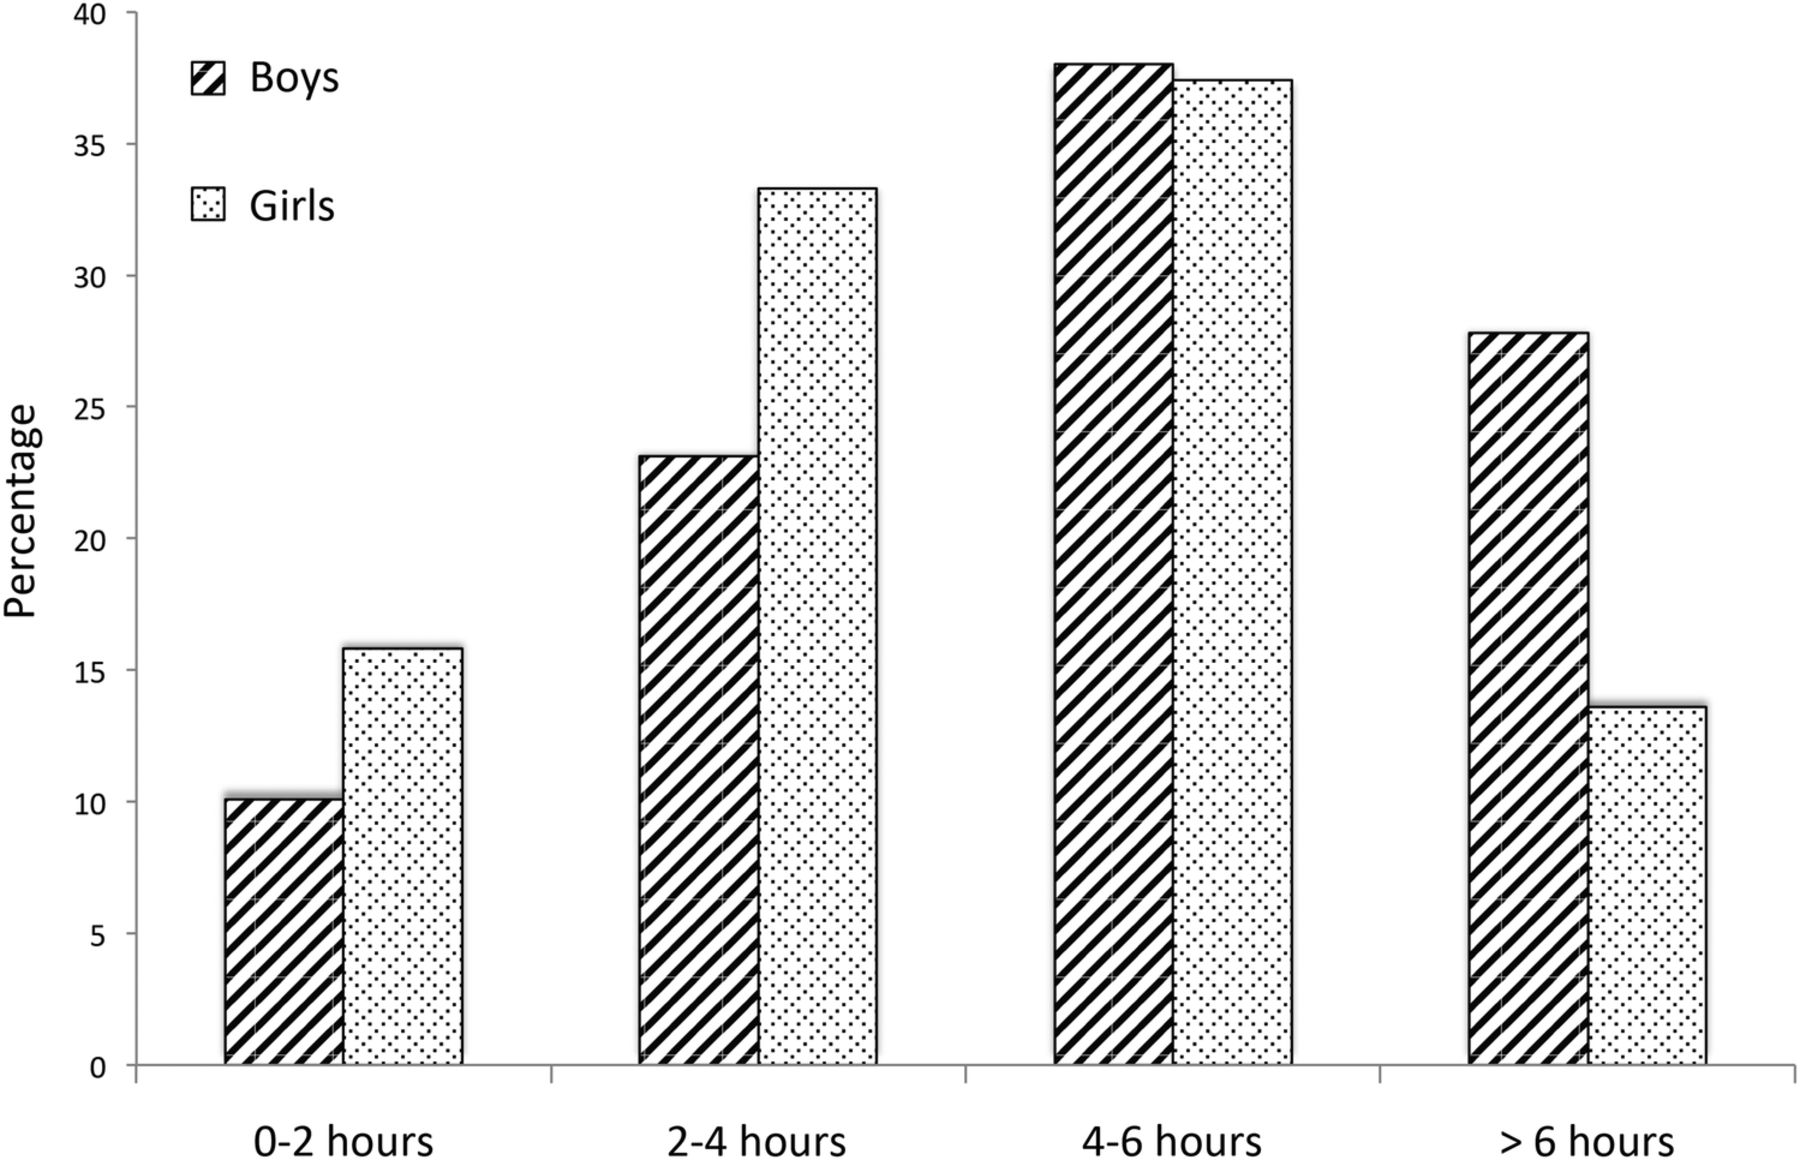
Distribution of leisure time computer use during weekends, for girls and boys aged 15–18 years, The Tromsø Study, Fit Futures 1.

Mean bone mineral density (BMD) levels with trend lines in relation to leisure time computer use during weekends at total hip, femoral neck and total body for boys and girls aged 15–18 years at Fit Futures 1 (FF1) and Fit Futures 2 (FF2), respectively.
As illustrated in table 2, physical activity levels were adversely related to ScTWends (p<0.001). However, 20% of the girls and 26% of the boys who reported more than 4 h daily in front of the screen during weekends also spent more than 4 h/week on sports and hard training. Vitamin D levels were inversely related (p≤0.027), whereas carbonated drink consumption was positively related to screen time, although not statistically significant for soft drinks with artificial sweetener (p≤0.058). Among boys, BMI levels were positively related to screen time levels (p=0.002).
Lifestyle across screen time levels during weekends for adolescents aged 15–18 years, The Tromsø Study, Fit Futures 1
The univariate analyses (table 3) showed contrasting relationships; higher ScTWends was adversely associated to BMD at all sites in boys (p<0.05), while in girls there was a positive association, which was only statistically significant at the femoral neck.
Associations between screen time weekends and BMD at different sites in 15–18 years old girls and boys, at FF1 (2010/2011) and FF2 (2013/2013)
In linear multiple regression models, exploring associations between ScTWends and BMD measured at FF1 with adjustments for age, sexual maturation, ScTWdays, together with other possible confounders, this tendency became more evident. In boys, 2–4 or more than 6 h in front of the screen was associated with lower BMD at the femoral sites, with a statistically significant reduction of approximately 0.060 g/cm2 (p≤0.035) compared with counterparts with less than 2 h ScTWends. Also in the 4–6 h category, the associations were negative, but non-significant. By contrast, in girls, ScTWends was associated with higher BMD levels; at femoral neck, an increase of at least 0.046 g/cm2 (p=0.007), and at total body with 0.023 g/cm2 (p=0.025) for the 4–6 h category. Extensive analyses with ScTWends in three categories (cut-off at 2.5 and 5.0 h) and as a continuous variable showed mainly the same pattern of negative β values for boys and positive β values for girls, although not statistically significant (data not shown).
In follow-up analyses of BMD levels measured at FF2, the consistent patterns of associations persisted, although the associations were weaker and only statistically significant at the total hip in boys.
Discussion
Summary
To our knowledge, this is the first study to present associations between bone mass and screen-based sedentary behaviour with repeated measurements. At FF1, ScTWends was negatively associated with BMD in boys and positively in girls. This contrasting pattern persisted in 2 years follow-up analyses.
Previous cross-sectional studies have examined these associations to BMC at different sites. Vicente-Rodríguez et al13 indicated that TV watching of more than 3 h a day was associated with an increased risk for low whole body BMC in Spanish boys aged 13–18.5 years. Moreover, results from the HELENA study demonstrated negative associations of young boys’ use of internet during non-study time and total body BMC,14 and recently Chastin et al15 concluded that boys’ screen-based sedentary behaviour was negatively associated with femoral BMC. All these studies used self-reported data on screen-based sedentary behaviour, and the latter two also included adjustments of sedentary behaviour patterns measured objectively. As far as we know, no standardised questionnaire on screen-based sedentary behaviour exists. Even if the questions of the independent variable were to be addressed in different ways, all studies including the present one, reported adverse relationships between the boys’ screen behaviour and bone mass, which may indicate true findings. Adjustments for objectively measured physical activity in some of the studies14 ,15 also support such conclusion.
To our knowledge, no other study suggests positive associations between bone mass and girls’ TV and computer use, when physical activity levels are taken into account. In contrast to our findings in girls, Gracia-Marco et al14 reported non-significant negative associations between different screen-based activities and femoral neck BMC, before and after adjustments for lean mass and objectively measured physical activity. Also, Chastin et al15 reported that the time girls spent on screen-based sedentary behaviour was negatively associated with femoral and spinal BMC. However, after adjustments there was a positive—although not statistically significant—association in concordance with our findings.
Longitudinal studies on the association between body composition and bone mass, in childhood and adolescence, indicate a positive effect of lean mass,25–27 whereas both protective and adverse effects of obesity on bone have been reported.28 These conflicting results may be related to different factors, as the relationship between fat and bone varies with age and hormones.29 Streeter et al25 suggest a gender effect, as percentage of body fat seems important for girls BMD levels only. A positive trend of BMI across screen time levels, interpreted as decreased lean mass and increased fat mass, could possibly be more harmful for boys, supporting the results observed in the present study.
The boys in the 4–6 h group tended to have higher BMD levels than expected. This could be attributed to the relatively higher BMI levels combined with more intensive physical activity levels in this group. Physical activity is a strong predictor of bone mass,9 and it is likely that the high levels of physical activity also contributed to increased lean mass and BMI levels, with a positive effect on the BMD levels.
However, girls in the 4–6 h category had the highest BMD levels. This group had similar BMI and vitamin levels to those reporting less screen time, but they reported lower physical activity levels than their peers with lesser screen time. As fat mass may have a positive effect on female bones,25 this could explain the higher β values seen in this group.
An explanation for the 4–6 h category's favourable association with BMD levels, compared with less than 2 h ScTWends, may probably be that this category consists of the ‘normal’ adolescents, with a rather healthy lifestyle. Physical inactivity and sedentary behaviours are regarded as two different constructs,3 and in our study population, many adolescents who reported high levels of sedentary behaviour were also physically active and this balanced the adverse effects of sedentary behaviour on bone.
The low adjusted R2 in univariate analyses indicated that ScTWends only explains a small proportion of the variance in BMD. However, considering the robustness to adjustments and consistency with previous findings, the construct ‘screen time’ seems to be a marker for bone health.
Some studies suggest that energy expenditure is potentially higher when playing videogames, which equals mild-intensity exercise,30 compared with resting metabolic rate when quietly lying watching TV.31 However, we have no information on screen time distribution between different devices, which may have caused information bias.
Spending most of your spare time in front of the screen may be regarded negatively among adults, and it is possible that the young students under-reported screen time. However, it is also possible that social pressures may lead young people to over-report screen time. Measurement errors in both directions are therefore possible, which would have attenuated our estimates.
Moreover, adolescents’ answers may differ according to gender. A Canadian study on sedentary behaviour concluded that male students were less likely than female students to report high communication time, that is, talking on the phone, texting and instant messaging.32 This could explain the gender-specific difference in multimedia and screen modalities usage in the present study, as it might have been easier for boys to make a precise statement of time spent in front of the screen. Girls tend to perform several activities at one time. Small screen recreation such as watching TV, videos and playing video games, combined with light physical activity such as sitting down writing, or working on hobbies and crafts, is not unusual, neither is media multitasking.33 However, no information about such non-screen-based sedentary activities was available for the present study. A reliability and validity study of the HELENA sedentary questionnaire used by Gracia-Marco et al,14 concluded that their screen time-based sedentary questionnaire is reliable, but better reflects the sedentary behaviour of boys compared with girls.34 The authors suggest that questionnaires on young people’s sedentary behaviour should include different types of sedentary activities, including non-screen-based sedentary behaviour, to correctly classify the most sedentary participants.
Strengths and limitations
The main strength of this large representative youth study is the considerable participation rate, including repeated BMD measurements of 66% of the original cohort.
The consistency between the negative associations described for boys at baseline and at 2 years follow-up, as well as the consistency compared with previous observations, strengthen the study. Boys lost to follow-up had no statistically different values according to screen time, BMD or other determinants measured at FF1, which makes our estimates more robust. On the other hand, dropout girls had higher BMI, lower BMD values and reported significantly higher screen time during weekends at baseline. Among these girls, there were more daily smokers, and they consumed alcohol and carbonated soft drinks more frequently. Such differences between the groups point towards higher β values for FF2 in girls, which, however, was not the case.
Though these are important strengths, some limitations should be noted. Memory and recall skills are known limitations of self-reported instruments. The self-reported screen time questionnaire without classification of different screen modalities made rough estimates of the independent variable, and the lack of information of non-screen-based sedentary behaviour may have introduced residual confounding.
Conclusion
For young boys, self-reported time spent on screen-based sedentary activity was negatively associated with BMD levels; this relationship persisted 2 years later. Such negative associations were not present among girls.
Implications
Increasing screen time during growth may replace time spent on sports and play,7 and physical activity and TV viewing are regarded as independent predictors of health.35 Thus, it is important to distinguish between the effects of sedentary and light-intensity physical activity on bone when we are providing reasonable health advice. Our study suggests persisting associations of screen-based sedentary activities on bone health in adolescence. This detrimental association should therefore be regarded as of public health importance and followed closely, since improvement of peak bone mass is possible.36
The relevance of international guidelines’ recommendation of no more than 2 h screen time a day for children and adolescents,37 ,38 which is much lower than reported by others and us, should be discussed thoroughly and compared to the importance of physical activity for bone health. For further research objectively measured data of sedentary behaviour and physical activity would be preferable, but more difficult to carry out. As a proxy for objectively measured data, we are in need of reliable and valid self-reported instruments to discriminate at the lower end of the activity continuum for girls as well as for boys.
Acknowledgments
The authors are grateful to the study participants, the staff at the Clinical Research Unit at University Hospital of North Norway (UNN HF) and the Fit Futures administration for conducting the study. They also thank The Norwegian Osteoporosis Association for supporting paediatric software.
References
Supplementary materials
Press release
Press release
Files in this Data Supplement:
Footnotes
Contributors AW and NE contributed to the conception and design, the acquisition, analyses and interpretation of the data, as well as drafting and revising the paper. A-SF, GG and RJ contributed to study design and data acquisition. ED made a substantial contribution to the conception and design, as well as analyses and interpretation of the data together with LAA and OAN. In drafting and critically revising the paper, ED, LAA, A-SF, OAN, GG and RJ also made substantial efforts. All the authors have provided final approval of the submitted manuscript.
Funding This work was supported by Northern Norway Regional Health Authority (Helse Nord RHF), ID6877/SFP1053-12.
Competing interests None declared.
Ethics approval The Norwegian Data Protection Authority (reference number 2009/1282) and The Regional Committee of Medical and Health Research Ethics (2011/1702/REK Nord) approved the study in July 2010 and October 2011, respectively.
Provenance and peer review Not commissioned; externally peer reviewed.
Data sharing statement The data set may be available by request to the Tromsø Study.