Article Text

Abstract
Objectives In order to improve antimicrobial (AM) use, a policy of providing technical and financial support to AM management teams (AMTs) was rolled out in all Belgian hospitals between 2002 and 2008. We aimed to analyse the association of this policy with AM use for the two indications accounting for the largest number of patients receiving AM: prophylaxis for major lower limb orthopaedic surgery and pneumonia.
Design, setting, participants We used patient-level data routinely collected in all Belgian acute care hospitals between 1999 and 2010. We modelled trends for selected quality indicators (QIs) using the year of AMT implementation in each hospital as the main ‘change point’, with fine-tuned case-mix adjustment. Of all admissions for lower limb orthopaedic surgery, and pneumonia between 1999 and 2010, 90% (325 094) and 95% (327 635), respectively, were found eligible for analyses.
Outcomes The surgery QI was defined as: cefazolin, dose in the expected range, and no use of other AM. For pneumonia, QIs were: ratio of oral/parenteral defined daily doses (DDD, O/P QI), and mean number of DDD minus penicillin, per 100 days of hospitalisation (DDD QI).
Results Between 1999 and 2010, the surgery QI improved from 59% to 71%, the O/P QI from 0.72 to 0.97, and the DDD QI from 96 to 64. Heterogeneity between hospitals was high. Overall, no association was found with the year of implementation of the AMT.
Conclusions Improvements have been observed but could not be related at the national level to the policy under study. However, these results cannot be extrapolated to other QIs for AM use in hospitals. Our findings do not question the need for AMT, nor the need for continuation of AMT funding. Several recommendations can be made in order to make the best of Belgium's unique political and financial commitments in that field.
- EPIDEMIOLOGY
This is an Open Access article distributed in accordance with the Creative Commons Attribution Non Commercial (CC BY-NC 4.0) license, which permits others to distribute, remix, adapt, build upon this work non-commercially, and license their derivative works on different terms, provided the original work is properly cited and the use is non-commercial. See: http://creativecommons.org/licenses/by-nc/4.0/
Statistics from Altmetric.com
Strengths and limitations of this study
-
First study to evaluate a national policy of implementing and financing antimicrobial management teams in hospitals with a longitudinal study design.
-
Exhaustive database on all admissions in Belgian hospitals over 11 years for the indications accounting for the largest number of patients receiving antimicrobials in hospitals (antimicrobial prophylaxis for lower limb orthopaedic surgery, pneumonia).
-
Fine-tuned case-mix adjustment when comparing hospitals before/after, and with/without the policy, taking into account the possible time lag between implementation and results.
-
Quality indicators selected for this study measure some important aspects of quality, but fall short of providing a global picture of overall quality of antimicrobial use in hospitals. This is intrinsically complex, and other indicators might provide different results.
-
This study has shown no overall impact of the policy on national trends, but has not investigated the factors that determine success or failure at hospital level.
Introduction
The inappropriate use of antimicrobials (AM) and its consequences in terms of infections due to AM-resistant microorganisms represents a major public health problem.1 Although the largest part of AM consumption takes place in the community,2 the risks are concentrated in hospitals: 35% of hospitalised patients in Europe3 and 52% in the USA4 are taking an AM. Over one-third of prescriptions might not be compliant with evidence-based guidelines.5 AM stewardship, conducted by AM management teams (AMTs), is a key strategy to improve AM prescribing, to ensure effective treatment of patients and to reduce AM resistance in hospitals.6 The need for a legal basis, regulatory mechanisms and funding for AM stewardship programmes and research are widely endorsed.7 ,8
Belgium has been a pioneer in this field. The Belgian Antibiotic Policy Coordination Committee (BAPCOC) was created in 1999 in order to improve AM use in Belgium and has been very active since then at different levels.9 Since July 2007, all acute care hospitals in the country have been receiving financial and technical support for hiring a trained manager for their AMT; the initiative was first piloted in 37 voluntary hospitals (2002), then extended to another 24 hospitals (2006), and finally to the remaining hospitals (55) in 2007. Apart from funding, the intervention included technical guidance and advanced specialist training for the formal establishment and follow-up of AMTs. However, hospitals were not given targets, and were left to devise their own interventions and themes. A self-reporting survey was conducted in 2007. Antibiotic stewardship tools used by AMTs included (non-exhaustive list): an antibiotic formulary (96% of hospitals), practice guidelines for antibiotic therapy and surgical prophylaxis (92%, and 96%, respectively), a list of restricted AM agents (76%), sequential intravenous/oral therapy with equivalent bioavailability (79%).10 The minimum composition, mandate and tasks of hospital AMT have a legal basis since 2008. The largest part of the BAPCOC budget now goes to staffing and technical support for AMT in all Belgian acute hospitals.9 To the best of our knowledge, Belgium has been the first country to provide hospitals with structural, earmarked funding for AMT, making the experience a test case for such a policy.
The objectives of our study were to analyse the association of this policy with trends of selected quality indicators (QIs) for AM use in hospitals. We focused on the indications accounting for the largest number of patients receiving AM.
Methods
Source of data and QIs
We obtained patient-level data routinely collected between 1999 and 2010 in all Belgian acute care hospitals for pathology-based financing purposes. These include the all-patient-refined diagnosis-related group (APR-DRG, V.15) and associated severity of illness (SoI, 1–4)11 as well as details on each AM used during the stay (molecule, dose and route of administration); however, the timing of AM administration is lacking. The SoI for the hospital stay is assigned following a complex computerised algorithm that takes into account the patient's primary and secondary diagnoses, procedures and age (the underlying clinical principle is that patients with a high SoI are characterised by multiple serious diseases or illnesses).11
We used the WHO anatomical therapeutic chemical (ATC)/defined daily doses (DDD) method,12 applying version WHO 2010 to all 12 years in the database. Comparing hospitals (with or without the policy, as well as before and after implementation of the policy) was done per APR-DRG to facilitate case-mix adjustment. The two APR-DRG with the highest number of patients receiving AM were APR DRG 302 (major lower limb orthopaedic surgery without trauma—mainly hip or knee replacement—or revision) and APR DRG 139 (simple pneumonia). We decided against clinical outcome measures such as mortality, readmission and length of stay (LoS) because these are too indirectly related to appropriate AM prescribing. Compliance with guidelines for antibioprophylaxis in APR DRG 302 (‘surgery QI’) was defined using three criteria at patient level as: (1) choice of AM (cefazolin), dose in the expected range (2–8 g) and (2) no other AM given during the stay.13 We excluded from the analyses hospital stays with secondary infectious diagnoses and SoI 3 and 4, so that it could fairly be assumed that there was no other reason for prescribing an AM than antibioprophylaxis. For pneumonia, the data did not allow assessing the appropriateness of treatment at patient level. In addition, treatment guidelines can differ between hospitals. Aggregating data at hospital level, we selected two QIs: (1) the ratio of oral DDD/parenteral DDD (‘O/P QI’), as early parenteral to oral switch is recommended to reduce LoS, adverse events related to intravenous line, and costs13–15 and (2) total DDD (J01) minus penicillin (J01C), per 100 days in hospital for pneumonia (‘DDD QI’), under the assumption ‘less is better’. Penicillin use was excluded because recommended daily doses have increased over the years.
Statistical approach and adjustment for confounding
We used a change point model.16 Such a model tests whether the slope of a trend is different before and after the change point. We included as change points the year each hospital received funding for its AMT (2002, 2006, 2007), as well as the years 2001 (the year of a very large awareness campaign for AM) and—for pneumonia only—2006 (when a new financing mechanism for hospital drugs was introduced; however, this mechanism did not apply to AM prophylaxis). We then tested the need to include additional change points. The surgery QI was a dichotomous variable at the patient (stay) level, and variables adjusted for were LoS, age (continuous), gender, SoI (1–2), and intensive care unit (ICU) stay (at some point, hospitalised in the ICU). For pneumonia, outcomes were continuous variables at hospital level and required aggregation of patient (stay) level data. Hospital variables for pneumonia stays were: median LoS, distribution of the stays (%) according to SoI (1–4), gender, ICU stay, patient origin at admission (home, long-term care facility, other or unknown), discharge status (dead/alive), and age categories (<1, 1–5, 6–10, 11–16, >16 years). Caseload (number of hospital stays included in the analyses for each QI, per hospital, and per year) was also included in the model as a variable at hospital level.
For pneumonia, results were weighted for caseload. A time lag (±1 year) was introduced to account for the fact that the effect of AMT funding might have started before the hospitals received the money (eg, because preparation included AM stewardship training) and might need some time to be fully implemented (eg, because of possible delays in recruiting an AM specialist).
Statistical model and software
A somewhat abrupt but continuous change in the evolution of the outcome over time can be modelled by including a change point in the generalised linear mixed model (GLMM).17 A GLMM is an extension of a generalised linear model in which the correlation between measurements from the same hospital is taken into account using so-called random effects. Whereas the outcome is considered to belong to the exponential family (including the normal and the Bernoulli distribution), the systematic component of a GLMM is given by: where µij is the average outcome for hospital i (i=1, 2,…, N) at time points tij (j=1, 2,…, ni), g(.) is a link function (eg, an identity link or a logit link), N is the total number of hospitals, ni is the number of observations from the i-th hospital, tij=1 corresponds to the start of the study,
  is the fixed intercept, b0i is the hospital-specific deviation from intercept
  ,
,  is the fixed slope, b1i is the hospital-specific deviation from slope
  ,
,  such that
  is the global difference in the linear trend before and after the change point, CP is a global change point,
  (q=3, 4,…, Q) are the fixed effects for the explanatory variables Xqij and Q is the number of explanatory variables. All models were fitted using SAS V.9.3.
Results
Surgery QI
A total of 325 094 hospitals stays between 1999 and 2010 were available for analyses (90% of the total number of stays coded APR DRG 302, after exclusion of SoI 3 and 4, stays with infectious diagnoses, and errors in hospital coding). Median LoS in this population decreased from 15 days in 1999 to 8 days in 2010. Trends in the number of hospital stays and compliance with the three criteria, as defined earlier, are shown in table 1. Compliance increased from 53% of included stays in 1999 to 71% in 2010.
Hospital stays for lower limb orthopaedic surgery* and compliance with guidelines for surgical prophylaxis, Belgium, 1999–2010
Based on likelihood ratio (LR) tests comparing models with and without specific change points, the change point ‘year of AMT’ was retained in the model (p<0.0001); the change point ‘year 2001’ was identified as statistically significant (p<0.0001). All changes were negative and weak (meaning that compliance increased, but at a slower pace than before). The final model had a pseudo-R² value of 0.1927. Although R² values for models on binary outcomes are typically much lower than for models on continuous outcomes, this indicates that there is still a lot of unexplained residual variability. Observed and predicted values for the full model, and for hospitals according to the year of funding AMT, are shown in figure 1.

Average observed and predicted (dotted) evolution of compliance with guidelines for surgical antibiotic prophylaxis for lower limb surgery*, Belgium, 1999–2010. AMT, antimicrobial management teams; APR-DRG, all-patient-refined diagnosis-related group.
Pneumonia QI
A total of 327 635 hospitals stays between 1999 and 2010 were available for analyses (95% of the total number of stays coded APR DRG 139, after exclusions for coding errors). All had ‘pneumonia’ as an admission diagnosis, so we assume that the vast majority of patients were admitted for community-acquired pneumonia. (In theory, it is possible that some patients were transferred from another hospital with a hospital-acquired pneumonia.) From 1999 to 2010, median LoS in this population decreased from 9 to 7 days, percentile 25 for age decreased from 16 to 11 years. Case fatality decreased in all four categories of SoI, from 1.6% to 0.4% in less severe illness (SoI 1), and from 40% to 33% in more severe illness (SoI 4).
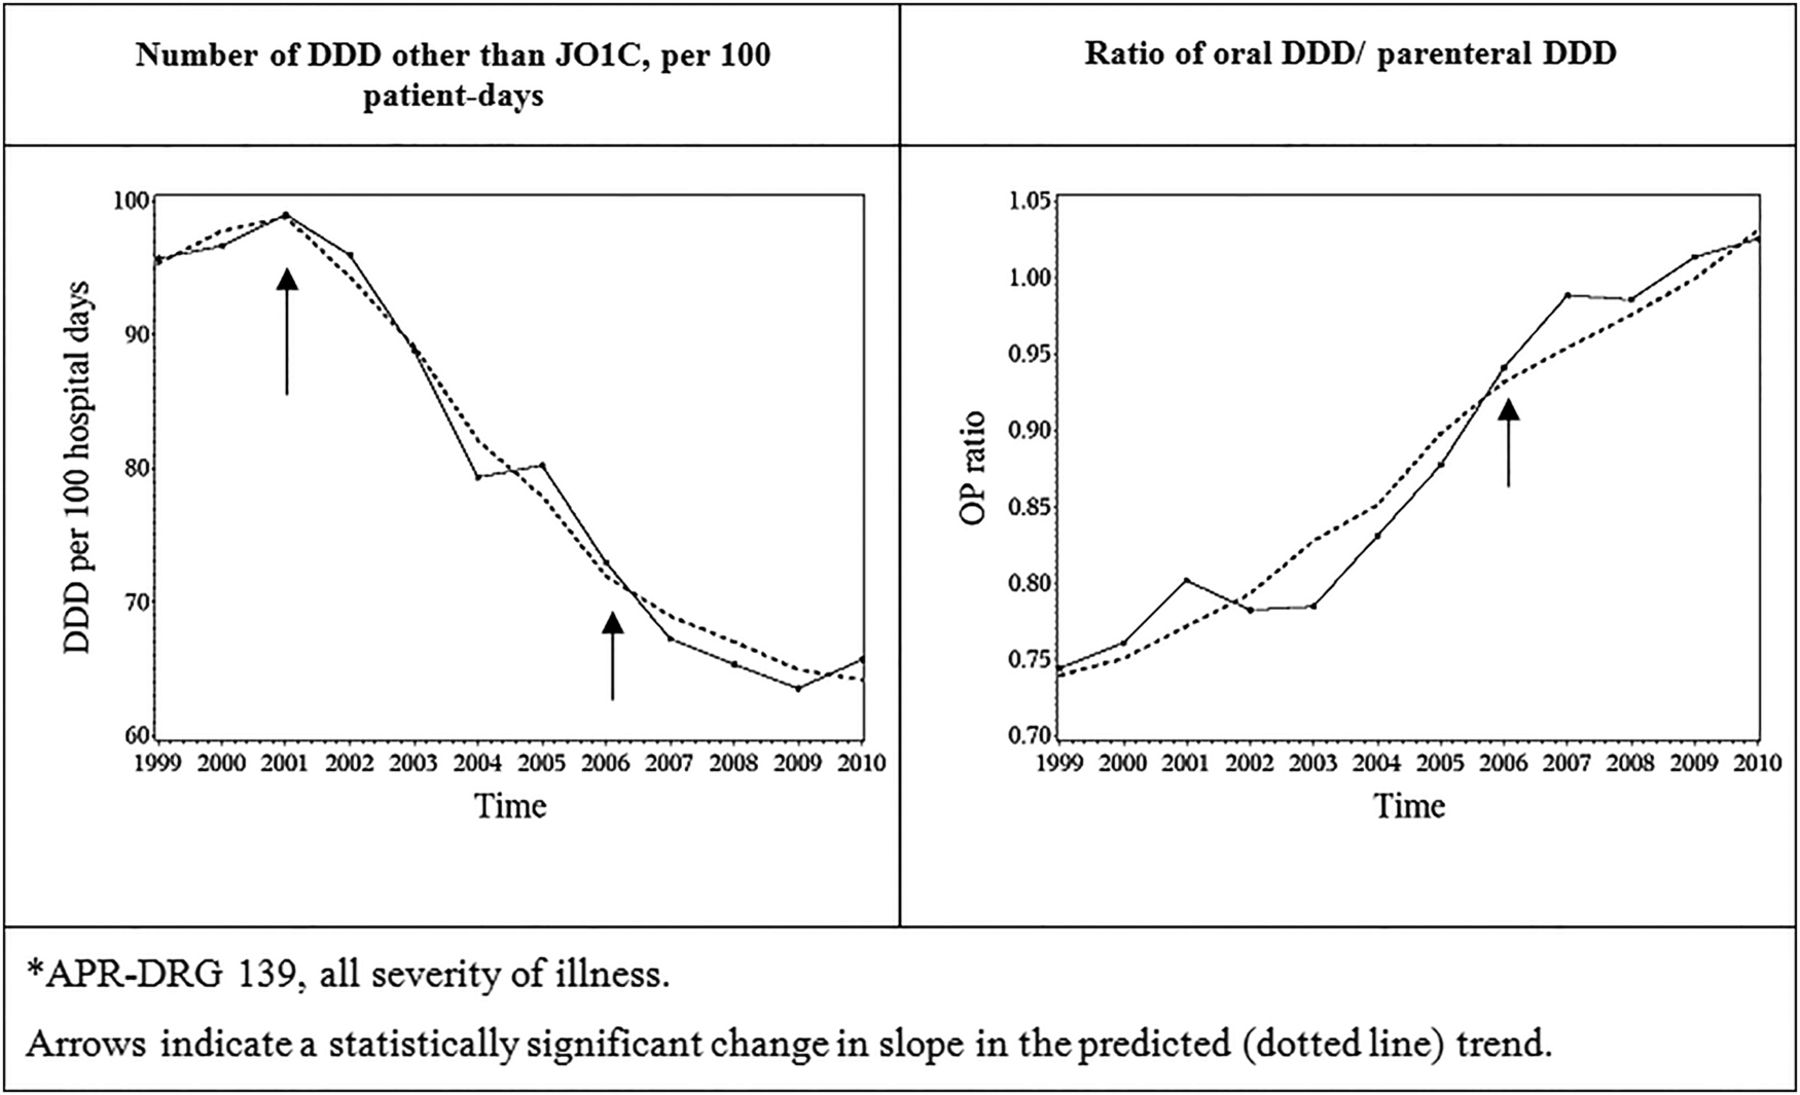
Trends in the number of hospital stays and the QI are shown in table 2. Between 1999 and 2010, the mean DDD of AM other than J01C decreased from 96 to 64/100 days of hospitalisation for pneumonia; the O/P ratio (all AM) increased from 0.72 to 0.97.
Hospital stays for simple pneumonia* and quality indicators for antimicrobial treatment, Belgium, 1999–2010
Based on LR tests comparing models with and without specific change points, the change point ‘year of AMT’ was not retained in the models for the DDD QI (p=0.4659), nor for the O/P QI (p: 0.0997). This means that there was no statistically significant change in slope for these outcomes, that is, the year a hospital received funding for their AMT.
For the DDD QI, the years 2001 and 2006 were identified as statistically significant change points (p<0.0001 and 0.0009, respectively). In 2001, the QI decreased, and the effect was strong. In 2006, the QI decreased at a slower pace than before. The adjusted R² for the final model was 0.8072. For the O/P ratio QI, the year 2001 was not retained in the model (p=0.9884), while the year 2006 was identified as a statistically significant change point (p=0.0310): the QI increased, but at a slower pace than before. The adjusted R² for the final model was 0.7559. For these two pneumonia outcomes, the high adjusted R² indicates that the models perform well in explaining the variability in the data. The effect of the ‘2006’ change point on both QIs was weak and of doubtful clinical significance, as shown in figure 2.
Average observed and predicted (dotted) evolution of quality indicators for antimicrobial treatment of community-acquired pneumonia* in hospitals, Belgium, 1999–2010. APR-DRG, all-patient-refined diagnosis-related group; J01C, ATC code, β-lactam penicillin; DDD: defined daily dose.
General features of statistical modelling
All 3 QIs showed high heterogeneity: baseline values as well as changes over time varied widely across hospitals. Another feature was the complexity of the predicting models, which involved many parameters, and interactions, rendering interpretation sometimes difficult, so that the effect of ‘change points’ is better assessed visually on the figures presented. Of importance, the introduction of time lags in the models (ie, taking into account the year before or the year after the ‘change points’) did not improve the models. A complete description of the results, interaction terms and estimates is available in the full study report.18
Discussion
Key findings
In 1999, 53% of patients admitted in hospital for major lower limb orthopaedic surgery received the recommended AM for surgical antibioprophylaxis, with a dosage in the expected range, and no other AM. This figure was 71% in 2010. For patients treated for pneumonia over the same period, the mean consumption of AM other than penicillin decreased from 96 DDD to 64 DDD/100 hospital-days, and the ratio of oral/parenteral DDD increased from 0.72 to 0.97. There was high heterogeneity between hospitals. No positive effect could be detected at the national level for these three QIs in relation to the timing of implementation of the policy. In 2001, the decrease in the pneumonia DDD indicator was a statistically and most likely clinically significant deviation from expected trends.
Strengths and limitations
To the best of our knowledge, this is the first study specifically evaluating a national policy of implementing and funding AM stewardship programme at hospital level. Another country—Scotland—funds AMT in hospitals since 2008,19 as part of a comprehensive policy to improve AM prescribing. The Scottish policy as a whole appears to be successful—but the extent to which the funding of AMT contributes to this success remains unknown.20
Its major strengths are an exhaustive patient-based database including all Belgian hospitals over 12 years. The fact that the intervention was implemented at different times allowed us to compare QIs both within and between hospitals (hospitals before and after implementation of the policy, as well as hospitals with and without the policy); our fine-tuned case-mix adjustment removed confounding due to differences in the patient population. The two APR-DRG studied account for the largest number of patients receiving AM in hospitals. The trend in improvement for the surgery QI is robust, even if true compliance is less than what we measured, as our QI does not include timing of AM administration. We used state-of-the art statistical methods for modelling the trends of our QI, and acknowledged that change can take time by introducing time lags in the model (taking into account one year before, one year after the ‘change point’); nonetheless, these did not improve the model. The major limitation of this study is that we only looked at three QIs for two indications. These QIs do not measure patient outcomes such as surgical site infection or mortality (but these are only indirectly related to appropriate AM prescription, eg, overshooting could also cure a patient). One QI is questionable. The decreasing trends in the consumption of DDD other than penicillin mainly reflect a decrease in cephalosporins and macrolides which offsets an increase in carbapenems and fluoroquinolones. The decrease is also partly explained by a shift towards broad-spectrum penicillin (J01CR, or combinations, such as amoxicillin—clavulanic acid).18 It is therefore unclear whether the decrease in this QI indeed represents a true improvement in quality.
Interpretation
At least two out of three of our QIs describe a true improvement in AM use for patients admitted to hospital for pneumonia and lower limb surgery between 1999 and 2010 in Belgium; these improvements have benefited a very large number of patients. Exactly why this happened is unclear. Although 2001 (a ‘change point’ for the DDD QI) was the year of a very large awareness campaign for AM, this campaign targeted upper respiratory tract infections in the community.
There are several possible explanations for the lack of association between improvement in the QIs and the year of implementation of AMT in hospitals. The selected items for QI, that is, prophylaxis for major limb orthopaedic surgery and AM therapy in community acquired pneumonia, are items/topics likely to have been addressed in the hospital AM policy at different time points, fully or largely independent from the implementation of AMT. AMT were not given targets, and therefore might have chosen other priorities for interventions than the indications analysed here, despite these being the indications with the highest volume of patients receiving AM. (In 2013, however, all AMT in Belgium conducted audits for antibioprophylaxis in surgery in which serious gaps were identified.21) It is also possible that the earmarked AMT funding was not always used directly for AMT implementation. A major shortcoming resides in the absence of data on the actual use of funding within hospitals, which may not be easily extracted from the annual AMT activity reports.
Generalisability
The generalisability of our study finding is limited by the intrinsic complexity of evaluating the quality of AM use in hospitals. We investigated only a limited number of QIs for a limited number of indications: this does not provide a complete picture of trends in quality of AM use in Belgian hospitals, and of the effect of implementing and funding AMT in hospitals. This study should ideally be complemented by other indicators, which might provide different results. For instance, worrying trends are observed for hospital use of some AM; between 1999 and 2010, the use of colistine quadrupled and the use of carbapenem more than doubled (6–24 DDD, and 118–265, per 10 000 patient-days, respectively).18
Political commitment for tackling the problem of AM resistance in general, and improving AM use in hospitals in particular, has clearly been increasing in the past decade in Europe, North America and elsewhere.7 ,22–26 Recommendations for strengthening the legal basis and core funding of antibiotic stewardship programmes acknowledge the urgent need for building an evidence base for such policies through good quality research,7 ,8 and we believe that this study contributes to this objective.
Conclusions
Our study has shown improvement on selected QIs for AM use in the treatment of pneumonia, and in antibioprophylaxis for lower limb orthopaedic surgery in Belgian hospitals between 1999 and 2010. These improvements could not be related to a policy of funding AMT. Changes observed may therefore reflect the more multifactorial and continuous change process of quality improvement, of which the implementation and funding of AMT was rather a consequence than a primary driver.
Our findings do not question the need for AMT, nor the need for continuation of AMT funding. Several recommendations could be made in order to make the best of the Belgian unique political, and financial commitment in that field. Transparency in the use of earmarked funding for AMT at hospital level could be improved. Trends of other AM QIs deserve more research. AMTs in hospitals should benefit from more guidance in terms of identifying priorities for action.
Acknowledgments
The authors sincerely thank the following persons for their contribution to this study: (in alphabetical order) Michiel Costers, Anne Ingenbleek, Evelyn Van Gastel, Yves Parmentier and Sofie Vaerenberg.
References
Footnotes
-
Contributors M-LL, NHa, HG and DV designed the study; M-LL, NHa and RB wrote the first draft; RB, NHe and MA conducted the statistical analyses; FN, BC, HG and DV revised the manuscript critically for important intellectual content. All authors read and approved the final manuscript.
-
Funding This study was funded by the Scientific Institute of Public Health (internal grant, 99 429 Euros, project number W3035.0116.1). Data have been generated as part of the routine work of the Ministry of Health and National Sick Fund. RB acknowledges support from a Methusalem research grant from the Flemish government not specific for this project.
-
Competing interests None.
-
Provenance and peer review Not commissioned; externally peer reviewed.
-
Data sharing statement Legal restrictions apply to these data, which cannot be shared.