Article Text

Abstract
Objectives We examined whether the weekly number of newspaper articles reporting on influenza was related to the incidence of influenza in a large city.
Design Prospective, non-randomised, observational study.
Setting Registry data of influenza cases in Fukuoka City, Japan.
Participants A total of 83 613 cases of influenza cases that occurred between October 1999 and March 2007 in Fukuoka City, Japan.
Main outcome measure A linear model with autoregressive time series errors was fitted to time series data on the incidence of influenza and the accumulated number of influenza-related newspaper articles with different time lags in Fukuoka City, Japan. In order to obtain further evidence that the number of newspaper articles a week with specific time lags is related to the incidence of influenza, Granger causality was also tested.
Results Of the 16 models including ‘number of newspaper articles’ with different time lags between 2 and 17 weeks (xt-2 to t-17), the β coefficients of ‘number of newspaper articles’ at time lags between t-5 and t-13 were significant. However, the β coefficients of ‘number of newspaper articles’ that are significant with respect to the Granger causality tests (p<0.05) were the weekly number of newspaper articles at time lags between t-6 and t-10 (time shift of 10 weeks, β=−0.301, p<0.01; time shift of 9 weeks, β=−0.200, p<0.01; time shift of 8 weeks, β=−0.156, p<0.01; time shift of 7 weeks, β=−0.122, p<0.05; time shift of 6 weeks, β=−0.113, p<0.05).
Conclusions We found that the number of newspaper articles reporting on influenza in a week was related to the incidence of influenza 6–10 weeks after media coverage in a large city in Japan.
- EPIDEMIOLOGY
This is an Open Access article distributed in accordance with the Creative Commons Attribution Non Commercial (CC BY-NC 4.0) license, which permits others to distribute, remix, adapt, build upon this work non-commercially, and license their derivative works on different terms, provided the original work is properly cited and the use is non-commercial. See: http://creativecommons.org/licenses/by-nc/4.0/
Statistics from Altmetric.com
Strengths and limitations of this study
This is the first study to quantify the association between media attention and the incidence of influenza in a large city.
Although pertinent information related to influenza might have been broadcast through other media except for newspaper, these effects were not evaluated.
We need to be careful when generalising our results to other cities with the same population size in industrialised countries.
Introduction
During annual influenza epidemics, approximately 5–15% of the population is affected by upper respiratory tract infections.1 Accordingly, influenza is a serious health threat and a significant cause of mortality in elderly people in industrialised countries.2–6 Vaccination has been shown to be a preventive measure for influenza; vaccines containing antigens that match the predominant circulating strains have been reported to prevent illness in 70–90% of healthy adult volunteers.1 ,2 ,5 Approximately 50 countries have government-funded national influenza immunisation programmes, and the influenza vaccine is available in many other countries as well.1
According to the Elaboration Likelihood Model (ELM) of Petty et al7 people are most likely to pay careful attention to information when it is relevant to them and when it can be processed without assistance. Concomitant with this theoretical expectation, it has been reported that media activities can directly affect immunisation take-up, positively and negatively.8 A recent Cochrane review also concluded that mass media should be considered as a tool for encouraging the use of effective health services and discouraging the use of those of unproven effectiveness.9 Specifically, media reports have affected the vaccination rates for measles, mumps and rubella,10 whooping cough,11–13 rotavirus8 and influenza.14 ,15 Specifically, Ma et al14 reported that the paediatric influenza vaccination rates from 2003 to 2004 were similar to those from 2002 to 2003 until the onset of intense media coverage, at which time the number of influenza vaccinations per week increased more than threefold. According to a study whose participants were community-dwelling elderly people in the USA insured through Medicare, media reports in television and newspapers were associated with earlier and increased influenza vaccination, shifting the mean vaccination timing earlier by 1.8–4.1 days (p<0.01) or increasing the annual vaccination rate by 2.3–3.7% (p<0.01).15
With respect to media coverage and influenza, previous findings can be summarised as follows: (1) media coverage is focused on a specific high-risk group such as children or senior citizens; (2) the outcome measure for the effectiveness of media coverage is influenza vaccination, not the number of cases of influenza. As for these points, however, in view of ELM and previous findings,7–9 ,14 ,15 it is possible that influenza-related media reports might be related to the incidence of influenza cases. To date, however, the association between media attention and the incidence of influenza in a large city has not been evaluated.
We obtained information concerning influenza from various media sources including TV, radio, internet and magazines. Among the various types of mass media available, information in the newspapers is coming to the readers, whereas in the internet people have to search for this information. Newspapers are read by more than 90% of the population and represent the most trusted source of information in Japan.16 In addition, it is relatively easy to evaluate the amount of information on a specific topic in newspapers, whereas it is extremely difficult to evaluate the amount of information conveyed via TV, radio, internet and magazines. Thus, we used the number of influenza-related newspaper articles reporting on influenza. In this study, we examined whether the number of influenza-related newspaper articles in a week was related to influenza incidence by using recent data gathered on the number of relevant newspaper articles and the incidence of infection in Fukuoka City, Japan.
Methods
Setting and study period
We studied the number of newspaper articles on influenza and the incidence of influenza in Fukuoka, located in southwest Tokyo. The population of Fukuoka, which is the largest city on Kyushu Island, is about 1.2 million. The study period lasted from October 1999 to March 2007.
Since the purpose of the study is to examine if the weekly number of newspaper articles reporting on influenza is related to the incidence of influenza in Fukuoka, data between October and the following March during the study period were used for analysis (208 weeks).
Variables
First, we identified two variables: the weekly number of influenza cases and the weekly number of influenza-related newspaper articles. The systematic surveillance of influenza as a notifiable disease, as defined under the Law concerning the Prevention of Infectious Diseases and Medical Care for Patients Suffering Infectious Diseases, began in 1999 in Japan and allowed the determination of the number of influenza cases in any given week. Each influenza case was defined by the following symptoms: sudden fever (temperature >38°C), respiratory symptoms, general malaise and myalgia. The number of patients infected with influenza was reported on a weekly basis by 198 sentinel paediatric and general physicians within the Fukuoka Prefecture.17 The sentinels were selected so that they were evenly distributed in terms of population, number of medical facilities and geographical conditions. Relevant data for Fukuoka City were used in this study. Data related to the influenza cases in Fukuoka City were obtained from the National Epidemiological Surveillance of the Infectious Diseases System, which monitors infectious disease events among the roughly 1.2 million residents of Fukuoka City through 50 sentinel physicians.17
A total of six newspapers (Yomiuri, Asahi, Mainichi, Nikkei, Sankei and Nishinippon), including the five most widely circulated newspapers in Japan and the most widely circulated newspaper in the Fukuoka area (Nishinippon), were examined for the publication of influenza-related articles.18 The Nikkei Telecom 21 database covers newspaper articles from 1980 to the present.19 In this study, we determined the number of articles published per week containing the word ‘influenza’ in the headline. An article on ‘bird flu’ was excluded. In addition, when the content of an article identified by ‘influenza’ was not in fact related to influenza, the article was excluded. Figure 1 shows the contents of newspaper articles between October and the following March during the study period. Articles were categorised into the following six subgroups: ‘influenza’ and ‘epidemic’, ‘influenza’ and ‘symptoms’, ‘influenza’ and ‘prevention’, ‘influenza’ and ‘immunisation’, a combination of the above key words, and ‘others’. The ‘others’ category included articles identified by key words such as ‘elderly’ and ‘influenza’, ‘Tamiflu’ and ‘influenza’, the brand name of a drug and ‘influenza’, and ‘new type’ and ‘influenza’. During the study period, more than 70% of newspaper articles included the search term ‘influenza’.

The contents of newspaper articles from October 1999 to March 2007.
The impact of newspaper articles published in previous weeks was expected to carry over into subsequent weeks at a diminishing level. This carry-over effect, represented by the equation  articles (t-1)-s, where (t-1)-s is the time lag, was included in the model used to calculate the weighted number of influenza-related newspaper articles.20 ,21 In accordance with the work of Radfer,22 a value of 0.85 was used as the weekly carry-over weighting effect (λ) in our model. In addition, to account for the requisite influenza virus incubation period, and with λ being close to 0 when λ is 0.85, the weighted number of articles identified in previous weeks (weeks 1−32) was calculated. In addition, newspaper circulation (ie, Nishinippon, 1 255 323; Asahi, 354 558; Mainichi, 268 755; Yomiuri, 413 757 and Nikkei, 119 610) and newspaper circulation per population (ie, Nishinippon, 3.00; Asahi, 2.76; Mainichi, 2.73; Yomiuri, 2.93 and Nikkei, 2.00) in Fukuoka City were also adjusted.18 ,19
As covariates, temperature, humidity, number of holidays, years and months were also entered into a regression model.23 Specifically, with respect to temperature, the number of days during which the lowest temperature was lower than 10°C in the previous week was used, and with respect to humidity, the number of days during which the lowest humidity level was higher than 60% in the previous week was used. With regard to holidays, the number of holidays in the previous week was used.
Statistical analysis
In Japan, the completion of influenza vaccine administration is recommended by the end of November.6 ,24 In reality, however, the influenza vaccination period is from the middle of October to the end of December (11 weeks). If the weekly number of newspaper articles reporting on influenza is related to the incidence of influenza by way of influenza vaccination, the weekly number of newspaper articles reporting on influenza during the vaccine administration period should be a significant predictor of influenza incidence, because the time between media coverage and vaccination is very short.14 Influenza vaccination was recommended to be administered twice with a spacing of approximately 2–4 weeks for children, and only one dose for people aged 13 and over before the starting influenza season.25 ,26 An increased level of antibody titre is acquired only 1 or 2 weeks after influenza vaccination.1 ,3 ,6 Therefore, in the fastest scenario, after media exposure followed by influenza vaccination, the effect of the vaccination can be observed only after a time lag of at least 2 [1 (interval)+1 (antibody acquisition)] weeks. In the slower scenario, after media exposure followed by influenza vaccination, the effect of the vaccination can be observed after a time lag of 6 [4 (interval)+2 (antibody acquisition)] weeks. Since the period of time during which the influenza vaccination is administered is about 11 weeks, there will be a time lag of about 11 weeks between when an individual gets vaccinated against influenza at the earliest (ie, the middle of October) and latest (ie, the end of December) times until the effect of the vaccination can be observed. Therefore, the time lag between newspaper articles reporting on influenza during the vaccine administration period and the observed vaccination effect is somewhere between 2 (the lag in the fastest scenario) and 17 [6 (the lag in the slowest scenario)+11 (influenza vaccination period)] weeks.
In the analysis, a regression model with autoregressive (AR) time series errors was fitted to the data.27 ,28 A regression model with AR time series errors is effective in evaluating the effects of multiple factors on a dependent variable, which are time series data, and determining the autocorrelation. In order to see if the weekly number of newspaper articles on influenza is related to the incidence of influenza, 16 different models of ‘number of newspaper articles’ with different lags (xt-2 to t-17) were fitted to the data. Specifically, the following model was fitted to the data.

 We used the maximum likelihood method for estimation. The programme successively eliminated non-significant (default significance level: p<0.05), non-autocorrelated error terms at the lag specified in advance for the autocorrelation of errors. Yule-Walker estimation was used during the backward elimination to obtain the preliminary model order, and maximum likelihood estimation was used for the remaining parameters. Significant residual autocorrelation of the corrected model was examined using Durbin-Watson statistics. The AR model residuals were double-checked by autocorrelation function (ACF) and partial ACF (PACF) for the residuals of the estimated AR model and Q-statistics; white noise was confirmed. To test whether the coefficients were biased due to unequal variance in the error term between values of the independent variables (heteroscedasticity), we conducted a Q-statistic test for changes in variance across time.29
Finally, in order to obtain further evidence that ‘number of newspaper articles’ with specific time lags identified in the regression analysis is related to the incidence of influenza, Granger causality was also tested. Specifically, in order to determine whether the weekly number of newspaper articles with different time lags (xt-2 to t-17) can help forecast the incidence of influenza, using the above regression model, we performed a Granger causality test.30 All p values were two-sided, and analyses were conducted using the PROC AUTOREG and PROC ARIMA procedures in SAS software (V.8.2).
Results
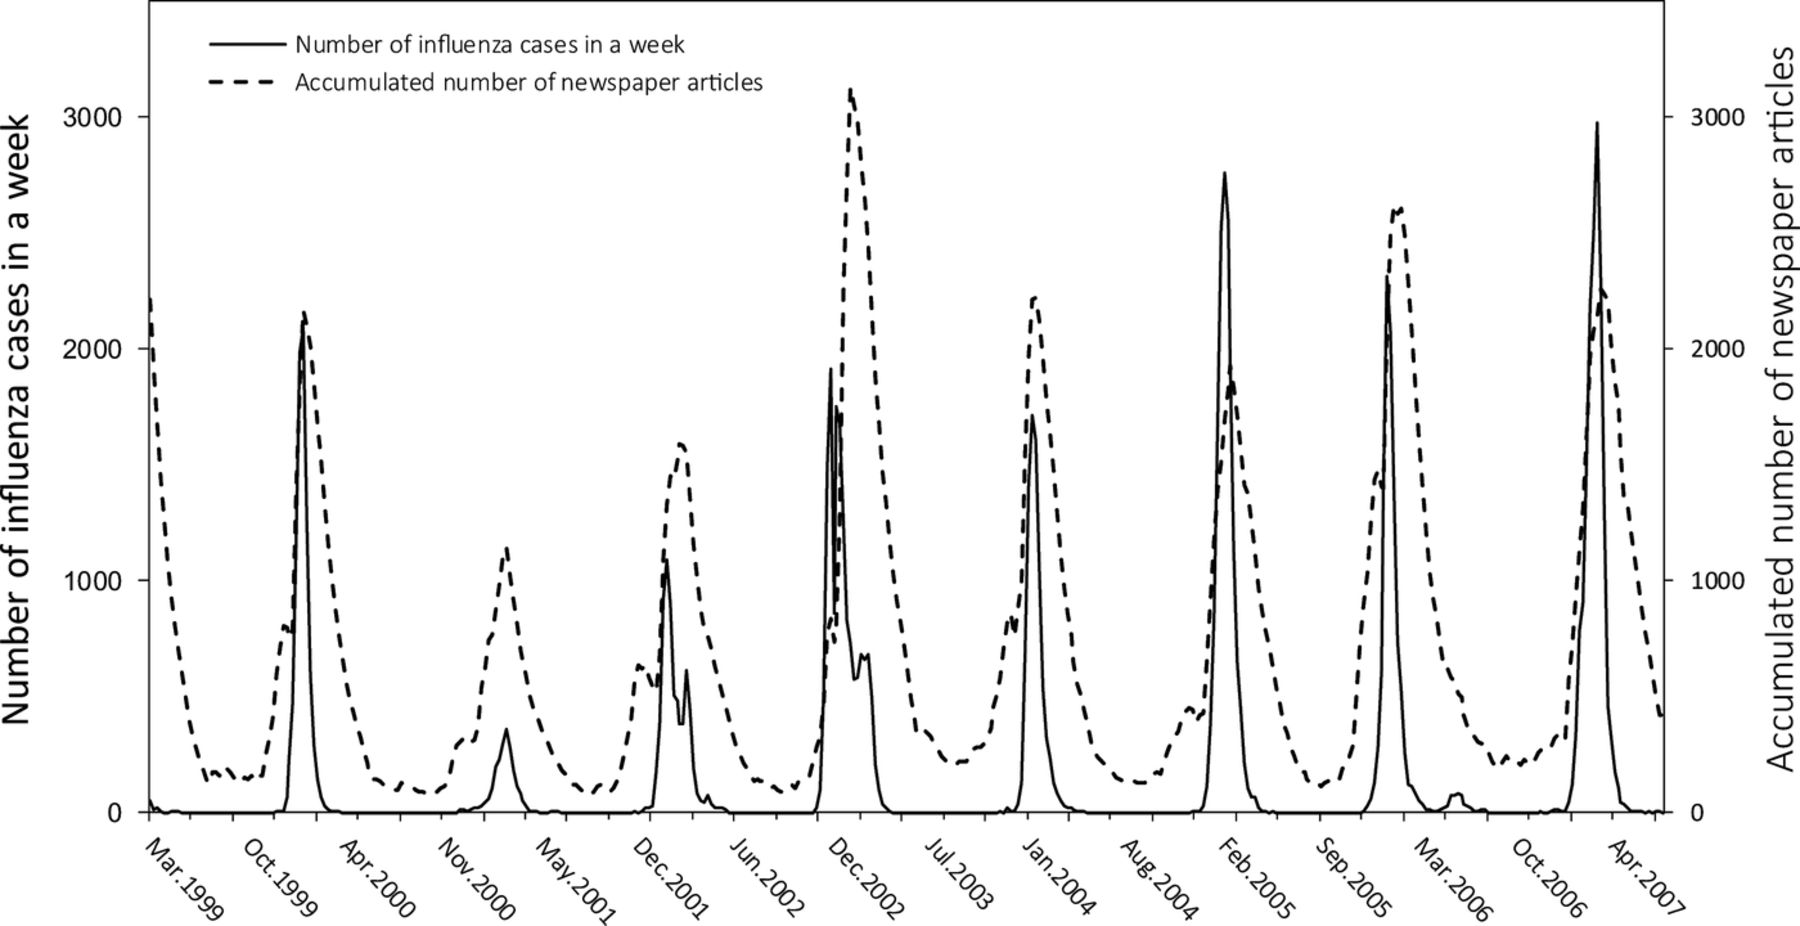
Study variables are presented in table 1. With regard to the weighted number of influenza-related newspaper articles, as noted previously, the number of articles in the previous weeks (weeks 1–32) (ie, from January to September of each year) was used to calculate the weighted number due to the carry-over value (λ=0.85). Changes in the accumulated number of newspaper articles and in the number of influenza cases during the study period are shown in figure 2. The mean number of influenza cases per week was 376.53, and it ranged between 0 and 2977. The mean accumulated number of newspaper articles was 902.04, and it ranged between 77.93 and 3127.18.
Characteristics of the study variables (n=208)

Changes in the numbers of influenza cases in a week (t) in Fukuoka City (solid line) and the weighted number of newspaper articles published in the six newspapers (ie, Yomiuri, Asahi, Mainichi, Nikkei, Sankei and Nishinippon) in the previous week (t-1) in Fukuoka indexed by the key word ‘influenza’ (dotted line). Data between October and the following March during the study period were used for analysis (208 weeks).
Sixteen different models of ‘number of newspaper articles’ with different lags (xt-2 to t-17) were fitted to the data. Table 2 shows the β coefficients of ‘number of newspaper articles’ with different lags (xt-2 to t-17) in the 16 different regression models. The table also shows the results of the Granger causality test. Since with a lagged dependent variable, as in Granger causality regression, the test is valid only asymptotically, the results of an asymptotic test are also shown in the table. Of the 16 regression models including ‘number of newspaper articles’ with different time lags between 2 and 17 weeks (xt-2 to t-17), the β coefficients of ‘number of newspaper articles’ at time lags between t-5 and t-13 were significant. However, the β coefficients of ‘number of newspaper articles’ that are also significant with respect to an asymptotic test and the Granger causality test (p<0.05) were the number of newspaper articles at time lags between t-6 and t-10.
β coefficients of the weekly numbers of newspaper articles at lags between t-2 and t-17 in 16 different regression models, and the results of the Granger causality test
Table 3 shows the results of a linear model with AR time series errors including ‘number of newspaper articles’ at lags between 6 and 10 (xt-6 to t-10). For a model including ‘number of newspaper articles’ at lag 10 (xt-10), in the initial analysis, the specified autocorrelation error terms were AR (1), AR (2) and AR (5), and the Durbin-Watson statistic at orders 1, 4, 5 and 6 were 1.128 (p<0.0001, positive autocorrelation), 2.385 (p=0.006, negative autocorrelation), 2.420 (p=0.002, negative autocorrelation) and 2.297 (p=0.017, negative autocorrelation), respectively. For a model including ‘number of newspaper articles’ at lag 9 (xt-9), in the initial analysis, the specified autocorrelation error terms were AR (1), AR (2), AR (4) and AR (6), and the Durbin-Watson statistic at orders 1, 4, 5 and 6 was 1.137 (p<0.0001, positive autocorrelation), 2.393 (p=0.005, negative autocorrelation), 2.433 (p=0.001, negative autocorrelation) and 2.333 (p=0.009, negative autocorrelation), respectively. For a model including ‘number of newspaper articles’ at lag 8 (xt-8), in the initial analysis, the specified autocorrelation error terms were AR (1), AR (2), AR (4) and AR (6), and the Durbin-Watson statistic at orders 1, 4, 5 and 6 was 1.110 (p<0.0001, positive autocorrelation), 2.394 (p=0.005, negative autocorrelation), 2.454 (p=0.001, negative autocorrelation) and 2.363 (p=0.005, negative autocorrelation), respectively. For a model including ‘number of newspaper articles’ at lag 7 (xt-7), in the initial analysis, the specified autocorrelation error terms were AR (1), AR (2), AR (4) and AR (6), and the Durbin-Watson statistic at orders 1, 4, 5 and 6 was 1.091 (p<0.0001, positive autocorrelation), 2.410 (p=0.003, negative autocorrelation), 2.474 (p=0.000, negative autocorrelation) and 2.358 (p=0.005, negative autocorrelation), respectively. For a model including ‘number of newspaper articles’ at lag 6 (xt-6), in the initial analysis, the specified autocorrelation error terms were AR (1), AR (2) and AR (5), and the Durbin-Watson statistic at orders 1, 5 and 6 was 1.084 (p<0.0001, positive autocorrelation), 2.468 (p=0.001, negative autocorrelation) and 2.317 (p=0.012, negative autocorrelation), respectively. After the autocorrelation correction, in every model including ‘number of newspaper articles’ at lags between 6 and 10 (xt-6 to t-10), the results of the Durbin-Watson statistics, the ACF and PACF plots, and the Q-statistic indicated no significant residual autocorrelation in the analysis. The Q-statistic test for changes in variance across time showed no possibility of heteroscedasticity in the analysis.
Results of regression analysis with autoregressive time series errors including the weekly number of newspaper articles with lags between t-6 and t-10 in the model (n=208)
The models in table 3 explain about 90% of all variances in each model. In every model, the β-value for the number of newspaper articles was negative and significant (t-10: p=0.004; t-9: p=0.003; t-8: p=0.005; t-7: p=0.011; t-6: p=0.018) (table 3). The β-values for temperature and number of holidays were also significant in every model (t-6, t-7, t-8, t-9, t-10: p=0.000 and 0.001, respectively), implying that more cold days and fewer holidays are related to more influenza cases. As for humidity, the β-value was significant in the models including ‘number of newspaper articles’ at lag 10 (xt-10), lag 9 (xt-9) and lag 8 (xt-8) (t-10, t-9, t-8: p=0.045, 0.040, 0.045, respectively), but the value was not significant in other models (table 3), which implies that humidity is not consistently related to the incidence of influenza. Finally, dummy variables for year and months were not significant in any model.
Discussion
In this study using time series data, we tested if the weekly number of newspaper articles reporting on influenza is related to the incidence of influenza 2–17 weeks after the coverage. The results of regression analysis with AR time series errors revealed that the β-values for the weekly number of newspaper articles with lags between 5 and 13 weeks were negative and significant (table 2). However, an asymptotic test and the Granger causality test showed that the weekly numbers of newspaper articles with lags between 6 and 10 weeks were significant. This implies that the number of newspaper articles on influenza at time lags between t-6 and t-10 could help predict the incidence of influenza at time t (table 2). On the basis of the results of regression analysis and the Granger causality test, we thought that the weekly number of influenza-related newspaper articles was related to the subsequent influenza incidence 6–10 weeks after the coverage. In the study, data between October and the following March during the study period were analysed (208 weeks). During the 6-month period analysed in each year, other than influenza vaccination, there was no potential preventive factor that could explain a possible link between the number of newspaper articles on influenza in a week and the incidence of influenza 6–10 weeks after the coverage. Between 2000 and 2006, the annual number of newspaper articles on influenza (mean=1652.14, SD=±440.47) was associated with annual vaccine supply (mean=104 154.65 mL, SD=±40 088.57 mL) in Fukuoka City (r=0.76, p<0.05). In addition, an identified lag of 6–10 weeks was included in the range of 2–17 weeks. Thus, in view of ELM, previous14 ,15 and these findings, it is most likely that newspaper articles reporting on influenza during the influenza vaccine administration period may influence the prevention of an influenza epidemic through a process involving an increase in media coverage.7–14 We believe that the association between newspaper articles reporting on influenza and the prevention of an influenza epidemic in a large city is a novel, potentially useful discovery.
Regarding our findings, comments and practical implications are as follows:
First, the mean of the weighted number of newspaper articles (ie, 902.04) multiplied by the β coefficients for the number of newspaper articles with time lags between 6 and 10 weeks (ie, from −0.113 to −0.301) is −271.51 to −101.93 (influenza cases in a week) (tables 1 and 3). Further, these numbers are equivalent to 27.07–72.11% of the mean number of influenza cases in a week (table 1). It is implied that the influence of influenza-related newspaper articles on the incidence of influenza is potentially large. Second, although the timing of influenza activity may vary from year to year by several weeks, influenza outbreaks occur periodically every winter (figure 2). Accordingly, each fall, public health officials plan campaigns that include press releases and media events to encourage preventive activities. It is implied that such activities might be useful. Third, the graphical trends revealed by data showing the number of newspaper articles and the number of influenza cases were similar in shape (figure 2), implying that the media is interested in reporting the magnitude of an influenza epidemic after the fact. However, we believe that if the media devoted more attention to influenza prevention earlier in the year (eg, in November), they might exert a greater influence on the prevention of an influenza epidemic. Fourth, there was more media coverage of influenza in certain years during the study period (figure 2). The number of newspaper articles on influenza per week was correlated with temperature (ie, the number of days during which the lowest temperature was lower than 10°C in the previous week; r=0.580, p<0.0001). Thus, the media coverage might be partly due to cold weather during the influenza season.
Several caveats and limitations to the present findings should be noted. First, as a measure of media attention to influenza, we determined the number of influenza-related newspaper articles in the six most influential newspapers in Fukuoka. Although pertinent information relating to influenza might have been broadcast through other media, including TV, radio, internet and magazines, these effects were not evaluated in the study. With respect to the amount of information provided, these media sources were expected to highly correlate with the weekly number of newspaper articles; however, the extent of correlation is unknown. A recent study in Germany indicated that media awareness may be strongly associated with the pandemic situation, and the use of various information and message characteristics, such as vaccination, care reports, fear appeals, self-efficacy and political decisions, may help public health officials and healthcare institutions make health-related messages more effective.31–33 Further studies should be conducted to apply these variables as predictors. Second, it is necessary to consider the external validity of our findings. The present findings may be applicable to other Japanese cities. However, a previous study suggested that risk communication is dependent on differences in socioeconomic status, population demographics and geographic factors.33 In addition, we need to be careful when generalising our results to other cities with the same population size in industrialised countries, including those nations belonging to the Organisation for Economic Cooperation and Development (OECD) with similar socioeconomic status indices, where influenza vaccinations can be easily obtained.1–3 A population's willingness to respond to media coverage by following government vaccination recommendations may be tied to the ease of accessing vaccines, as well as to trust in and a willingness to follow established vaccination guidelines. Thus, the present findings may be less applicable in other cultural contexts. Third, other preventive measures such as cough etiquette and hand hygiene may also be influenced by newspaper coverage on influenza epidemics. Previous studies also suggested that promoting good hygiene practices are crucial for preventing or limiting the spread of infectious diseases.31–35 Further investigation into the effects of these preventive factors is critical. Fourth, the study period includes the time when there was increased attention to highly pathogenic influenza A (H5N1) and a pandemic threat. Although our study excluded avian influenza from newspaper articles, the articles regarding pandemic and pandemic preparedness may still be included in the analysis. This may also indicate that a need for more precise modelling would be important.
In conclusion, we found that the weekly number of newspaper articles on influenza was related to the incidence of influenza 6–10 weeks after the coverage in Fukuoka City. However, the present findings may be less applicable in other cultural contexts, and this will be critical topics for future study.
References
Footnotes
Contributors AH and DO made substantial contributions to the conception and design, analysed the data and wrote the manuscript. SM and TA were involved in the drafting of the manuscript and performed its critical revision for important intellectual content.
Funding This research received no specific grant from any funding agency in the public, commercial or not-for-profit sectors.
Competing interests None declared.
Ethics approval This study was approved by the ethics committee at the Kyushu University Graduate School of Medical Sciences.
Provenance and peer review Not commissioned; externally peer reviewed.
Data sharing statement No additional data are available.