Article Text

Abstract
Objectives Identification of pathway effects responsible for specific diseases has been one of the essential tasks in systems epidemiology. Despite some advance in procedures for distinguishing specific pathway (or network) topology between different disease status, statistical inference at a population level remains unsolved and further development is still needed. To identify the specific pathways contributing to diseases, we attempt to develop powerful statistics which can capture the complex relationship among risk factors.
Setting and participants Acute myeloid leukaemia (AML) data obtained from 133 adults (98 patients and 35 controls; 47% female).
Results Simulation studies indicated that the proposed Pathway Effect Measures (PEM) were stable; bootstrap-based methods outperformed the others, with bias-corrected bootstrap CI method having the highest power. Application to real data of AML successfully identified the specific pathway (Treg→TGFβ→Th17) effect contributing to AML with p values less than 0.05 under various methods and the bias-corrected bootstrap CI (−0.214 to −0.020). It demonstrated that Th17–Treg correlation balance was impaired in patients with AML, suggesting that Th17–Treg imbalance potentially plays a role in the pathogenesis of AML.
Conclusions The proposed bootstrap-based PEM are valid and powerful for detecting the specific pathway effect contributing to disease, thus potentially providing new insight into the underlying mechanisms and ways to study the disease effects of specific pathways more comprehensively.
- STATISTICS & RESEARCH METHODS
- EPIDEMIOLOGY
This is an Open Access article distributed in accordance with the Creative Commons Attribution Non Commercial (CC BY-NC 4.0) license, which permits others to distribute, remix, adapt, build upon this work non-commercially, and license their derivative works on different terms, provided the original work is properly cited and the use is non-commercial. See: http://creativecommons.org/licenses/by-nc/4.0/
Statistics from Altmetric.com
Strengths and limitations of this study
Powerful new statistical methods were proposed in detecting whether the pathway effect is significantly different between the case and control groups within the framework of systems epidemiology.
Statistical simulations were conducted to assess their performance, and a real data set for acute myeloid leukaemia was further analysed to validate their practicability.
Bootstrap-based pathway effect measures are valid and powerful for identifying the specific pathway contributing to disease, providing potential new insight into underlying mechanisms and more comprehensive ways to study the disease effects of specific pathways.
The limitation of the proposed bootstrap-based methods is the computation burden on the bootstrap procedure used to evaluate the CI when dealing with big data.
Introduction
Epidemiology involves the research of disease prevalence, incidence and its risk factors. However, traditional epidemiology mainly focuses on a single risk factor related to a disease, and this simplicity of the single-level paradigm has serious limitations,1 which have been increasingly criticised.2 Recent advances in high-throughput-omics technologies include genomics, epigenomics, transcriptomics, proteomics and metabolomics. It offers the potential to provide new insight into the underlying mechanisms in breadth and depth. The integration of traditional epidemiology with various omics data promotes a novel epidemiology branch, systems epidemiology,3 ,4 which is expected to create a network system to study health and disease at a human population level.1 Under this framework, the focus has been shifted from identification of independent risk factors to exploration of network or pathway effects on specific diseases. Nevertheless, systems epidemiology also proved to be a great challenge in impeccably designed and well-powered epidemiological studies with powerful new statistical analysis methods.
Numerous network analytical methods, which have been applied in studying human behaviour, physiology, systems biology and modern drug development,5–9 have provided the computational framework for data integration and biomarker selection in systems epidemiology.10 Among these, pathway analysis is an essential task for network analysis in systems epidemiology. Several methods have been proposed, including but not limited to, a Gene Set Enrichment Analysis (GSEA) approach,11 Prioritising Risk Pathways fusing single nucleotide polymorphisms (SNPs) and pathways,12 Bayesian Pathway Analysis,13 pathway analysis approaches based on the adaptive rank truncated product statistic,14 and a sub-pathway-based approach to study the joint effect of multiple genetic variants.15 Generally, these methods are suitable for various omics data in systems epidemiology. However, most of them attach little importance to the complex relationships (correlation and topological structure) between nodes in pathways, and only consider the probability of disease-related nodes co-occurring in pathways.
From the perspective of systems epidemiology, networks are abstract representations of biological systems at the population level, which have illustrated multilevel causes of the occurrence, development and prognosis of complex diseases. In the network, variables (risk factors) are represented by nodes, with their interactions or correlation by edges (or arrows). Perturbations in networks disrupt biological pathways and result in human diseases usually in the following situations: (1) the topological structure of pathways (or networks), but not pathway effects, is the same between different disease status; (2) the topological structure of the network changes under different disease status, including nodes or edges removal. Focusing on the former scenario, we attempt to develop a novel statistical method for detecting the pathway effect within a network between different disease status under a case–control design, in order to identify the specific pathway contributing to disease. To assess the performance of the proposed statistics Pathway Effect Measures (PEM), statistical simulations were conducted to evaluate type I error and power, and a real data set was further analysed to validate their practicability.
Methods
Pathway effect and PEM statistics
The proposed PEMs were developed under the framework of a graph model.16 Graph G is an ordered pair of disjoint sets (V, E), where V and E are finite sets. V=V(G) is the set of vertices and E=E(G) is the set of edges. A pathway is a graph P, where V(P)={x0, x1,…, xK} and E(P)={x0x1, x1x2, …, xK−1xK}, K denotes the number of edges in E(P) defined as the length of this pathway. Figure 1 shows a specific network with six nodes Xi (i=1, …, 6) and 10 edges. In this network, the effect of a specific pathway X1→X3→X5→X6→X4 is  , where βk denotes the standardised regression coefficient between kth and (k+1)th nodes in the pathway. In this paper, we mainly focus on detection of the pathway effect between different disease status (case and control) under the same topological structure of the network. The difference in pathway effect between case and control D=βD–βC can be introduced as an estimate of the pathway effect contributing to the disease, where βD is the pathway effect among cases and βC the pathway effect among controls. Since the distribution of D is not available, two typical PEM statistics were proposed for detecting the pathway effect contributing to the disease.

Network and one specific pathway.
Non-parametric bootstrap test
The statistic (PEM-D) is defined as 1where
  and
and  represent the standardised regression coefficient between kth and (k+1)th nodes in the pathway from cases and controls, respectively. To test whether a pathway has an effect on the disease of interest, we conducted hypothesis testing with H0:βD=βC versus H1:βD≠βC. Bootstrap methods17 were further employed to perform the hypothesis test. The percentile bootstrap CI approach was conducted as follows: (1) draw a large number of bootstrap samples (eg, 1000) and estimate D in each of them to form a bootstrap distribution; (2) define the limits of a 1-α CI as α/2 and 1-α/2 percentiles of the bootstrap distribution and (3) reject the null hypothesis (H0:βD=βC) if the CI does not include zero.
Since the bootstrap distribution may fail to centre at the sample estimate of D, a bias-corrected bootstrap CI18 was also adopted in this study. The detailed procedure is outlined as follows: (1) form bootstrap distribution as above; (2) find a z-score zρ=Φ−1(ρ), where Φ−1 is the inverse cumulative distribution function for standard normal distribution and ρ the proportion of the bootstrap distribution greater than the original sample D; (3) calculate zlower=zα/2−2zρ and zupper=−zα/2−2zρ, the limits of a 1-α CI are percentile ranks from the bootstrap distribution for Φ(zlower) and Φ(zupper); and (4) make a decision using the bias-corrected CI of the test statistic D.
Asymptotic normal distribution statistic (PEM-UD)
From the definition of D=βD−βC, the asymptotic normal distribution statistic is defined as 2
2
Where var(βD) and var(βC) denote the variance of βD and βC, respectively, which can be calculated by four different methods:
(1) the exact estimator19 where
where  is the SE of βk;
(2) the unbiased estimator19
(3) the multivariate Δ estimator20 where
where  2(4) the bootstrap estimator.17 The former three variance estimators were derived under the independent assumption of the standard regression coefficients βk.
In summary, the significance test procedure was conducted as follows: (1) calculate βD–βC from the original sample; (2) conduct the bootstrap procedure to estimate the 1-α percentile bootstrap CI, bias-corrected CI and calculate var(βD) and var(βC) by four different methods; and (3) reject the null hypothesis if the CI does not include zero or the p value less than the significance level α.
Simulation
Simulations were conducted to evaluate the performance of D and UD under different sample sizes, pathway effect and pathway length. For the specific pathway with length K, the simulated (K+1)-dimensional variables (nodes) were generated from a multivariate normal distribution NK+1(μ,∑) with mean vector μ and covariance matrix ∑. In this article, we specified the mean vector μ=0 and covariance matrix.
Under the null hypotheses (H0:βD=βC), the data were generated by setting  and
and  to suffice
  . Under the alternative hypotheses (H1:βD≠βC), different correlation coefficient βk, pathway effect contributing to the disease
  and pathway length K were considered. All simulation data were generated by the R “mvtnorm” package available from CRAN (http://cran.r-project.org/).
Under H0, 1000 simulations, given the various sample sizes (N=50, 100, 200, 300, 500, 1000) and pathway length (K=2, 3, 4, 5), were conducted to assess the type I error of the above two typical PEM, including the non-parametric bootstrap test with CI estimated by the percentile bootstrap and bias-corrected bootstrap methods, and asymptotic normal distribution statistic with variances calculated via four approaches. Under H1, given the various sample sizes, we repeated 1000 simulations to assess the power under a different correlation pattern, δ and K, respectively.
Application
The proposed two typical PEM were applied to acute myeloid leukaemia (AML) data, consisting of T helper type 17 (Th17) cells, regulatory T (Treg) cells and their related cytokine transforming growth factor β (TGFβ) in a bone marrow microenvironment from 98 patients with AML and 35 controls collected by the Qilu Hospital of Shandong University in China. Patients with AML were diagnosed according to the French-American-British (FAB) classification system. Patients with hypertension, diabetes, cardiovascular diseases, or chronic or active infection, or were pregnant were excluded. Individuals with a slight iron deficiency anaemia, having no immunological changes, were used as controls. Clinical characteristics of the participants are presented in table 1. Informed consent was obtained from all participants before enrolment in the study in accordance with the Declaration of Helsinki. TGFβ is a pre-requisite for the induction of CD4+ T-cell Foxp3 expression and differentiation into Treg cells. TGFβ is also critical for human Th17 cell differentiation.21 ,22 All six methods were conducted to detect the pathway (Treg→TGFβ→Th17) effect contributing to AML.
Clinical characteristics of patients grouped according to acute myeloid leukaemia (AML) status
Results
Simulation
Type I error rate
Table 2 shows the estimated type I error rates of the two proposed PEM D and UD under different pathway lengths and sample sizes. The type I error rates of the non-parametric bootstrap test are close to the given nominal level (α=0.05) when the sample size reaches 300, and 500 for the asymptotic normal distribution statistic.
Type I error for two typical PEM in different scenarios
Statistical power
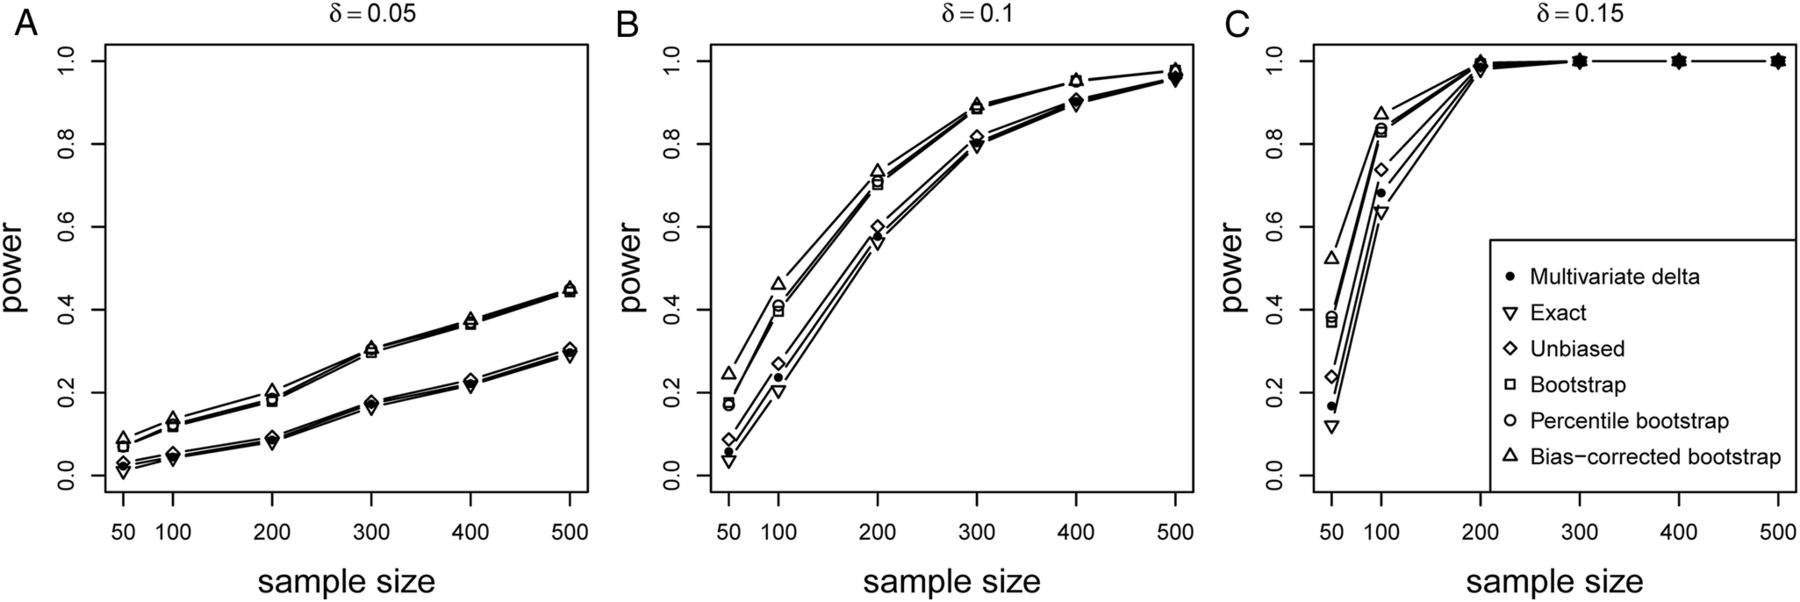
The power of the proposed PEM D and UD under K=3 is shown in figure 2. It can be seen that the power of the proposed six methods monotonically increases with the sample size and δ. The bootstrap-based tests (percentile bootstrap, bias-corrected bootstrap, variance estimated via a bootstrap) perform better than the other three tests, with the bias-corrected bootstrap CI method having the highest power. The power can be considerable under a larger δ (figure 2C), even with the small sample size (200).

Power of PEM under different sample size and different d given pathway length K=3. Different pathway effect contributing to the disease d=0.05 (A), d=0.1 (B) and d=0.15 (C) were given, respectively.
Figure 3 presents the power of the proposed PEM under three different correlation patterns (figure 3A–C) given same δ=0.1 with pathway length K=2. It suggests that the power of all six methods decreases when the correlation pattern increases, with figure 3A showing the highest power followed by figure 3B,C. Again, the bootstrap-based tests still have more advantageous performance than the other three.

Power of PEM under different sample size and different correlation patterns given K=2 and d=0.1. (A) for correlation pattern given  and
and  ; (B) for correlation pattern given
  and
and  ; (C) for correlation pattern given
  and
and  .
.
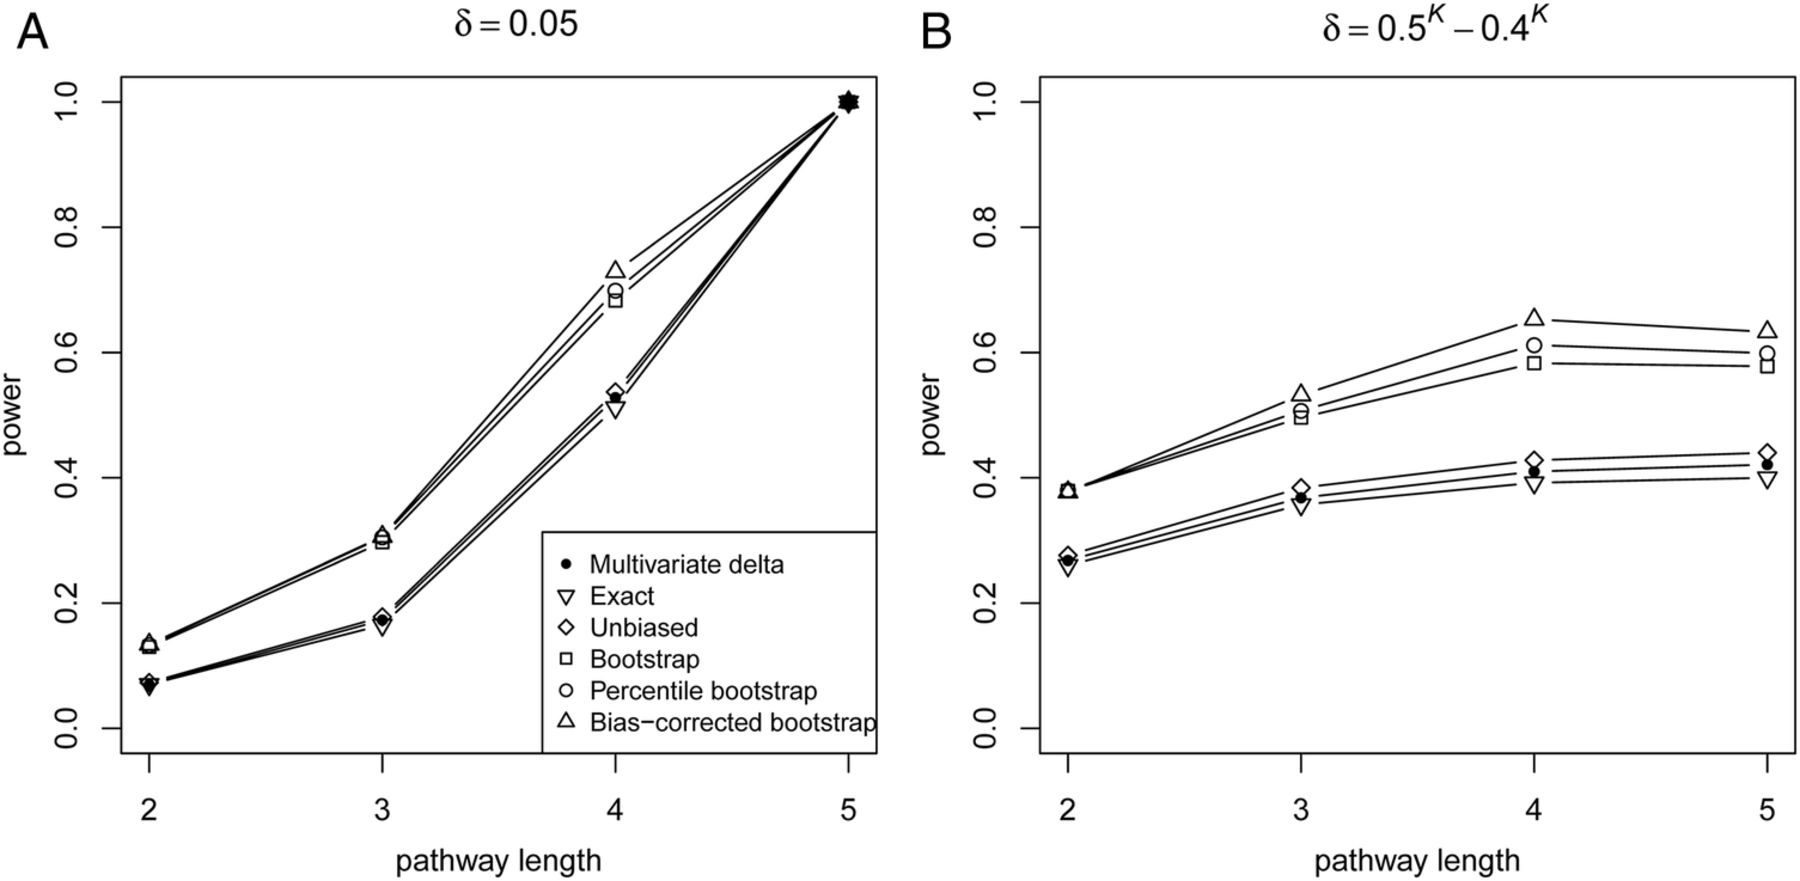
The power of the proposed PEM under different pathway length K is shown in figure 4. Figure 4A shows that the power increases monotonically with K, given the same δ. Moreover, figure 4B shows the power with the same correlation pattern, though δ decreases with the increase in pathway length, the power may still increase. In addition, UD with variance estimated via a bootstrap is more powerful than other variance-estimated approaches (exact, unbiased, multivariate Δ).

Power of PEM under different pathway length given sample size 300. (A) For different pathway length K given same d=0.05; (B) for different pathway length K given same  and
and  ,
,  .
.
Application result
Table 3 shows the results of the proposed PEM for detecting the pathway (Treg→TGFβ→Th17) effect contributing to AML. This pathway effect can be detected significantly at α=0.05 by the percentile bootstrap and bias-corrected bootstrap CI method, as well as by PEM-UD estimated the variance via the unbiased estimator,19 the multivariate delta estimator,20 the bootstrap estimator.17
The results of the pathway (Treg→TGFβ→Th17) effect contributing to acute myeloid leukaemia using six different methods
Discussion
Systems epidemiology couples traditional epidemiology with modern high-throughput technologies which seek to integrate pathway-based (or network-based) analysis into observational study designs to enhance the understanding of biological processes in the human organism. It provides a means to organise and study the interdependencies of factors (eg, genes, proteins, metabolites)23–28 at a human population level. Within this framework, the identification of pathways effects responsible for specific diseases has been one of the essential tasks. In the framework of bioinformatics, various methods existed for inferring biological networks29–31 aiming to mine underlying networks for identifying biological modules, clustering interactions, and topological features of the network such as degree and betweenness centrality.32–34 Despite these procedures for distinguishing specific pathway (or network) topology between different disease status, statistical inference at a population level remains unsolved, and further development is still necessary In summary, both the specific pathway (or network) topology and their effect on phenotype (or disease) should be considered in systems epidemiology data analysis. In this paper, we furnished two typical PEM to detect the pathway effect within a network between different disease status using the case–control design, expected to identify the specific pathway contributing to disease.
Our simulation showed that both D and UD kept stable under the null hypothesis with a large sample size. It indicated that the power of the proposed six methods increased monotonically with sample size, δ and K (figure 2 and 4A), and decreased when the correlation pattern increased (figure 3). Even though δ decreased, the power still increased with the increase in the pathway length under a fixed correlation pattern. Overall, the bootstrap-based tests (percentile bootstrap, bias-corrected bootstrap, variance estimated via a bootstrap) perform better than the other tests, with the bias-corrected bootstrap CI method having the highest power. Additional simulation also showed that all trends remained the same, regardless of the pathway length (see online supplementary figures S1 and S2). A significant pathway (Treg→TGFβ→Th17) effect contributing to AML has been detected in our real data (table 3). Not only does a functional antagonism exist between Th17 and Treg cells, but there is also a dichotomy in their generation,35 and Treg, TGFβ and Th17 have been confirmed to be associated with AML.36 Our results further demonstrated that the Th17–Treg correlation balance was impaired in patients with AML, suggesting that the Th17–Treg imbalance potentially plays a role in the pathogenesis of AML. In summary, the bootstrap-based methods are preferred for identification of the pathway effect contributing to disease.
A reviewer suggested that we show the conventional association parameters, for example OR. It is indeed important to obtain some association or effect parameters such as OR. However, unlike one single factor, it is extremely hard to define the pathway levels since one pathway usually refers to many factors with a specific topology structure. The aim of our study is to develop a novel statistical method for detecting the pathway effect within a network between different disease status using the case–control design; thus, the exposure unit is the pathway rather than one single factor.
Although PEMs were proposed under a case–control design, they can also compare the difference between any two groups (different times or treatment). For instance, the main problem for drug developers is that they have to determine which one can be chosen as a priority to be a therapeutic target when faced with many disease-specific pathways involved in complex networks. PEM can provide the researchers with one guide to choose the pathway that most likely contributes to the disease from a statistical perspective. Our results also highlight the great potential of the proposed PEM usage in systems epidemiology in advancing medicine research, and Th17–Treg balance may be a promising therapeutic approach in patients with AML. Although our proposed PEMs can be extended to a matched and nested case–control design, the distribution of PEM-D is still difficult to determine. The reason why the distribution of the difference in pathway effect between cases and controls is unknown is that our proposed method is derived from the multiplication of some correlated standardised coefficients. There seems to be little correlation with the epidemiological design.
One possible drawback of the proposed bootstrap-based methods is the computation burden on the bootstrap procedure used to evaluate the CI and SD of D, and theoretical justification work is highly desirable in future studies.
Conclusions
In this paper, we proposed two typical PEM to detect the pathway effect within a network between different disease status under a case–control design within the framework of systems epidemiology. Bootstrap-based PEM are valid and powerful for identifying the specific pathway contributing to disease, thus potentially providing new insight into the underlying mechanisms and more comprehensive ways to study the disease effects of specific pathways.
Acknowledgments
The authors wish to acknowledge their colleagues for their invaluable work and the participants who agreed to participate in the data collection.
References
Supplementary materials
Supplementary Data
This web only file has been produced by the BMJ Publishing Group from an electronic file supplied by the author(s) and has not been edited for content.
Files in this Data Supplement:
- Data supplement 1 - Online supplement
- Data supplement 2 - Online supplement
Footnotes
Contributors All authors conceptualised the study, acquired and analysed the data and prepared the manuscript, and read and approved the final manuscript.
Funding This work was supported by grants from National Natural Science Foundation of China (grant number 31200994 and 31071155).
Competing interests None.
Patient consent Obtained.
Ethics approval Medical Ethical Committee of Qilu Hospital, Shandong University, China.
Provenance and peer review Not commissioned; externally peer reviewed.
Data sharing statement No additional data are available.