Article Text

Abstract
Objectives To develop an instrument to assess attitudes and underlying beliefs about back pain, and subsequently investigate its internal consistency and underlying structures.
Design The instrument was developed by a multidisciplinary team of clinicians and researchers based on analysis of qualitative interviews with people experiencing acute and chronic back pain. Exploratory analysis was conducted using data from a population-based cross-sectional survey.
Setting Qualitative interviews with community-based participants and subsequent postal survey.
Participants Instrument development informed by interviews with 12 participants with acute back pain and 11 participants with chronic back pain. Data for exploratory analysis collected from New Zealand residents and citizens aged 18 years and above. 1000 participants were randomly selected from the New Zealand Electoral Roll. 602 valid responses were received.
Measures The 34-item Back Pain Attitudes Questionnaire (Back-PAQ) was developed. Internal consistency was evaluated by the Cronbach α coefficient. Exploratory analysis investigated the structure of the data using Principal Component Analysis.
Results The 34-item long form of the scale had acceptable internal consistency (α=0.70; 95% CI 0.66 to 0.73). Exploratory analysis identified five two-item principal components which accounted for 74% of the variance in the reduced data set: ‘vulnerability of the back’; ‘relationship between back pain and injury’; ‘activity participation while experiencing back pain’; ‘prognosis of back pain’ and ‘psychological influences on recovery’. Internal consistency was acceptable for the reduced 10-item scale (α=0.61; 95% CI 0.56 to 0.66) and the identified components (α between 0.50 and 0.78).
Conclusions The 34-item long form of the scale may be appropriate for use in future cross-sectional studies. The 10-item short form may be appropriate for use as a screening tool, or an outcome assessment instrument. Further testing of the 10-item Back-PAQ's construct validity, reliability, responsiveness to change and predictive ability needs to be conducted.
- Epidemiology
- Primary Care
- Pain Management
This is an Open Access article distributed in accordance with the Creative Commons Attribution Non Commercial (CC BY-NC 4.0) license, which permits others to distribute, remix, adapt, build upon this work non-commercially, and license their derivative works on different terms, provided the original work is properly cited and the use is non-commercial. See: http://creativecommons.org/licenses/by-nc/4.0/
Statistics from Altmetric.com
Strengths and limitations of this study
-
The Back Pain Attitudes Questionnaire (Back-PAQ) was developed based on in-depth interviews with people experiencing acute and chronic back pain.
-
The underlying structures and internal consistency of the instrument were explored using a large data set of 602 responses.
-
The 34-item long form of the questionnaire appears to have adequate internal consistency and may be appropriate for future cross-sectional studies.
-
The 10-item short form may be appropriate for use as a screening tool, or an outcome assessment instrument. This requires further testing of its construct validity, reliability, responsiveness to change and predictive ability.
Introduction
Back pain is a significant health problem associated with very high direct and indirect costs.1–6 The symptoms of back pain may persist for many months despite the absence of serious disease.7–9 A small proportion of people develop chronic back pain which is responsible for the majority of costs associated with back pain.4
Attitudes and beliefs are important factors in the development of back pain and disability.10 ,11 Systematic reviews have found fear avoidance beliefs (movement or activity being avoided for fear of pain or injury) and low expectations of recovery (expecting a delayed return to work or persistent pain) are independently associated with poor outcomes, such as delayed return to work, activity limitation and pain persistence.12 ,13 An improved understanding of the beliefs on which these constructs are based, and an ability to assess these in people who have back pain and the general public, could help to inform and target interventions to positively influence beliefs. Such interventions may, in turn, improve outcomes.14
Understanding the attitudes and beliefs of health professionals is also important as these are associated with their patients’ beliefs and their own adherence to clinical guideline recommendations regarding the provision and content of patient explanations and work and activity advice.15 Guideline consistent care produces better patient outcomes and improved satisfaction at a lower cost.16 ,17 Clinicians influence their patients’ understanding of their problem and recovery expectations, with many messages given by clinicians reinforcing patient perceptions that their back is vulnerable and needs to be protected.18
A number of instruments have been developed to assess the attitudes and beliefs of people experiencing pain in general,19–21 and the attitudes of the general public to back pain.22 These scales have been developed based on analysis of the literature and clinical experience rather than patient views. Only the Back Beliefs Questionnaire22 specifically relates to beliefs about back pain. Although developed and written for people with pain or the general public, many of these instruments have been adapted for assessing health professionals’ beliefs.23–26 The Health Care Providers Pain and Impairment Relationship Scale (HC-PAIRS) is one of the most commonly used measures.23 However, it assesses health professionals’ views about people with back pain, rather than their own beliefs. Some researchers have also felt it necessary to append a disclaimer apologising for use of the term ‘handicapped’, which may be considered offensive.27
Two questionnaires related to back pain have been developed specifically for health professionals: the Pain Attitudes and Beliefs Scale for Physical Therapists (PABS-PT)28 and the Attitudes to Back Pain Scale for musculoskeletal practitioners (ABS-mp).29 The PABS-PT aims to discriminate between biomedical and biopsychosocial treatment orientations in the management of chronic low back pain.28 This instrument was developed by adapting items from four questionnaires developed for patients, as well as items developed by the researchers. Consequently, many items focus on patient management rather than the therapist's own beliefs about back pain. A recent review found that evidence on the measurement properties of the PABS, although promising, was still lacking and required further investigation of content validity, interpretability and reliability.30 The ABS-mp also focuses on clinicians’ attitudes about managing back pain rather than their own beliefs about the back and back pain. As some of the items relate to the healthcare system, the authors advised caution if using outside of the UK.29
In order to understand beliefs about back pain we have conducted in-depth interviews with people experiencing acute and chronic back pain.18 These interviews have gone beyond the identification of attitudes associated with poor outcomes by identifying beliefs which underlie these constructs. These include the back being seen as vulnerable to injury and in need of protection. To test the validity of these findings among the broader New Zealand population we developed a novel survey instrument which incorporated items from previous surveys of population beliefs, as well as items specifically developed for the instrument. This instrument was designed to be appropriate for assessing beliefs of the general public, those experiencing back pain and health professionals.
The purpose of this paper is to describe the development of the instrument, and the subsequent item reduction, by means of exploratory analysis using principal components, to produce a scale which may be appropriate for future clinical and research use.
Methods
Initial instrument development
The development process for the Back Pain Attitudes Questionnaire (Back-PAQ) is summarised in figure 1.

Development of the Back Pain Attitudes Questionnaire (Back-PAQ).
Item generation
Qualitative interviews
In-depth interviews were conducted with 12 people experiencing acute back pain and 11 people experiencing chronic back pain in one region of New Zealand (for full details see Darlow et al18). These interviews aimed to explore underlying reasons for constructs like fear avoidance beliefs, low outcome expectations and catastrophising. Qualitative analysis, using the framework of Interpretive Description,31 identified six broad themes: (1) ‘the vulnerability of the back’; (2) ‘the need to protect the back’; (3) ‘the correlation between pain and injury’; (4) ‘the special nature of back pain’ (its impact, difference to other pain conditions and the need for professional care); (5) ‘activity participation while experiencing back pain’; and (6) ‘the prognosis of back pain’. Items were developed to reflect these themes.
Comparator questions
Items, consistent with themes which emerged in qualitative interviews, were drawn from previous surveys of population beliefs administered in Australia,14 Belgium,32 Canada,33 Norway34 and the UK.35 The original wording was maintained as far as possible to allow direct comparison.
Item selection and refinement
Items were suggested and reviewed by members of the multidisciplinary research team including: three physiotherapists (BD, MP and GDB), a biostatistician with a psychology background (JS), a general practitioner (TD), a clinical psychologist (FM), and an orthopaedic surgeon and rheumatologist (MM). All team members had experience in the conduct and analysis of back pain research and provided feedback on item suitability and wording.
Thirty-four items were included in the draft instrument: 27 from the qualitative analysis and seven from previous surveys. Items relating to similar concepts were included to explore alternative wording; redundancy was checked during data analysis. A full explanation of item derivation is provided in online supplementary appendix 1. All items were written in the second person to personalise the survey and to clarify that respondents were being asked about their personal beliefs regarding their own back. Text readability was assessed using the Microsoft Word Office Package (Microsoft Corp, Redmond, WA), following the procedure described by Badarudeen and Sabharwal.36 This provided a Flesch-Kinkaid grade of 2.9 (indicating the text is able to be read by a 3rd grader/9-year-old), and Flesch Reading Ease of 86.2% (scores from 90% to 100% indicate a text can be easily understood by an average 11-year-old student).
Layout
Items were divided into five sections containing conceptually related information. The layout was designed to improve ease of navigation and completion.37 A 5-point Likert scale was used and each scale point was labelled with a descriptive title, rather than a numeric value, to increase reliability and reduce positivity bias.37 The scale ranged from ‘False’ to ‘True’ (intermediate labels: ‘Possibly False’, ‘Unsure’, ‘Possibly True).35 The ‘True’ response option normally represented beliefs which are unhelpful for recovery from back pain. It was placed at the far end of the scale to reduce primacy effects (as analysis of qualitative interviews indicated this would be selected more frequently).37 Eleven items (1, 2, 3, 15, 16, 17, 27, 28, 29, 30, 31) were reversed compared with the normal direction of the survey.
Piloting of initial item set
The draft instrument was prepiloted with members of the research team and research colleagues with backgrounds in: general practice; survey instrument design; and conducting research with Māori participants. The draft instrument was then piloted with a convenience sample of 35 people. These participants had a range of back pain experiences (including people with chronic back pain who had offered to participate in the qualitative interviews but had not been recruited), a diverse age range and diverse occupational backgrounds.
Pilot participants provided written and verbal qualitative feedback. This indicated they were generally positive about the instrument and the item response options. Most participants reported taking about 5 min to complete the scale. Revisions were made to instrument layout, item wording and sequencing, based on feedback. Online supplementary appendix 2 presents the instrument as it was received by respondents in the main survey.
Exploratory analysis and item reduction
Participant selection and data collection
The data utilised to conduct this analysis were collected during a study to assess the prevalence of attitudes and beliefs about back pain in New Zealand. The full methods and results of this study are available elsewhere.38 Participants were eligible for inclusion if they were New Zealand citizens or residents aged 18 years and above. Participants were randomly selected from the New Zealand Electoral Roll (it is a legal requirement for all New Zealanders aged 18 years and above to be listed on this roll). Participants were excluded if they had an overseas postal address on the roll. In order to achieve an estimation accuracy of ±5% for prevalence data, 400 complete responses were required (http://www.openepi.com, accessed 30 May 2012). The likely response rate was estimated to be 40%,39 so 1000 respondents were randomly selected from the Electoral Roll by means of the PostgreSQL database management system V.9.1.4 (http://postgresql.org/; The PostgreSQL Global Development Group, California). Four hundred responses were also considered sufficient for analysis of principal components.40 Data were collected via a postal survey with up to three reminders (two additional complete survey packs and one postcard). An online response option was also available (http://www.surveymonkey.com).
Statistical analyses
Exploratory analysis and item reduction for use as research or clinical screening tool
Exploratory analysis was performed to investigate underlying structures of the instrument. Principal Component Analysis with Varimax rotation was used to maximise the distinction between components.41 Components needed to have a minimum Guttman-Kaiser eigenvalue of 1 to be selected. Items were removed if they had: (1) Pearson correlations with total scale score <0.3; and (2) component loadings <0.5.
Internal consistency
Cronbach's α was calculated for the entire 34-item scale and the reduced scale resulting from exploratory analysis together with its principal components. As Cronbach's α depends on the absolute number of items included,42 two criteria were used: for more than 10 items α > 0.70 was considered acceptable; for less than 10 items α>0.50 was considered acceptable.40 For the 34-item scale, the effect of item removal on consistency scores was analysed. For the reduced scale, inter-item correlations were assessed to ensure items correlated more with items within the same component than with items in other components.
The frequency of missing data was assessed across the whole data set, and within subgroups based on back pain experience. Missing data were handled by means of conducting complete case analysis. The number of cases included for each analysis is reported within the results.
Scoring
When the reduced item scale is used as a research or clinical screening tool, responses will be scored from −2 (‘True’) to +2 (‘False’). Beliefs which are unhelpful for recovery from back pain attract negative scores and vice versa. This may allow clinicians to quickly interpret scale and component scores and identify where explanations could be directed.
Results
Six-hundred and three responses were received; one response was excluded because the respondent reported an age of 17, and was therefore ineligible (one must be 18 to be on the electoral roll; this indicated he was either not the intended recipient, or had provided incorrect information). Six hundred and two responses were included in the analysis. Respondent characteristics are presented in table 1. No item had more than 2.3% missing data. The number of surveys with all items answered was comparable between people with no back pain experience (88%), past back pain (88%) and people with current back pain (87%).
Respondent characteristics
Data preparation
To prepare data for principal component analysis and item reduction, items were checked for inter-item correlation, as this would suggest redundancy.43 No items had Pearson correlations >0.65.
Back-PAQ item reduction
A total of 526 cases were included in the internal consistency analysis (76 excluded due to incomplete data). The complete 34-item scale had acceptable internal consistency (α=0.70; 95% CI 0.66 to 0.73). No significant improvement in α resulted from the removal of any items.
Exploratory analysis of principal components
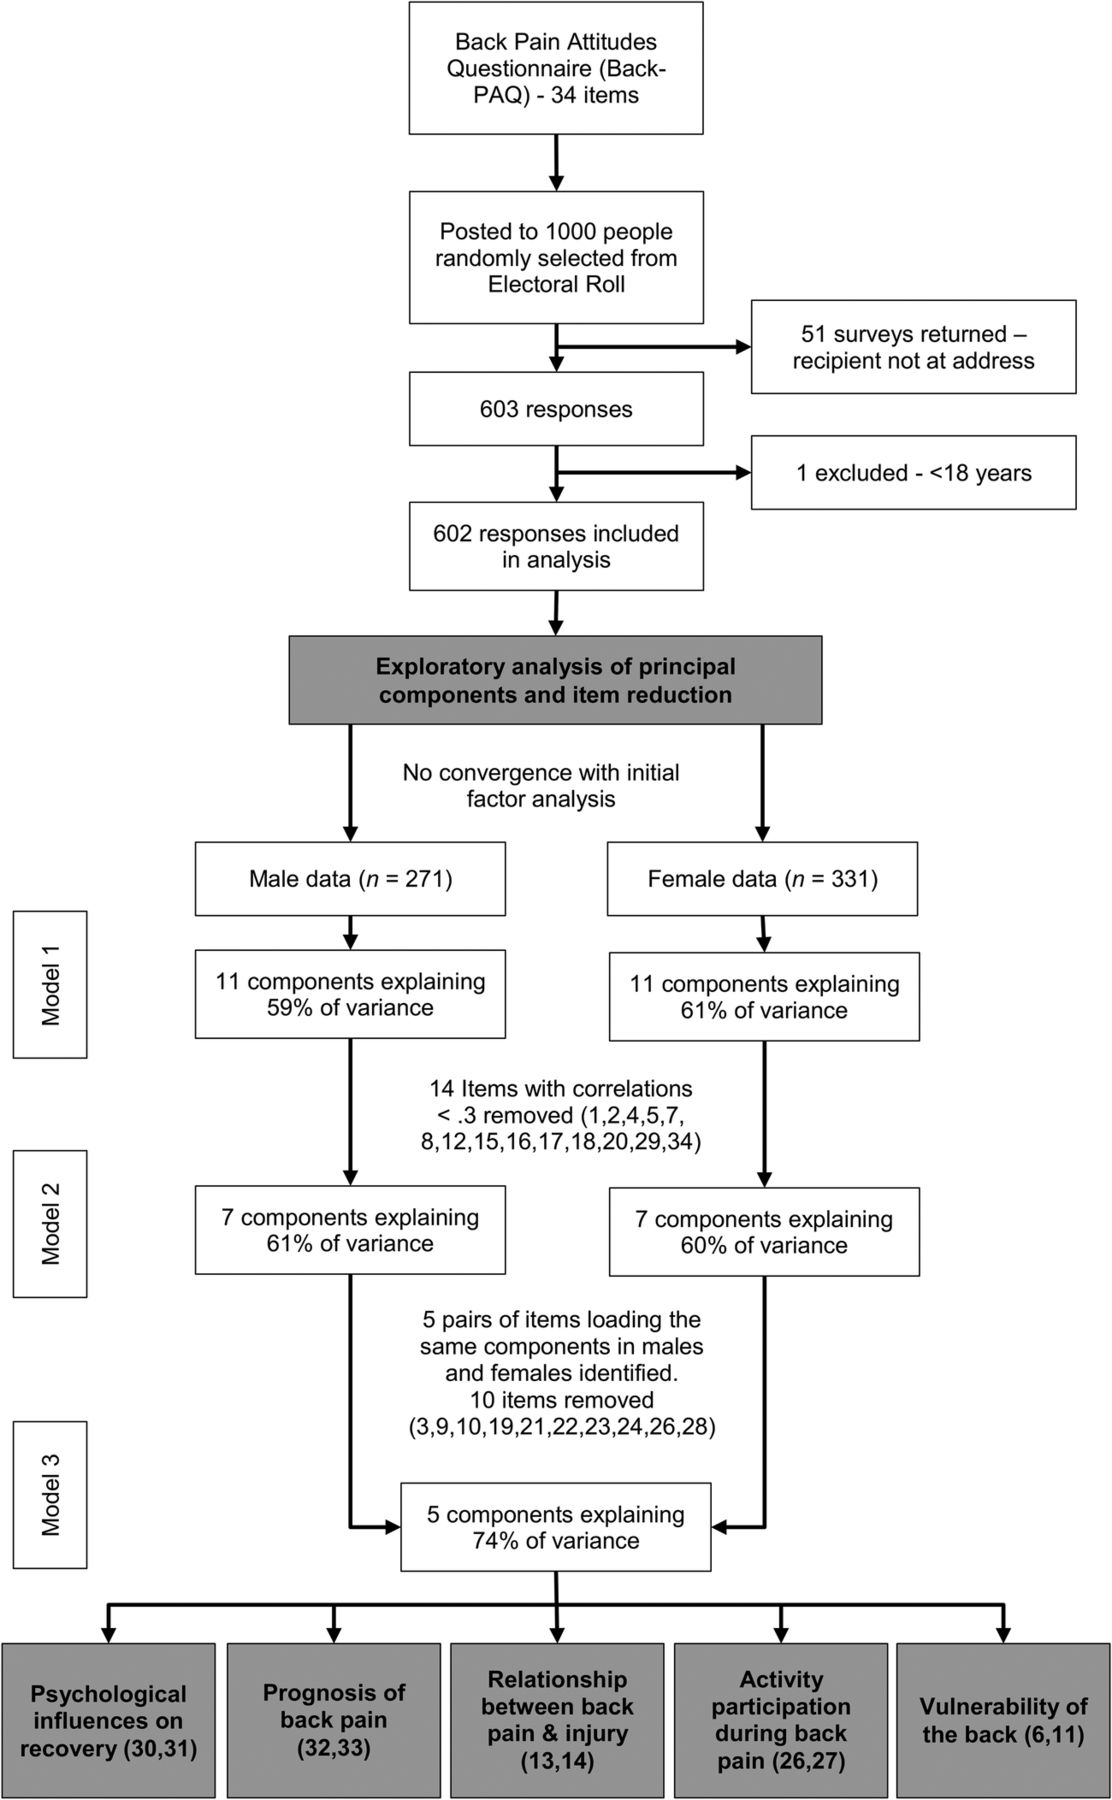
The exploratory analysis process is presented in figure 2.
Back Pain Attitudes Questionnaire (Back-PAQ) exploratory analysis of principal components and item reduction. Components required an eigenvalue ≥1 to be retained.
Model 1
All 34 items were entered into a Principal Component Analysis. Bartlett's test of sphericity (p<0.001) and Kaiser-Meyer-Olkin testing (0.71) indicated component analysis was appropriate for this data set.40 ,43 The model was unable to converge with 25 iterations. Dividing data by back pain experience did not result in convergence, whereas dividing data by gender indicated 11 components with eigenvalues ≥1. This model explained 60% of the variance in each gender group. Each component explained between 4% and 8% of the variance. It was conceivable that beliefs would be different in men and women,44 and so the analysis was continued with the male and female data sets separated. To reduce the variance, Pearson correlation coefficients were calculated between individual items and total scale scores. Fourteen items with correlations <0.3 were removed, and the model was retested.
Model 2
Twenty items were entered into the second model which indicated a seven component model in each gender group explaining 60% of the variance. Each component explained between 6% and 11% of the variance. Although male and female data sets were separated with the intention of producing gender-specific instruments, five pairs of items (10 items total) with loadings >0.5 mapped to the same components in men and women. Fourteen items were removed because they either did not load >0.5 to any components, or they loaded onto different components in men and women.
Model 3
These 10 items were entered in the third model using combined male and female data sets. This model indicated a five-component solution and accounted for 74% of the variance in the 10-item data set. No items cross-loaded onto more than one component and there were acceptable communalities (table 2).43 Each item correlated much more strongly within their component than between components. Each component was easily categorised, with four representing the original themes (‘the vulnerability of the back’, ‘the relationship between back pain and injury’, ‘activity participation while experiencing back pain’ and ‘the prognosis of back pain’); an additional component (‘psychological influences on recovery’) had also emerged. Each of these components explained between 13.7% and 16.7% of the variance (table 3). Two of the original themes were lost; these were (1) ‘the need to protect the back’, and (2) ‘the special nature of back pain’. A reduced component model was performed (forced model of four components) to see whether this resulted in a better fitting model. The model showed a reduction in overall variance explained (64.1%). Internal consistency was acceptable for the 10-item scale (α=0.61; 95%CI 0.56 to 0.66) and identified components (α between 0.50 and 0.78). Online supplementary appendix 3 presents the 10-item instrument.
Varimax rotated structure coefficients from the final exploratory analysis five-component model
Psychometric properties of the 10-item Back Pain Attitudes Questionnaire
Discussion
The Back-PAQ was designed so it could be answered by the general public, people with back pain and health professionals; this feature allows for use in a variety of contexts without modification, and also for the direct comparison of beliefs between groups. The instrument was tested with a large sample randomly selected from the general population and achieved a very good response rate (60%). The original long form of the instrument (34-item) and the reduced short form (10-item) resulting from Principal Component Analysis were found to have adequate internal consistency. Irrespective of back pain experience there was very little missing data. It appears the instrument was easy to complete, and this may have assisted with the good response rate.
Strengths and limitations
A key strength of this instrument is that items were generated to reflect themes identified during in-depth interviews with people experiencing acute and chronic back pain. Consequently, items reflect issues that are of importance to this population. This should contribute to the content validity of the instrument. Although health professionals and people without back pain did not participate in these interviews, subsequent interview research with general practitioners has demonstrated they hold many similar beliefs (manuscript under review); as such this instrument may also be appropriate for exploring health professionals’ beliefs. It is hoped that use of the second person throughout the instrument will result in people without back pain and health professionals presenting their own beliefs, rather than projecting their beliefs onto people with back pain, or providing their beliefs about people with back pain. This feature may improve comparison of beliefs between groups.
For many items, particularly those related to ‘the need to protect the back’ and ‘the special nature of back pain’, high proportions of respondents selected the most extreme option (‘True’). Although this ceiling effect may limit the discriminative abilities of the 34-item long form Back-PAQ, responses indicate that beliefs about the need to have strong muscles, good posture and special lifting techniques are very commonly held, despite a lack of evidence to support them. These two original themes did not become part of the final 10-item short form Back-PAQ scale because they are non-discriminating. Conceptually, the need to protect the back is related to the vulnerability of the back; this is reflected by one of the items in the final ‘vulnerability’ component coming from the original ‘vulnerability’ theme (item 6), and one from the ‘protection’ theme (item 11).
Exploratory analysis was appropriate for this study because, although we had developed the items based on themes identified through qualitative interviews, we did not know the extent to which these items actually met our assumptions.45 There are many varied techniques for analysing latent constructs.46 This is an iterative process which involves researcher judgements; it is possible that other researchers or methods may have produced different results.41 ,46 Notwithstanding this, the final model accounted for a large portion of the variance in the reduced data set, reflected the original interview themes on which the instrument was based and related well to the constructs identified by other researchers.46
The post hoc decision to split the data into male and female data sets to assist component identification, and then recombine the data into one data set for the final model could be viewed as being unusual; however, this process facilitated removal of items which had different latent constructs in men and women. Having a single tool which is appropriate for both genders should improve ease of use and interpretation.
Internal consistency of the 10-item Back-PAQ and its principal components, although acceptable, was low. This is unsurprising given the multiple dimensions, low number of items and similar variance explained by each component.40 ,42 ,47 The Back-PAQ was designed to have multiple themes which relate to different attitudes and beliefs about back pain. For this reason, Varimax rotation was appropriate for analysing component loadings. The similar weightings that each of these components have is a strength of the instrument, with the hypothesis being that unhelpful beliefs on one component may be balanced out by helpful beliefs on another. Although widely used, and included in quality assessment criteria,48 the use of α to measure internal consistency is debated.42 Low α is not a reason to discard the scale, given the reasons for its deflation are known, and the very high proportion of variance explained by these five components (74%).
Future research
The Back-PAQ is expected to have good construct validity with five robust components identified and easily characterised. However, this requires further testing by means of: confirmatory factor analyses among specific populations (eg, health professionals); examining convergent validity with existing instruments for assessing beliefs in these three groups (people with back pain, people without back pain and health professionals); and examining correlation with clinical behaviour among health professionals. The test–retest reliability and responsiveness to change also need to be assessed for each of these three groups. Finally, the predictive ability of the Back-PAQ on clinical outcomes needs to be examined for people with back pain and people who are pain-free, as well as examining the influence of health professionals’ beliefs (as measured by the Back-PAQ) on their patients’ clinical outcomes.48
Implications
The 34-item long form of this instrument may be useful for conducting cross-sectional surveys in other countries. The 10-item short form of the instrument may be useful as either a research instrument to measure changes in beliefs, or as a screening tool to predict outcome or direct management. The novel scoring system for the Back-PAQ means that it is very easy to interpret. Negative scores indicate beliefs which are presumed to be unhelpful for recovery from back pain, and positive scores vice versa. The five components may also indicate to health professionals areas in which a patient has unhelpful beliefs, so that they may focus explanation and reassurance on these areas.
Conclusions
We have developed two instruments for assessing attitudes about back pain among the general public, people with back pain and health professionals. The long form may be appropriate for use in future cross-sectional studies, and the short form may be appropriate for use as a screening tool, or an outcome assessment instrument. Further testing of the 10-item Back-PAQ's construct validity, reliability, responsiveness to change and predictive ability needs to be conducted.
Acknowledgments
The authors acknowledge the people who participated in qualitative interviews, those who piloted the draft instrument and those who responded to the postal survey.
References
Supplementary materials
Supplementary Data
This web only file has been produced by the BMJ Publishing Group from an electronic file supplied by the author(s) and has not been edited for content.
Files in this Data Supplement:
- Data supplement 1 - Online appendix1
- Data supplement 2 - Online appendix2
- Data supplement 3 - Online appendix3
Footnotes
-
Contributors BD, MP, FM, JS, MM, RM, GDB and AD were involved in the design of the study. BD conducted qualitative interviews; BD, MP, FM, GDB and AD analysed qualitative data. BD, MP, FM, JS, MM, GDB and AD developed the survey instrument. BD and RM did the statistical analysis. BD wrote the first draft. All the authors helped revise the paper. BD is the guarantor for the study. All the authors had full access to all of the data in the study and can take responsibility for the integrity of the data and the accuracy of the data analysis.
-
Funding This study received funding from the Physiotherapy New Zealand Scholarship Trust and from Lotteries Health Research.
-
Competing interests None.
-
Ethics approval This qualitative component of this study was approved by the New Zealand Central Regional Ethics Committee (CEN/11/EXP/014). The survey component was approved by the University of Otago Ethics Committee (D12/255). Consultation was undertaken with the Ngāi Tahu Research Consultation Committee.
-
Provenance and peer review Not commissioned; externally peer reviewed.
-
Data sharing statement The data set used for exploratory analysis can be obtained by emailing ben.darlow@otago.ac.nz