Article Text

Abstract
Objectives To explore the prevalence of attitudes and beliefs about back pain in New Zealand and compare certain beliefs based on back pain history or health professional exposure.
Design Population-based cross-sectional survey.
Setting Postal survey.
Participants New Zealand residents and citizens aged 18 years and above. 1000 participants were randomly selected from the New Zealand Electoral Roll. Participants listed on the Electoral Roll with an overseas postal address were excluded. 602 valid responses were received.
Measures Attitudes and beliefs about back pain were measured with the Back Pain Attitudes Questionnaire (Back-PAQ). The interaction between attitudes and beliefs and (1) back pain experience and (2) health professional exposure was investigated.
Results The lifetime prevalence of back pain was reported as 87% (95% CI 84% to 90%), and the point prevalence as 27% (95% CI 24% to 31%). Negative views about the back and back pain were prevalent, in particular the need to protect the back to prevent injury. People with current back pain had more negative overall scores, particularly related to back pain prognosis. There was uncertainty about links between pain and injury and appropriate physical activity levels during an episode of back pain. Respondents had more positive views about activity if they had consulted a health professional about back pain. The beliefs of New Zealanders appeared to be broadly similar to those of other Western populations.
Conclusions A large proportion of respondents believed that they needed to protect their back to prevent injury; we theorise that this belief may result in reduced confidence to use the back and contribute to fear avoidance. Uncertainty regarding what is a safe level of activity during an episode of back pain may limit participation. People experiencing back pain may benefit from more targeted information about the positive prognosis. The provision of clear guidance about levels of activity may enable confident participation in an active recovery.
- Epidemiology
- Rehabilitation Medicine
- Pain Management
- Primary Care
This is an Open Access article distributed in accordance with the Creative Commons Attribution Non Commercial (CC BY-NC 3.0) license, which permits others to distribute, remix, adapt, build upon this work non-commercially, and license their derivative works on different terms, provided the original work is properly cited and the use is non-commercial. See: http://creativecommons.org/licenses/by-nc/3.0/
Statistics from Altmetric.com
Strengths and limitations of this study
-
The attitudes and beliefs about the back pain of 1000 randomly selected New Zealanders were assessed using a novel survey instrument.
-
A 60% response rate was achieved and the sample appeared to be representative of the target population.
-
The lifetime prevalence of back pain among respondents was 87% (95% CI 84% to 90%); this figure, although similar to previous studies, may be inflated as people who have not experienced back pain may be less likely to respond to a survey about back pain.
-
The limited number of respondents who had not experienced back pain generally resulted in inadequate power to demonstrate differences between their beliefs and those of people who had experienced back pain.
Introduction
Low back pain (LBP) is a common health problem worldwide,1 and is one of the leading causes of health loss in New Zealand (NZ).2 Costs associated with LBP represent a major financial burden in NZ and internationally.3–7 Although most episodes of LBP are self-limiting and not related to serious disease,8 a significant proportion of people are not fully recovered 12 months after onset.9
Attitudes and beliefs are important factors in the development of back pain and related disability.10–12 Fear avoidance beliefs and low recovery expectations are independently associated with poor outcomes, including delayed return to work, activity limitation and pain persistence.13 ,14 Previous surveys have found that attitudes and beliefs inconsistent with current research evidence were prevalent in Australia,15 Belgium,16 Canada,17 Norway18 and the UK.19
Attempts have been made to change beliefs at a population level in order to improve back pain outcomes, but these have had mixed, and largely unsatisfactory, results.17 ,20 ,21 Interventions to modify attitudes and beliefs about back pain must not only be developed with knowledge of any unhelpful beliefs which are prevalent, but also the basis on which these beliefs are constructed. Recent qualitative research has indicated that fear avoidance beliefs may be based on an underlying idea that the back is vulnerable to injury and needs to be protected, and that activity participation may be limited by risks perceived as associated with activity.22 The Back Pain Attitudes Questionnaire (Back-PAQ) was developed following these interviews with people experiencing acute and chronic LBP.23 It aims to assess beliefs which underlie common attitudes about back pain.
New Zealanders may have different beliefs to those found overseas. NZ has a unique universal accident compensation scheme. The Accident Compensation Corporation (ACC) scheme has a focus on public education and has previously run comprehensive multimedia education campaigns relating to back pain prevention and management. It is therefore important that NZ beliefs are investigated to establish a current baseline and identify which beliefs (if any) should be targeted with future NZ campaigns.
This study aimed to (1) explore the prevalence of beliefs about back pain in NZ and (2) compare certain beliefs based on back pain history or health professional exposure.
Methods
Participants
NZ citizens or residents aged 18 years and over were sampled via the NZ Electoral Roll. It is a legal requirement for all New Zealanders aged 18 years and over to be listed on the Electoral Roll. The Electoral Commission estimate that over 90% of eligible voters are enrolled.24 New Zealanders of Māori descent can opt to be on the General Electoral Roll or the Māori Electoral Roll. People who were listed on the Electoral Roll but had overseas postal addresses were excluded from this survey.
The sample size calculation indicated that 400 complete responses were required (http://www.openepi.com, accessed 30 May 2012) to achieve an estimation accuracy of ±5% for prevalence data. The likely response rate was estimated to be 40%,25 so 1000 respondents were randomly selected from the Electoral Roll. The random sample was generated by using the ‘random() function’ in the PostgreSQL database management system V.9.1.4 (http://postgresql.org/; The PostgreSQL Global Development Group, California, USA). Māori and non-Māori respondents were selected in proportion with the overall NZ population to correct for under-representation of Māori on the Electoral Roll.26 ,27 At the time of the survey, 15% of the NZ population were estimated to be Māori.28 Accordingly, 150 names were randomly selected from the Māori Electoral Roll, and the remaining 850 were randomly selected from the General Electoral Roll. Although some Māori choose to be on the General Electoral Roll, the degree of oversampling this produced was considered to be appropriate given that Māori are less likely to respond to postal surveys.29 Each respondent was allocated a random survey code.
Survey instrument
The Back-PAQ was used to collect data. The development of the Back-PAQ has been described elsewhere.23 The Back-PAQ contains 34 items scored on a five-point Likert scale, with response options ranging from ‘False’ to ‘True’. The items were derived from the analysis of qualitative interviews with people experiencing acute and chronic back pain,22 as well as items used in previous surveys of beliefs.16–19 ,30 For items scored in a forward direction, higher scores (‘True’ responses) indicate beliefs unhelpful for recovery from back pain. The questionnaire contains 11 reverse scored items (1,2,3,15,16,17,27,28,29,30,31).
Gender, age and ethnicity questions were included to allow sample description. Questions related to back pain experience (‘never had back pain’, ‘had back pain in the past’, ‘currently have back pain’) and healthcare professional (HCP) exposure (‘never seen a health professional for back pain’, ‘seen a health professional for back pain’) were included to allow subgroup comparisons.
Data collection
Data were collected via postal survey. In September 2012, all 1000 respondents were posted an invitation to participate and a survey, together with a postage-paid return-addressed envelope. Respondents were offered postal and online (http://www.surveymonkey.com) response options. Two weeks later, a reminder letter with a second copy of the survey was posted to those from whom responses had not been received.31 Two weeks later, a reminder postcard was sent to those from whom responses had not been received. Eight weeks later, a final reminder letter and third copy of the survey was sent to those from whom responses had not been received.
Respondents who replied within 3 weeks were offered the chance to enter a major prize draw (two prizes of approximate value NZ$900).32 Respondents who replied within 10 weeks were offered the chance to enter a minor prize draw (five prizes of value NZ$100). A chocolate bar was included with the third (final) distribution of the survey. Data collection was completed on 4 March 2013; surveys which were returned after this date (n=1) were not included in the results.
Statistical analysis
All analyses were conducted using SPSS V.20.0 for Windows software (SPSS, Inc, Chicago, Illinois, USA). Descriptive statistics were calculated for item scores and total scale scores (reversed item scores were corrected before total scale score calculation; a minimum of 17 valid responses was required). Frequency results are presented with ‘False’ and ‘Possibly False’ categories combined, and ‘True’ and ‘Possibly True’ categories combined. An α level of 0.05 was used to judge significance for a priori hypothesis tests. CIs for prevalence data were calculated using Fisher's exact method.33 Missing data were handled by conducting complete case analysis. The number of cases included for each analysis is reported within the results. A sensitivity analysis was conducted for back pain prevalence assuming that all non-respondents did not have back pain. A biostatistician (JS) oversaw the analyses.
Differences in response means for preselected items, according to back pain experience (items 1,6,11,22,28,32,33,34) and HCP exposure (items 3,4,5,7,8,10,13,22,25,27), were calculated using one-way analysis of variance (ANOVA). Only those who reported having experienced back pain were included in the HCP exposure analysis. Post hoc analysis using Tukey's honestly significant difference test was performed following significant ANOVA results to ascertain which group means for the three categories of back pain experience were significantly different from each other. Although some data were not normally distributed, due to the sample size, the distributional assumptions on which the ANOVA is based were considered to have been met (central limit theorem). CIs for differences were based on post hoc tests: Tukey's test for differences according to the back pain experience group and t-distribution-based CIs for differences according to HCP exposure. Linear regression models were used to examine the effect of adjusting main effects (back pain experience, HCP exposure) for covariates that might differ by these groups (age, sex and HCP exposure when analysing by back pain experience).
One-way ANOVA with age as the dependent variable was used to examine the relationship between responses to item 5 (‘Lifting without bending your knees is not safe for your back’) and age.
Results
In all, 602 valid responses were received between 7 September 2012 and 14 February 2013, a response rate of 60%. One response was excluded because the respondent reported being 17 years old and therefore ineligible (one must be 18 to be on the Electoral Roll; this indicated either that he was not the intended recipient or that he had provided incorrect information on the returned survey). Two respondents only completed demographic items; they were included in the study as they contributed to prevalence data on back pain and HCP usage; however, they did not contribute to item or total scores. Fifty-one of the non-response survey packs were returned unopened because the respondent was no longer at the address listed on the Electoral Roll. The characteristics of respondents are shown in table 1. All proportions presented have a maximal margin of error of ±4% due to the sample size of 602. No item had more than 2.3% missing data. The number of surveys with all items answered was comparable between people with no back pain experience (88%), past back pain (88%) and current back pain (87%).
Respondent characteristics
Lifetime prevalence of back pain among respondents (n=601) was reported as 87% (95% CI 84% to 90%), and point prevalence as 27% (95% CI 24% to 31%). As a sensitivity analysis, if it were assumed that all non-respondents did not have back pain, this would provide a minimum possible lifetime prevalence of 53% (95% CI 49% to 56%) and point prevalence of 16% (95% CI 14% to 19%).
Item and scale responses
Response means and proportions selecting ‘True’ or ‘Possibly True’ responses for individual items are shown in table 2. ‘True’ and ‘Possibly True’ responses have been combined to improve ease of interpretation. Proportions selecting each response for individual items are presented in online supplementary table S1. Although 76% of respondents believed that their back was one of the strongest parts of their body (item 1) and 78% thought that their back was well designed (item 2), 89% thought that their back was easy to injure (item 6) and 95% believed that they could injure their back if they were not careful (item 11); 403 (67%) respondents selected ‘True’ or ‘Possibly True’ to items 1 and 6 (figure 1). In order to protect the back, 99% thought that good posture was important (item 8), and 97% believed that they needed strong muscles (item 7). Furthermore, 94% of respondents believed that it was not safe to lift without bending the knees (item 5).
Response means and frequency of True (‘True’ or ‘Possibly True’ responses) for individual Back Pain Attitudes Questionnaire (Back-PAQ) items

Scatter plot with density to display the correlation between item 1: ‘Your back is one of the strongest parts of your body’ and item 6: ‘It is easy to injure your back’. The blocks represent the proportion of respondents who selected the same response options to these two items. The dashed line represents congruent beliefs (ie, the item directions are reversed). This demonstrates that the largest proportion of respondents had incongruent beliefs, that is, they believed their back to be strong (right hand side of the figure), but also easy to injure (top part of the figure).
Most respondents (84%) thought that they could injure their back and only become aware of the injury at a subsequent point in time (item 12); 64% thought a ‘twinge’ could be the first sign of a serious injury (item 14). 59% thought that if a movement causes pain, they should avoid it in the future (item 10), and 89% thought that by ignoring pain they may damage their back (item 22). 52% believed that there is always a weakness after having back pain (23% unsure; item 32).
Most respondents (94%) thought that having back pain makes it difficult to enjoy life (item 18), and 93% thought that it is hard to understand back pain if you have not had it yourself (item 20). A majority of respondents (72%) considered it worse to have pain in the back than the limbs (item 19).
In order to manage back pain, 85% of respondents believed that it was important to see an HCP (item 23), and 86% believed that they needed to know exactly what was wrong (item 24). Staying active during an episode of back pain was supported by 80% (item 27); however, 69% also thought they should take it easy (item 21), 55% thought the risks of vigorous exercise outweighed the benefits (26% unsure; item 26) and 25% believed exercise should be avoided (item 25). Many of the respondents who did not believe that exercise should be avoided also believed that the risks of vigorous exercise outweighed the benefits; 176 (29%) respondents selected ‘False’ or ‘Possibly False’ to item 25 and ‘True’ or ‘Possibly True’ to item 26 (figure 2).

Scatter plot with density to display the correlation between item 25: ‘If you have back pain you should avoid exercise’ and item 26: ‘When you have back pain the risks of vigorous exercise outweigh the benefits’. This demonstrates that many individuals (circa 10%) who believed that they should not avoid exercise if they have back pain also believed that the risks of vigorous exercise outweighed the benefits (ie, top left of the figure), whereas very few believed the reverse. This indicates that although most do not believe exercise should be avoided, they still view it as being a risky behaviour.
The mean Back-PAQ score was 3.39 (SD 0.37; 95% CI 3.36 to 3.42; n=598; 4 respondents provided insufficient valid responses); as this was greater than 3, it demonstrated that unhelpful beliefs were on average more prevalent than helpful beliefs (scores closer to 1 indicate helpful beliefs, and scores closer to 5 indicate unhelpful beliefs, with 3 being unsure). The mean frequency of ‘unsure’ responses across all items was 12.3% (range 1.2 to 28.7; lower quartile 6.5; median 12.8; upper quartile 17.5).
Subgroup analysis
Back pain experience
The association between back pain experience and preselected items is shown in table 3. People who had current back pain had significantly higher mean scores than those who had either past or no back pain experience, for items about the ease of injuring their back (item 6; figure 3), the presence of ongoing weakness following back pain (item 32; figure 4) and the chance that back pain will not resolve (item 33; figure 5). Those with current or no back pain experience had significantly higher mean scores than those with past back pain for the item about not being able to do a lot about a back problem (item 34). Estimates of differences adjusted for age/sex/HCP exposure were not materially different from the unadjusted estimates presented in table 3.
Analysis of variance for a priori cross tabulations of individual item means by back pain experience

Response distribution by back pain history for item 6: ‘It is easy to injure your back’.

Response distribution by back pain history for item 32: ‘Once you have had back pain there is always a weakness’.

Response distribution by back pain history for item 33: ‘There is a high chance that an episode of back pain will not resolve’.
HCP exposure
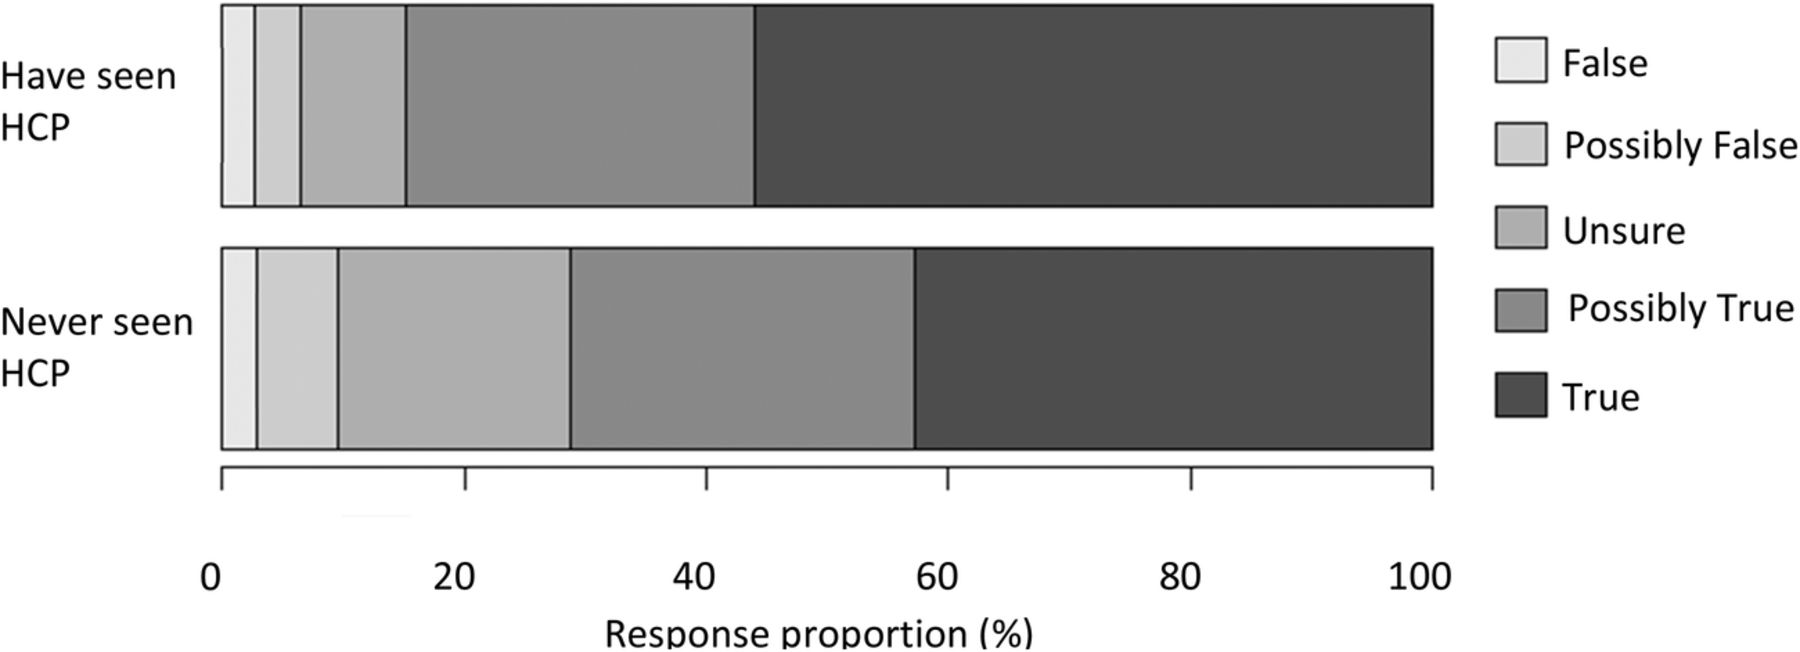
Only one of the a priori analyses related to HCP exposure for back pain demonstrated a significant difference (see online supplementary table S2). People who had seen an HCP had significantly more positive mean scores for item 27 related to staying active during an episode of pain (p=0.002, mean difference 0.3, 95% CI 0.1 to 0.5; figure 6). Adjusting for age and sex did not substantially alter mean differences.

Response distribution by healthcare professional (HCP) exposure for item 27: ‘If you have back pain you should try to stay active’.
Age
There were no significant differences in the mean ages for each of the response options to item 5 about the safety of lifting without bending the knees (p=0.17).
Discussion
Principal findings
This survey indicates that New Zealanders generally have negative attitudes and beliefs about their backs and back pain. Respondents strongly believed that their back was easy to injure and required the protection of strong muscles, good posture, lifting technique and being careful. Respondents also viewed back pain as being special in its impact and requiring professional care.
Meaning of the study
The proportion of respondents who reported believing that the back is a strong part of the body (76%) was very high and similar to a previous UK sample (60%).19 This belief did not mean, however, that the back was seen as being difficult to injure. Two-thirds of the respondents in this study believed that their back was strong and also easy to injure. This contradiction indicates that promoting the message that the spine is strong, to either patients with back pain or the general public, may need to be rethought. This message does not seem to empower people to confidently use the back. Pre-existing beliefs that the back needs protection to prevent injury may be reinforced by experiencing back pain following a trivial injury, and may also subsequently contribute to the development of avoidant behaviour.
Overall, there was uncertainty about links between pain and injury. Over half of the sample believed back pain means the back is injured (57%), and 89% believed ignoring pain could cause damage to the back. However, over half of the respondents also believed stress, and thoughts and feelings, could influence pain intensity. The proportion who believed thoughts and feelings could influence the intensity of pain (58%) was similar to that found in Belgium (64%).16 Over half of the respondents also believed worrying could negatively influence prognosis, while shifting focus away from the back and having positive expectations could improve the prognosis. Taken together, these findings suggest that many people are open to the idea that non-physical factors can influence their pain intensity and prognosis, but the presence of pain still indicates that the back is injured and should be protected.
A very high proportion of respondents believed they should stay active when they have back pain (80%); this is much higher than the proportions found to hold the same belief in Canada before (56%) and after (63%) a 3-year mass media campaign.17 ,34 This may reflect cultural differences in beliefs,16 ,35 different messages being delivered by health professionals in each country, beliefs about activity changing in a helpful direction over time, ACC's advertising in NZ influencing beliefs more effectively or other factors. Regardless, there was less certainty about how active to be. Many respondents thought they should take it easy while they have back pain (69%); this is similar to the 77% who agreed with the same statement in Belgium,16 but in contrast to 26% in a Norwegian sample.18 Vigorous activity was also viewed negatively, and a substantial minority (25%) believed exercise should be avoided; this figure is the same as in a UK sample.19 This may demonstrate that the generic message ‘be active’ has been received by a majority of New Zealanders, but there is less understanding about the safety of activity and exactly what form this should take. Encouragingly, respondents who had seen an HCP for back pain had more positive views about activity than those who had not.
This sample was positive about the general prognosis for back pain, with 64% agreeing that most pain settles quickly; this compares with 44% in the UK.19 However, only 29% of the sample did not believe there would be permanent weakness following an episode of back pain (ie, the majority were unsure or believed there would be a residual weakness); this is similar to findings in an Australian sample (22%).30 The belief that back pain results in ongoing weakness is likely to result in more back protection and avoidance, as well as altered appraisals of future back pain.22 This may be a key belief for HCPs to discuss with their patients.
Respondents with current back pain generally had more negative views than other respondents. In particular, they were more likely to report that the back was vulnerable and have negative views about the prognosis of back pain. Although these findings are statistically significant, it is not known if the differences in scores between groups are clinically relevant. This finding may be of clinical interest, given that low recovery expectations have a negative influence on outcome.14 Other studies have also found that people with current back pain have more negative views than those with previous pain.16 ,17 ,20 It has been suggested that recovering from back pain involves an active process whereby misconceptions are corrected.16 It makes sense that people would have more positive views about recovery if they had already found recovery to be possible.
The relationship between age and lifting beliefs was investigated because older participants in the qualitative interviews during instrument development frequently referred to the ‘Don't use your back like a crane’ message promoted by the ACC in the late 1980s, whereas younger participants did not mention this phrase. Current results demonstrate that although younger people may not articulate their belief in this way, they are similarly concerned about the dangers of lifting without bending the knees. This survey suggests that New Zealanders are being much more careful about lifting than they perhaps need to be, given that there is strong evidence that interventions to alter an individual's lifting technique or decrease lifting load have no impact on LBP incidence.36 ,37
Strengths and limitations
This study had a large sample size and a good response rate for a postal survey on a randomly selected sample from the general population. The sample was representative of the target population; in comparison with the 2013 NZ Census data,38 the sample was slightly older (census mean for those over 18=47 years) and had a slightly higher proportion of women (census proportion 51%). NZ European, Māori and Asian ethnic groups were represented proportionally to the NZ population (census proportions 74%, 15% and 12%, respectively). Under-representation of Māori on the Electoral Roll was effectively corrected by sampling respondents from the Māori Electoral Roll in proportion with the NZ population. Pacific Peoples were the only major population group to be under-represented (census proportion 7%). Consequently, these data have high generalisability within the NZ population.
Overall, there were very low levels of uncertainty in response to Back-PAQ items, and very little missing data, suggesting that respondents understood the items, and the response options were sufficient for respondents to feel comfortable making a selection. In contrast, uncertainty when responding to the Back Beliefs Questionnaire has been reported as being between 25% and 35% for each item.17
The sampling frame employed failed to select those within the target population who had not registered on the Electoral Roll (<10% of target population). Young people are assumed to be under-represented on the role, as are Māori because of their younger population demographic.26 ,27 ,39 This may explain why the sample was slightly older than the national average. The small difference in age is unlikely to have affected conclusions; a priori analysis of lifting beliefs did not demonstrate significant age-related differences, and adjusting for age did not alter mean differences for other a priori analyses.
The limited number of respondents who had not experienced back pain generally resulted in inadequate power to demonstrate differences between their beliefs and those of people who had experienced back pain (past or current). It is possible that those who have not had back pain are less likely to respond to a survey about back pain, and as such the prevalence figures may be inflated. However, the prevalence reported is similar to that in previous population surveys.17 ,30
Possible explanations for findings
This survey did not differentiate between those who were experiencing acute pain and those who had chronic symptoms. If a large proportion of respondents reporting current pain had chronic back pain, their negative prognostic beliefs may have been informed by experience of not recovering. However, the prevalence of chronic back pain in NZ has previously been reported to be only 4%.40
This survey did not demonstrate significant differences between the views of those who had and those who had not consulted HCPs, with the exception of more positive views about activity in the former group. This is in contrast to a previous systematic review which found strong evidence that HCP professional beliefs are associated with those of their patients,41 and qualitative research which found that HCPs have a strong influence on their patients’ beliefs.22 This survey was not specifically designed to investigate such an association, as it made no attempt to capture which HCPs had been consulted, or to record the beliefs of the HCPs whom the respondents had consulted. Heterogeneity among HCPs to whom the respondents had been exposed could result in influences of variable direction, and subsequently no consistent association in the current analysis. The positive association between HCP exposure and views about activity may suggest that HCPs are promoting guidelines to be active during an episode of LBP.42
Conclusions
This survey indicates that New Zealanders generally have negative views about the back and back pain, particularly with regard to the need to protect the back to avoid injury, and the special nature of back pain. It also suggests that there is uncertainty about how pain relates to injury. Although many hold positive beliefs about continuing to be active during an episode of back pain, there was uncertainty about what constitutes a safe or appropriate level of activity during an episode of back pain. Respondents with current back pain had more negative views about prognosis; this suggests that patients experiencing pain may benefit from targeted information about the positive prognosis. The beliefs of New Zealanders appear to be broadly similar to those of other Western populations. Consequently, the findings of this survey may also be of relevance outside of New Zealand.
Acknowledgments
The authors are grateful to Chris Almario from the New Zealand Electoral Commission for extracting the names of all registered voters from the Electoral Roll, and to Matthew Hunt for generating the random sample.
References
Supplementary materials
Supplementary Data
This web only file has been produced by the BMJ Publishing Group from an electronic file supplied by the author(s) and has not been edited for content.
Files in this Data Supplement:
- Data supplement 1 - Online table 1
- Data supplement 2 - Online table 2
Footnotes
-
Contributors BD, MP, JS, FM, MM, GDB and AD were involved in the design of the study. BD and JS prepared and cleaned the data and also did the statistical analysis. BD wrote the first draft. All authors helped revise the paper. BD is the guarantor.
-
Funding This study received funding from the Physiotherapy New Zealand Scholarship Trust and from Lotteries Health Research.
-
Competing interests None.
-
Ethics approval This study was approved by the University of Otago Ethics Committee (D12/255).
-
Provenance and peer review Not commissioned; externally peer reviewed.
-
Data sharing statement The full data set can be obtained by emailing ben.darlow@otago.ac.nz.