Article Text

Abstract
Objectives Diabetes is a major public health concern worldwide, particularly in low-income and middle-income countries (LMICs). Limited data exist on the status of access to diabetes medicines in LMICs. We assessed the utilisation and affordability of diabetes medicines in Iran as a middle-income country.
Design We used a retrospective time-series design (2000–2012) and assessed national diabetes medicines’ utilisation using pharmaceuticals wholesale data.
Methods We calculated defined daily dose consumptions per population days (DDDs/1000 inhabitants/day; DIDs) indicator. Findings were benchmarked with data from Organization for Economic Co-operation and Development (OECD) countries. We also employed Drug Utilization-90% (DU-90) method to compare DU-90s with the Essential Medicines List published by the WHO. We measured affordability using number of minimum daily wage required to purchase a treatment course for 1 month.
Results Diabetes medicines’ consumption increased from 4.47 to 33.54 DIDs. The benchmarking showed that medicines’ utilisation in Iran in 2011 was only 54% of the median DIDs of 22 OECD countries. Oral hypoglycaemic agents consisted over 80% of use throughout the study period. Regular and isophane insulin (NPH), glibenclamide, metformin and gliclazide were the DU-90 drugs in 2012. Metformin, glibenclamide and regular/NPH insulin combination therapy were affordable throughout the study period (∼0.4, ∼0.1, ∼0.3 of minimum daily wage, respectively). While the affordability of novel insulin preparations improved over time, they were still unaffordable in 2012.
Conclusions The utilisation of diabetes medicines was relatively low, perhaps due to underdiagnosis and inadequate management of patients with diabetes. This had occurred despite affordability of essential diabetes medicines in Iran. Appropriate policies are required to address the underutilisation of diabetes medicines in Iran.
This is an Open Access article distributed in accordance with the Creative Commons Attribution Non Commercial (CC BY-NC 4.0) license, which permits others to distribute, remix, adapt, build upon this work non-commercially, and license their derivative works on different terms, provided the original work is properly cited and the use is non-commercial. See: http://creativecommons.org/licenses/by-nc/4.0/
Statistics from Altmetric.com
Strengths and limitations of this study
-
To the best of our knowledge, this is the first study to evaluate the pattern of utilisation and affordability of diabetes drugs in a low-income or middle-income country over a period of time.
-
We used data from OECD countries to assess the adequacy of utilisation in Iran.
-
Our findings showed that utilisation of diabetes drugs does not seem to be adequate. Although the affordability of essential diabetes medicines is achieved, optimising the pattern of use requires screening for undiagnosed patients and improving management of diagnosed cases.
-
National wholesale data were used to estimate drug utilisation; however, these data may not reflect the real drug consumption by patients.
Introduction
Diabetes is a major public health concern worldwide, with an estimated global prevalence of 8.3% in 2011,1 ,2 while approximately 80% of patients with diabetes reside in low-income and middle-income countries.2 Proper management of diabetes consists of interventions targeting the patient’s diet, exercise status and prescribing medicines (insulin and oral hypoglycaemic agents).3 Currently, medicines are an essential part of diabetes management guidelines for most patients. Insulin would be started readily after diagnosis of type-1 diabetes and would be added to the therapeutic regimen of type-2 diabetes as required. In addition, oral hypoglycaemic agents, for example, metformin, are usually initiated alongside lifestyle modifications at diagnosis of type-2 diabetes.4 Thus, appropriate utilisation of diabetes medicines should be high on the agenda for health policymakers.5
Previous studies have reported different utilisation patterns of diabetes medicines in different countries.6–8 For example, Melander et al6 analysed data from 10 European countries (1994–2003) and identified an increasing trend in diabetes medicines’ consumption. They also observed large differences in utilisation patterns among these countries, and concluded that these might have occurred due to the differences in diabetes screening and management patterns in those countries.6 Few reports exist on the affordability of medicines and the utilisation patterns of diabetes medicines in low-income and middle-income countries where the burden of diabetes is believed to be more significant than high-income countries.2 ,9 National studies in Iran, an upper-middle-income country, have estimated a significant prevalence of diabetes in the country (7.7% in 2005 and 8.7% in 2007), of which over 45% were undiagnosed cases.10 ,11 Moreover, a meta-analysis reported that the prevalence of diabetes in Iran is increasing by 0.4% annually.12 Still, very few reports exist on the utilisation patterns of diabetes medicines in order to show the current situation of diabetes pharmacotherapy in the country.
Health and pharmaceutical system in Iran
The healthcare system in Iran is primarily based on a government funded primary healthcare system and social health insurance plans that facilitate access to secondary and tertiary care. The private sector is the main provider of ambulatory care in urban areas.13 In 2010, social healthcare insurance covered 84% of the population.14 Insurance organisations’ reimbursement policies for medicines follow a general rule: covering 90% of inpatient and 70% of outpatient costs if the provider has a contract with the insurance organisation.15 Almost all community and hospital pharmacies have contracts with major insurance organisations and the lowest priced generic product is usually set for reimbursement purposes. This means that the users might pay more than the 10% (inpatient care) or 30% (outpatient care) expected copayments at the time of use. Hence, major concerns exist among health policymakers regarding out of pocket expenditures for health services.16 Still, it has been argued that adequate affordability of medicines has been achieved in Iran.17 ,18 Implementation of a generic-based pharmaceutical policy including a highly regulated National Drug List and medicines pricing systems may have contributed to the assumed adequacy of access to medicines in Iran.19 ,20 Since 2001, international companies (brand or generic products) became more involved in the local pharmaceutical market and the market size expanded from US$661 million in 2003 (of which 20.5% were imported products) to over US$2.3 billion in 2008 (of which 33.6% were imported products).19 It is estimated that the pharmaceutical market size in Iran would be US$3.65 billion in 2013.21
Objectives
In the present study, we evaluated the trends of diabetes medicines’ utilisation in Iran during 2000–2012 using national pharmaceuticals wholesale data. We benchmarked our findings with available international data on diabetes medicines’ use. Finally, the trend of diabetes medicines affordability in Iran was evaluated as a potential determinant of medicines’ utilisation.
Methods
Design
A retrospective time-series design was used to investigate the trends of utilisation and affordability for diabetes medicines in Iran (2000–2012). We benchmarked the rate of drug utilisation with the most recent available data from 22 countries in 2011.
National data sources
Annual wholesale data were obtained from Iran’s Food and Drug Organization. The data are produced based on the sales’ reports of wholesale companies to community and inpatient pharmacies all over the country and has been available as an electronic medium since 2000. Each pharmaceutical product (medicinal dosage forms) is identified with a generic name and a unique code in the database and can be linked to the manufacturer or import company, the wholesale company, the number of sold items and their total retail price. Diabetes medicines available on the market during the study period were identified based on consultation with experts and the National Drug List. Several examinations were carried out to assess the quality of the data. Generic codes were set as the main standard for accuracy examination. We looked for discrepancies in recorded generic—or brand-generic codes, dosage forms, producer/importer and wholesale companies’ data. To standardise pharmaceutical consumption data per inhabitant, we obtained annual population figures from the Statistics Center of Iran.
International data source
We collected data on diabetes medicines utilisation in 22 countries of the Organization for Economic Co-operation and Development (OECD) via the Health Data: Pharmaceutical market database.22
Evaluating utilisation patterns in Iran
The Anatomical Therapeutic Classification/Defined Daily Dose (ATC/DDD) methodology was used to standardise the raw sales data. The latest version of the ATC/DDD guideline (2013) was retrieved from the website of the WHO Collaborating Centre for Drug Statistics Methodology.23 In the present study, the ATC codes of A10 group were used to standardise diabetes medicines. We used second (all diabetes medicines), third (insulin or oral hypoglycaemic agents) and fifth (individual pharmaceutical substance) level of ATC classification for each data line recorded in the data set and the DDD quantities were entered respectively. To calculate the number of DDDs per 1000 inhabitants per day (DID), the following formula was used: (number of DDDs×1000)/(number of population×365).6 We summarised the annual drug utilisation data for different ATC levels and calculated the utilisation growth rates. The annual share of utilisation for oral hypoglycaemic agents and insulin were calculated. The trend lines of utilisation over time were developed using the ‘add trend line’ command in the Microsoft Excel computer software.
We used the ‘Drug Utilization-90% (DU-90)’ methodology to compare the pattern of A10 utilisation with the Essential Medicines List (18th edition, 2013) published by the WHO.24 ,25 ATC codes which consisted 90% of total consumed DDDs in oral antidiabetic agents (A10B) and insulin preparations (A10A) categories were identified.
Benchmarking utilisation patterns
We compared the A10 consumption data for 22 OECD countries in 2011 with Iran's corresponding figures. We then selected a subgroup of OCED countries that has a diabetes prevalence of 8–10% (according to the International Diabetes Federation 2012 report 26), which is comparable to Iran. These countries were Australia, Finland, Estonia, Germany and Spain. We compared 2000–2011 trends of A10 utilisation in Iran with these countries.
Evaluating affordability
Affordability was operationalised as the number of minimum daily wage for covering the monthly cost of each medicine or a treatment protocol.27 We used the minimum daily wage defined by the Social Security Organization of Iran to calculate the affordability indicators. This official figure is announced each year and is closely comparable to the salary of the lowest paid government workers. If the monthly cost of a medicine or therapy combination was less than one minimum daily wage, it was considered as affordable.18
We calculated the affordability of each oral hypoglycaemic agent separately using the cost of a hypothetical monthly treatment (30 DDDs). For insulin, we calculated affordability for a hypothetical monthly treatment (30 DDDs) of commonly used insulin therapy combinations (NPH and regular, premixed NPH and regular, aspart and glargine, and premixed aspart). Insulin preparations had different prices and their prices varied during the period of study. Hence we calculated the price of each insulin combination therapy DDD (40 IU) in each year based on the proportions of annual insulin consumption in that year. As an example, for NPH and regular therapy combination, if NPH and regular insulin consumption accounted for 65% and 35% of the total consumption of NPH and regular in a defined year, one DDD cost of this therapy combination was calculated as 0.65 of one DDD of NPH plus 0.35 of one DDD of regular insulin for that year. The cost of syringes or needles required for conventional insulin or pen injectors was not included in the affordability model.
Results
Diabetes medicines’ (A10) consumption increased during the study period from 4.47 to 33.54 DID. However, the margin of annual growth varied widely from 34.6% in 2001 to 3.7% in 2012 and we observed a single negative growth rate of 15.4% in 2002. The increasing trend was detected for both A10A (insulin and analogues) and A10B (blood glucose lowering drugs, excluding insulin) categories. Nevertheless, A10B share of total A10 utilisation in DDDs was consistently over 80% throughout the study period. Figure 1 illustrates the trends of A10, A10A and A10B utilisations. A linear trend line provided a high correlation coefficient (R2) equal to 0.94.

Utilisation pattern of diabetes medicines (A10) in Iran (DDD, defined daily dose).
During the first 7 years, the only available drugs from A10A subgroup were NPH (A10AB02 and A10AB02), regular (A10AC01 and A10AC02) and mixed insulin (A10AD01) products. The beef-origin products were removed from the market in 2005. Novel insulin analogues were introduced to the market after 2007: insulin aspart (A10AB05) and insulin glargine (A10AE04) in 2007 and mixed aspart (A10AD05) in 2009. In the final year of study (2012), total utilisation of the novel preparations was less than 0.3 DID while 5.73 DID of NPH and regular insulin were consumed. Table 1 illustrates a summary of the utilisation figures for A10A drugs. The correlation coefficient of a linear trend line for A10A utilisation was 0.94.
Number of defined daily doses per 1000 inhabitants per day for A10A (insulin and analogues) medicines
In the A10B subgroup, the total amount of utilisation increased from 6.32 to 27.5 DID and a relatively consistent growth was observed during the 12-year period (R2 of a linear trend line=0.94). There were only three medicines available on the market during the first 3 years: glibenclamide (A10BB02), chlorpropamide (A10BB02) and metformin (A10BA02) while over 90% of A10B utilisation was due to glibenclamide use. Utilisation of metformin raised dramatically from 0.34 to 9.35 DID (27.5-fold) while glibenclamide use increased by 2.7-fold throughout the study period. In 2012, metformin comprised 33.9% of A10B utilisation while glibenclamide's share had decreased to 55.2%. New oral hypoglycaemic agents gradually entered the market, starting with gliclazide (A10BB09) and acarbose (A10BF01) in 2003 while chlorpropamide was removed from the market in 2004. Gliclazide, repaglinide (A10BX02) and pioglitazone (A10BG03; that entered the market in 2006) were among new oral agents that showed the highest rates of utilisation growth. However, a dramatic decline in gliclazide utilisation was observed in 2012. Table 2 shows a summary of the utilisation figures for A10B drugs.
Number of defined daily doses per 1000 inhabitants per day for A10B (blood glucose lowering drugs, excluding insulin) medicines
Over the study period, DU-90 drugs were identified for A10A and A10B subgroups. Regular and NPH insulin (beef or human origin) were on the list for A10A. Glibenclamide and metformin constituted the list for A10B until 2010 and gliclazide appeared in the list in the past 2 years. The WHO list of Essential Medicines (2013) includes regular and NPH insulin, glibenclamide, gliclazide and metformin from A10 group, all appearing on Iran’s DU-90 lists (figure 2).
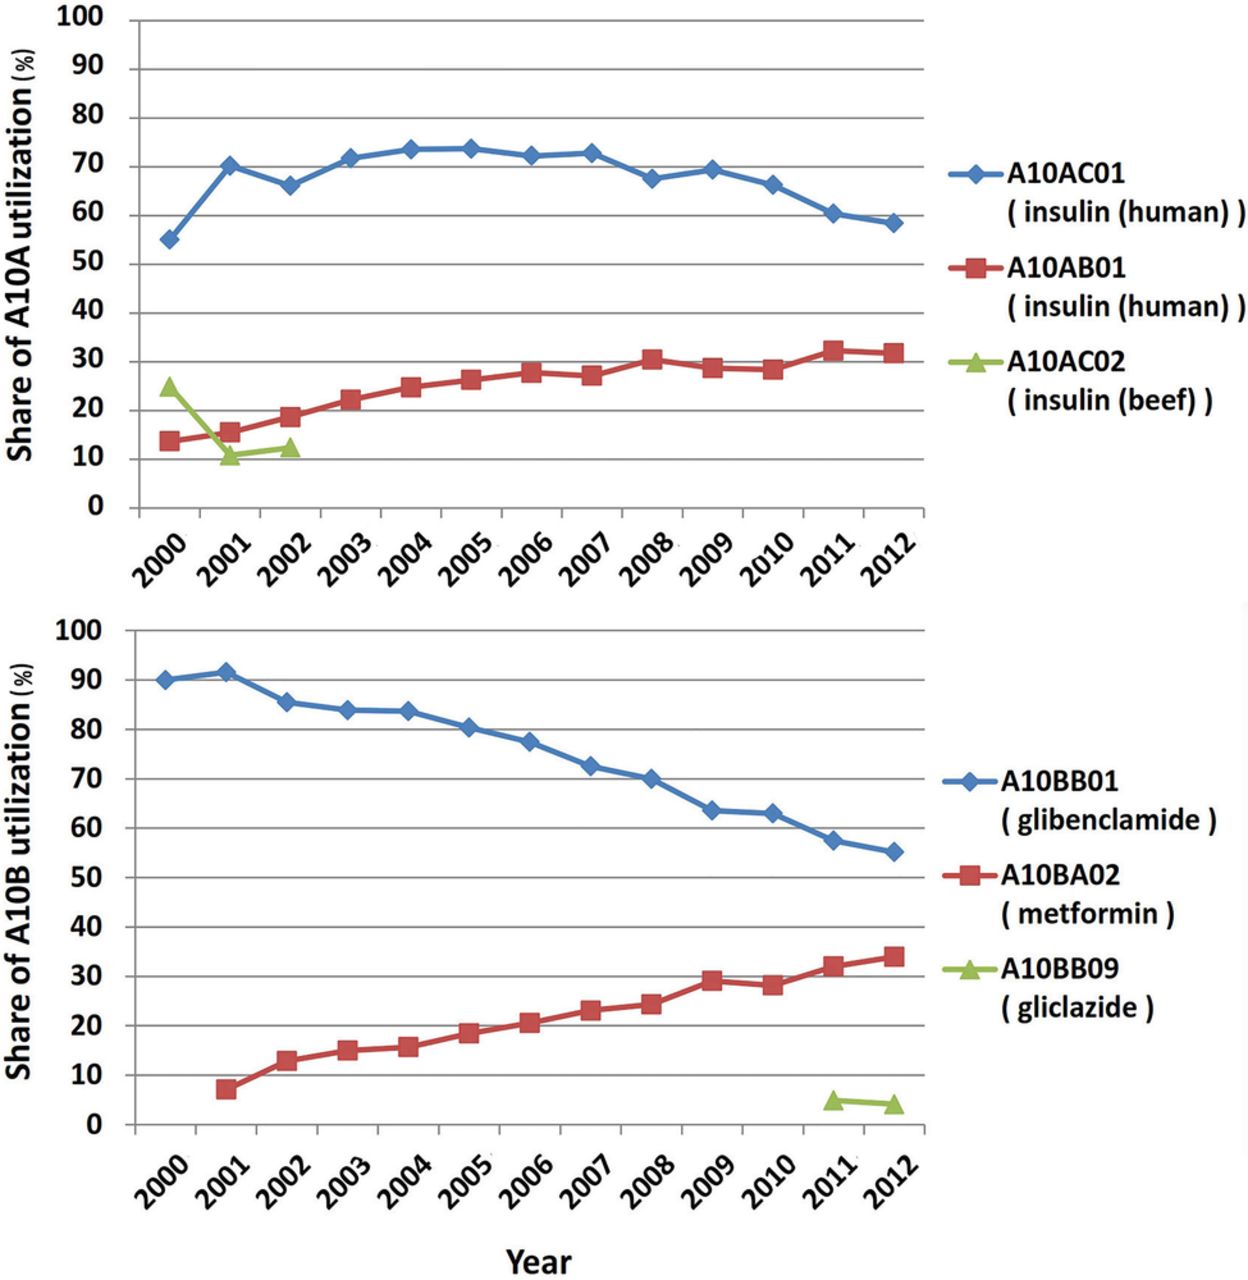
Pattern of Drug Utilization-90% for diabetes medicines in Iran.
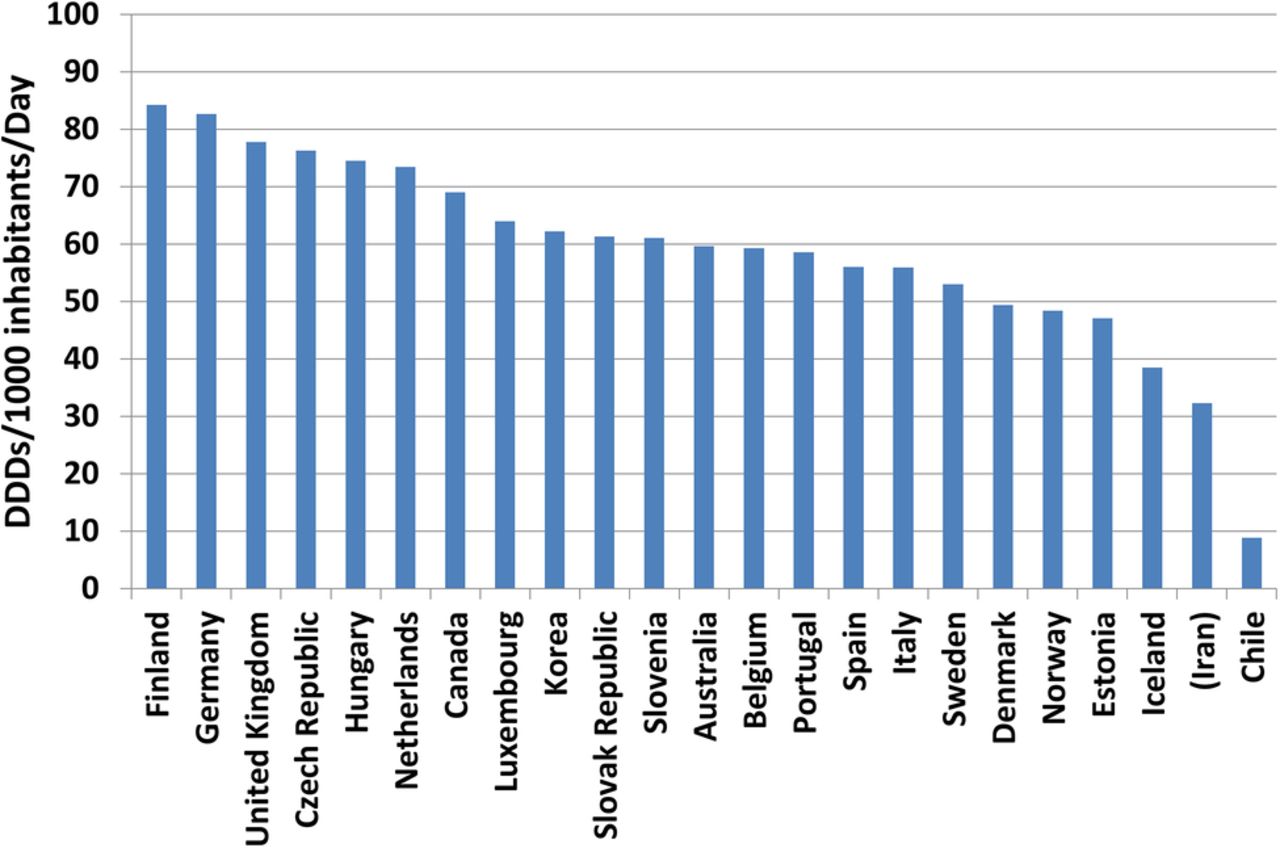
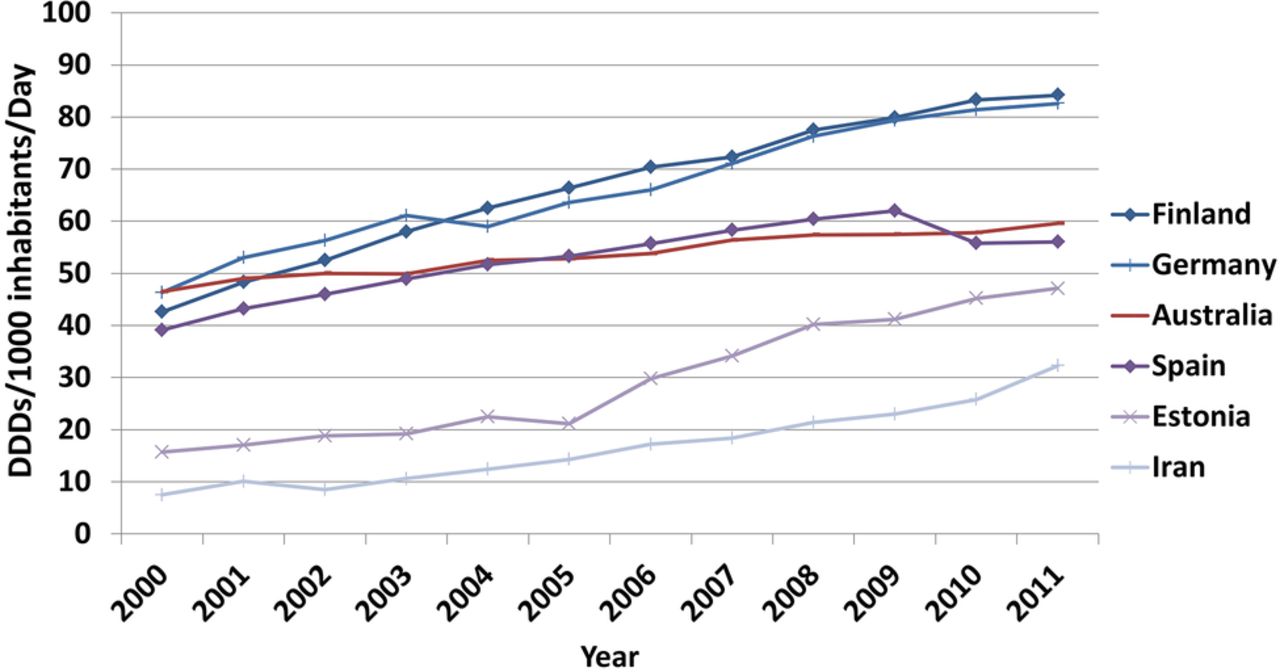
Benchmarking with OECD countries showed that Iran had a low A10 utilisation in 2011 (figure 3). The prevalence of diabetes in Australia, Finland, Germany, Spain and Estonia were similar to Iran in 2011 (8–10%). The utilisation of A10 medicines increased in all of these countries from 2000 to 2011 but the magnitude of growth was highest in Iran (430.7%). Nevertheless, the annual per capita A10 utilisation in Iran was consistently and substantially lower than those five countries during the benchmarking period (figure 4).

Benchmarking diabetes drugs utilisation in Iran with OECD countries (2011) (DDD, defined daily dose; OECD, Organization for Economic Co-operation and Development).

Benchmarking the trend of diabetes drugs utilisation (Iran and OECD countries with comparable diabetes prevalence according to IDF statistics). DDD, defined daily dose; IDF, International Diabetes Federation; OECD, Organization for Economic Co-operation and Development.
Treatment with metformin, glibenclamide or even the combination therapy has been consistently affordable over the study period and the combination therapy cost was approximately half a minimum daily wage in 2012. Newer A10B agents became relatively more affordable after their initial introduction into the market and the cost of treatment with gliclazide, repaglinide or pioglitazone was affordable in 2012 (0.1, 0.5 and 0.6 of minimum daily wage, respectively).
Treatment with regular and NPH insulin was consistently affordable during the study period (0.1–0.6 minimum daily wage) but premixed insulin only became affordable during the past 3 years. Treatment with novel insulin preparations including premixed aspart insulin and aspart/glargine combination has never been affordable since their presence on the market. In 2012, treatment with premixed aspart insulin cost 4.8 minimum daily wages and combination therapy with aspart and glargine insulin required 5.8 minimum daily wages. Figures 5 and 6 illustrate the pattern of diabetes medicines affordability over the study period.

Affordability of oral hypoglycaemic agents in Iran.

Affordability of insulin preparations in Iran.
Discussion
Our findings showed that A10 utilisation increased approximately sevenfold over a 13-year period (2000–2012) from 4.47 to 33.54 DID. The growth of diabetes prevalence may explain the rise of A10 utilisation to some extent. A longitudinal study on the prevalence of diabetes in Iran reported that diabetes rate among Iranian adults increased approximately twofold during 1999–2007 period.28 In addition to the rise in diabetes prevalence, the evidence on the efficiency of diabetes intensive management and the essential role of metformin should be considered as important underlying factors in the upsurge of A10 utilisation during the last decade.5 ,29
Insulin preparations (A10A) seem to be underutilised in comparison with oral hypoglycaemic agents (A10B) during the study period. In 2012, insulin utilisation only comprised 17% of total A10 consumption. A report from 10 European countries showed that the share of insulin utilisation in 2003 was over 30% in nine countries and the data from Sweden, Norway, Germany, Denmark and England revealed similar figures at above 40%.6 It should be noted that some guidelines recommend early use of insulin for the management of type-2 diabetes.3 Thus, we consider underutilisation of insulin a salient signal of irrational A10 use in Iran. A few studies have reported inadequacy of physicians’ knowledge about clinical guidelines and also patients’ concerns about insulin injection in Iran.30–32 Although further research is required to expand our knowledge of insulin underutilisation factors, effective educational interventions could be recommended to improve healthcare professionals’ and patients’ attitudes and behaviour towards appropriate and timely use of insulin for diabetes management.33 ,34 Other barriers to insulin use include the availability and affordability of syringes/needles for insulin injection or the blood glucose monitoring tests required for tight glucose control.35 Such barriers have been highlighted by Beran et al in a series of reports which necessitates further studies to evaluate the affordability of diabetes care rather than diabetes medicines alone.35 ,36
The pattern of A10B utilisation revealed a few important issues. Glibenclamide has been used for several decades in Iran and comprised the highest share of utilisation during the study period. This medication was recommended by WHO as an essential medicine until 2013; however, the latest WHO list of essential medicines recommends gliclazide particularly for elderly patients to avoid hypoglycaemia side effects.25 Despite a rapid growth in gliclazide utilisation and its appearance on the DU-90 list from 2011, policies and educational intervention are necessary to modify local pharmaceuticals production and also physicians’ prescribing behaviour. The negative growth rate for gliclazide utilisation in 2012 requires further elaboration. During this year, drug shortages were quite common in the country due to sanctions on the Iranian financial and trading system which significantly affected drug import and local production.37 ,38
In comparison with the OECD countries, A10 utilisation appears to be inadequate in Iran. One of the main reasons may be the high rate of undiagnosed diabetes.10 OECD data are based on information provided by the authorities in each country. Some countries provide wholesale data while others use prescription databases. They may also differ in collecting over-the-counter, hospital and non-reimbursed drug use data. However, drug utilisation data from Czech Republic, Denmark, Estonia, Finland, Slovak Republic and Sweden reported wholesale data which were similar to our data source from Iran in the present study.39
As expected, the analyses demonstrated that most A10 medicines were affordable during the study period. It seems that the main factor in the affordability of the medicines was the pricing system in Iran for generic medicines. Medicines prices are highly regulated in Iran by the Pricing Committee, Food and Drug Organization. The decline pattern in the ‘number of daily wage’ for some of the newer A10 drugs can be justified by the fact that local production usually begins some years after a pharmaceutical entity is registered and imported. New products (oral agents or insulin) remained unaffordable until their retail price is dramatically reduced.
It should be noted that we did not consider the effect of insurance coverage on the treatment cost and also did not include cost of syringes required for insulin injections. Still gradual increases in the population coverage of the insurance organisations from 74% in 2002 to 83% in 2010 may have contributed to better access.14 As our findings showed, little concern may exist regarding the affordability of conventional insulin preparations; however, use of novel preparations and pen injectors may be limited by the treatment cost. In 2013 the new glargine and aspart insulin were added to the insurers benefit package, albeit with a higher copayment rate due to a reference pricing approach, which may result in better access to these medicines in future. Future studies should evaluate the share of insurance plans in providing access to A10 medicines in Iran.
Limitations
We used ‘consumption’ and ‘utilisation’ terms interchangeably throughout the article. Nevertheless, it should be emphasised that our study was conducted based on wholesale data and our findings must be interpreted according to data limitations, for example, expired medicines in pharmacies or uncertainty about drug taking behaviours of patients. In a recent review, we reported that 62–87% of Iranian patients with diabetes were adherent to their diabetes medicines.40 Thus, the real A10 consumption might be lower than the findings based on wholesale data; however, insufficient adherence to diabetes medication is reported to be a global problem41 and may not introduce a major bias in benchmarking studies.
In conclusion, use of diabetes medicines has increased during a 13-year period in Iran as a middle-income country; nevertheless, the utilisation does not seem to be adequate due to the high rate of undiagnosed patients and inappropriate management of diagnosed cases. Although the affordability of essential diabetes medicines has been achieved, optimising the pattern of medicines use, for example, underutilisation of insulin and overutilisation of glibenclamide, should be on the agenda for health policymakers. Improving better access to effective novel products (such as gliclazide and pen insulin) should be a major consideration for decision makers.
References
Footnotes
-
Contributors AS developed the research proposal, extracted and analysed the data. He contributed to interpretation of findings and drafted the manuscript. AR conceptualised the study, contributed to proposal development, data analysis, results interpretation and major revision of the draft. KG contributed to proposal development, data acquisition, results interpretation and minor revision of the manuscript.
-
Funding This study was supported by a research grant from the Deputy of Research, Tehran University of Medical Sciences and the Research Center for Rational Use of Drugs. (Grant number: 92-01-156-22298).
-
Competing interests None.
-
Provenance and peer review Not commissioned; externally peer reviewed.
-
Data sharing statement Data set might be available to the interested researchers on request from the authors.