Article Text

Abstract
Objective To correlate motor deficit with involvement of corticofugal fibres in patients with subcortical stroke. The descending motor corticofugal fibres originate from the primary motor cortex (M1), dorsal and ventral premotor area (PMdv) and supplementary motor area (SMA).
Design Retrospective study.
Setting Single tertiary teaching hospital.
Participants 57 patients (57% men) with subcortical infarcts on MRI (2009–2011) were included. The mean age was 64.3±14.4 years.
Interventions None.
Primary and secondary outcome measures National Institute of Health Stroke Scale subscores for arm and leg motor deficit at 90 days.
Results An area under the receiver operating characteristics curve (AUC) for the volume of overlap with infarct (and M1/PMdv/SMA fibres) and motor outcome was calculated. The AUC for the association with arm motor deficit from M1 fibres involvement was 0.80 (95% CI 0.66 to 0.94), PMdv was 0.76 (95% CI 0.61 to 0.91) and SMA was 0.73 (95% CI 0.58 to 0.88). The AUC for leg motor deficit from M1 fibres involvement was 0.69 (95% CI 0.52 to 0.85), PMdv was 0.67 (95% CI 0.50 to 0.85), SMA was 0.66 (95% CI 0.48 to 0.84).
Conclusions Following subcortical stroke, the correlations between involvement of the corticofugal fibres for upper and lower limbs motor deficit were variable. A poor motor outcome was not universal following subcortical stroke.
- Rehabilitation Medicine
- Stroke Medicine
This is an Open Access article distributed in accordance with the Creative Commons Attribution Non Commercial (CC BY-NC 3.0) license, which permits others to distribute, remix, adapt, build upon this work non-commercially, and license their derivative works on different terms, provided the original work is properly cited and the use is non-commercial. See: http://creativecommons.org/licenses/by-nc/3.0/
Statistics from Altmetric.com
Article summary
Strengths and limitations of this study
-
Previous studies have included both cortical and subcortical strokes. As such they introduced the additional complexity of cortical infarcts impacting on stroke outcome. The strength of the study was the use of subcortical strokes to explore the direct impact of such lesions on the motor pathway.
-
Limitations of study include retrospective nature and the use of NIHSS to assess arm and leg motor deficit. Finally, the effect of corticofugal fibre involvement on clinical outcome are inferred from the likely overlap between the sites of the fibres and the patients' infarcts.
Introduction
Motor deficit has been found to be the most common impairment in stroke patients.1 Inpatient hospitalisation, rehabilitation and nursing home care contribute significantly to the economic burden of stroke care.2 Stroke clinicians and rehabilitation specialists are often faced with making difficult decisions regarding long-term prognosis and potential rate of motor recovery for patients. It has been suggested that the volume of infarct is an important factor influencing clinical outcome, but, infarct volume appears to be moderately correlated with clinical outcome measurements. This correlation exists for anterior but not for posterior circulation stroke.3 ,4 This effect may be related to the motor structures located in the territory of the internal carotid artery.
Damage to the primary motor cortex (M1) or its descending corticospinal fibre has previously been considered to result in persistent hemiparesis.5–9 Investigators have related loss of integrity of fibre tracks from M1 to poor motor outcome in more than 100 patients with cortical and/or subcortical stroke.5–7 ,10 This idea has been reinforced by suggestion of poor motor outcome in patients with early Wallerian degeneration of the corticospinal fibres following stroke.11 Investigators have described other descending corticofugal fibres which may modify the impact of lesions interrupting the descending pathway (n=49 cortical and/or subcortical stroke patients).9 ,12–14 These corticofugal fibres come from premotor or non-primary motor cortices such as the supplementary motor area (SMA), cingulate motor areas and dorsal and ventral premotor cortices (PMdv). The corticofugal fibres descend in the subcortical white matter. Hence, patients with subcortical strokes were chosen in this study to explore the direct impact of such lesions on the motor pathway. Some of the studies described above included cortical as well as subcortical studies. As such, they introduced the additional complexity of cortical infarcts impacting on stroke outcome.10 ,12 To resolve this issue we plan to study the contribution of involvement of the corticofugal fibres by subcortical stroke to motor outcome. The aim of this study was to correlate motor deficit with the involvement of corticofugal fibres in patients with subcortical stroke.
Methods
Subjects
We examined the data of all patients who had been admitted to the stroke unit between August 2009 and October 2011. Patients were included into this project if they had suffered a subcortical ischaemic infarct and have had MRI. Subcortical infarct is defined in this study as infarct which involves either the white matter or the deep grey matter but does not extend to involve the surface grey matter. Patients who have had a symptomatic previous infarct, and patients with a history of neurodegenerative disease, were excluded to prevent misattribution of symptoms. In this study different investigators were involved in segmenting infarct, performing tractography and extracting clinical outcome data at 3 months. This study was approved by the Research Directorate of Southern Health.
Clinical outcome
Neurological deficits from stroke on admission and at 90 days were determined retrospectively from the medical records using the National Institute of Health Stroke Scale (NIHSS).15 Similar to previous studies,16 we used the NIHSS subscores to summarise deficits in individual domains and the Rankin score to measure disability outcome. For motor deficits, we used the NIHSS subscores for left arm motor deficit (items 5a), left leg motor deficit (items 6a), right arm motor deficit (items 5b), right leg motor deficit (items 6b). Modified Rankin Score (mRS) is an ordinal scale with 0–2 corresponding to no or mild disability, three and four to moderate disability, five to vegetative state and six to death. Clinical outcomes were dichotomised as good as (mRS≤2) or poor as (mRS>2).
MRI processing
MRI scans were performed on a 1.5 T superconducting imaging system (General Electric Medical Systems, Milwaukee, WI and Siemens Medical Solutions, Malvern, Pennsylvania, USA) with echo-planar imaging capabilities. Fluid attenuated inversion recovery T2 images (FLAIR) were acquired using thickness 5 mm, matrix 256×220 and TR/TE/TI 8802/130/2200. All images were manually aligned to a standard stereotaxic co-ordinate space. The manual registration step was performed by choosing individual landmarks for each patient using an interactive display package (Register, available at http://www.bic.mni.mcgill.ca/software/) that allowed the user to ensure that landmark selection progressively improved image registration as evidenced by visual inspection of the alignment of corresponding anatomical structures. These steps led to the creation of a 12-parameter linear transformation matrix which allowed for rotation, translation and independent scaling of the patient image along each of the three principal axes.17 Infarcts were manually segmented on inversion recovery T2-weighted images using interactive mouse driven software at standardised intensity windows to optimise infarct visualisation (display, available at http://www.bic.mni.mcgill.ca/software/).
Rating of white matter hyperintensity
Rating of white matter hyperintensity (WMH) was performed using the Fazekas scale on the FLAIR images. The rating for the periventricular hyperintensity (scale 0–3) and deep WMH (scale 0–3) was combined to give a total score of 0–6.18 A score of 0 indicates no WMH and a score of 6 indicates confluent areas of WMH in the periventricular and deep white matter. This summed score was used for regression analysis.
MRI processing of normal participants
Non-stroke participants who had MRI for another research study (3 T MR scanner, Siemens Medical System) were used to define the corticofugal fibres. These diffusion tensor images (DTI) were acquired with the following parameters: TE/TR 87/8000 ms, 60 diffusion-weighted directions, two diffusion weighting values 0 and 2000 s/mm2. MRTrix software was used for preprocessing the DTI image and performing the streamline tracks (http://www.brain.org.au/software). This software was used to generate diffusion tensor map, Fraction Anisotropic map and Eigenvector map. Streamline tractography was then used to delineate fibre tract according to the principal long axis to preserve voxel–voxel directional information.
Definition of corticospinal tracts
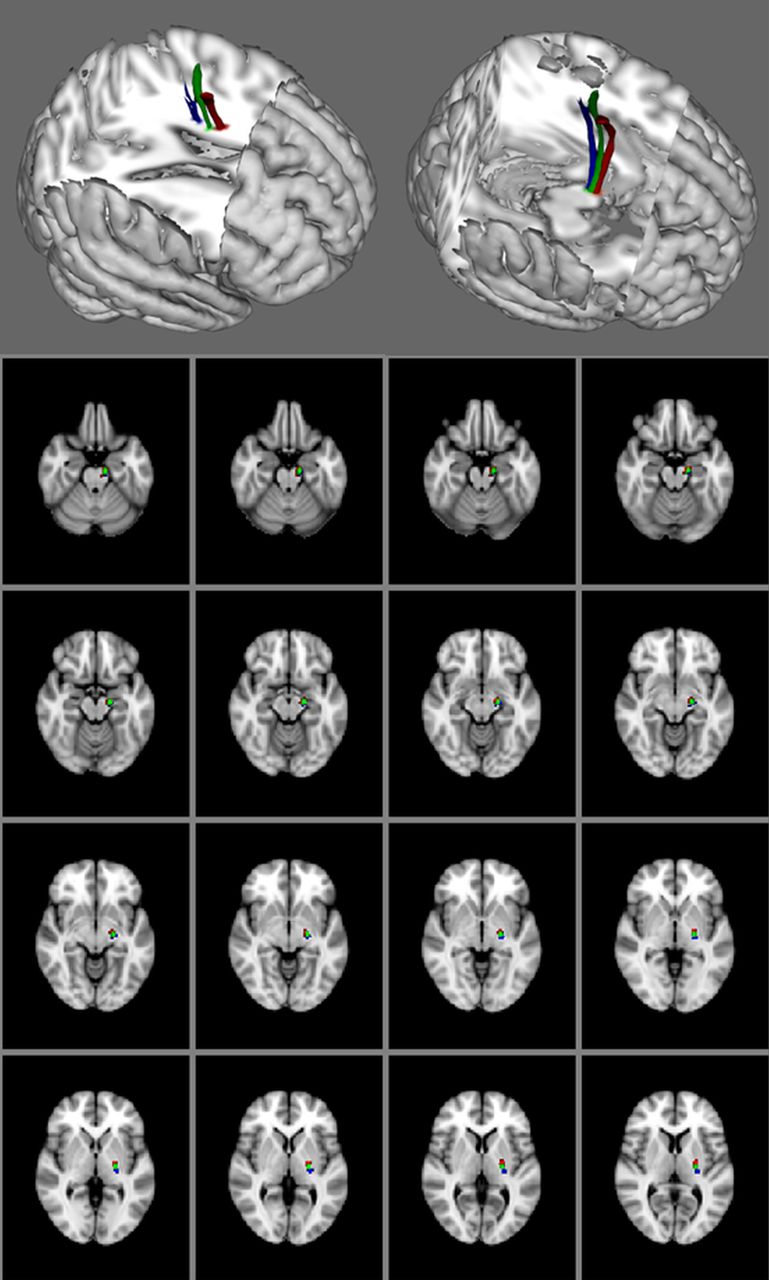
The major cortical areas (M1, SMA and PMdv) known to contribute to the descending motor tracks were defined using 16 healthy participants. The volunteers’ T1-weighted image were co-registered into standard space as defined by the Montreal Neurological Institute (MNI) template. The co-registration process was carried out using FSL linear registration tool (http://www.fmrib.ox.ac.uk/fsl). The M1 and SMA for both left and right side were defined using the BrainMap database in MNI space. We used Freesurfer 5.1 (http://surfer.nmr.mgh.harvard.edu/fswiki) to perform parcellation to determine the location of the premotor areas and the M1. Dorsal promotor area (PMd) was identified as superior part of precentral sulcus and ventral premotor area (PMv) was identified as inferior part of precentral sulcus. In this study, PMd and PMv were combined together as premotor area (PMdv). Streamline track algorithm was used to trace the connection from these motor areas to pontine nuclei. The probabilistic maps of descending motor corticofugal tracks from these participants were transformed to standard space (figure 1). Masks of the corticofugal fibres were created from these maps. Involvement of the corticofugal fibres by stroke was determined by multiplying the corticofugal fibre masks and the infarct. The volumes of overlap between the infarct and the fibre masks were determined by voxel counting method.

The corticofugal fibres from motor cortex (blue), dorsal and ventral premotor area (green) and supplementary motor area (red).
Statistical analysis
To provide comparison data with published studies, we provided several metrics of the associations between the volume of infarct overlapping with corticofugal fibres and clinical outcome. Clinical outcome was measured by NIHSS subscore for arm/leg motor (dichotomised at 0) and mRS (dichotomised at 2 or less to signify mild disability).
The receiver operating characteristics (ROC) curve method measures the trade-off between sensitivity and false-positive rate and may provide a metric that can be understood clinically. The ROC curve was used to determine the accuracy of infarct overlap with corticofugal fibres and clinical outcome (dichotomised NIHSS subscores and mRS). We followed the suggestion by Hosmer and Lemeshow19 in the interpretation of the area under ROC curve (AUC). An AUC of 0.5 is classified as no better than by chance; 0.6–0.69 provides poor discrimination; 0.7–0.79 provides acceptable (fair) discrimination; 0.8–0.89 provides good (excellent) discrimination and 0.9–1.0 provides outstanding discrimination. Using data from the ROC curve analysis, we calculated the Youden index to determine the optimal threshold of volume of overlap between infarct and corticofugal fibres for discrimination of neurological deficit.20
Logistic regression was used to analyse the relationships between the motor outcome (NIHSS motor subitems or mRS) against infarct volume overlapped with individual fibre tracts (M1 or PMdv or SMA). We investigated the following covariates in the regression model: age, gender, smoking status, hypertension, diabetes status, treatment with recombinant tissue plasminogen activator (rt-PA), time to MRI scan. Only variables with p<0.20 on univariable analysis were entered into multivariable models.
Results
Stroke patient characteristics
There are 57 patients with mean age 64.3±14.4 year. Fifty-seven per cent of the participants were men. The distribution of risk factors was hypertension 71.9%, diabetes 31.6%, hyperlipidaemia 63.2%, smoker 28.1%, atrial fibrillation 15.7% and ischaemic heart disease 19.3%. The stroke mechanisms were: cardioembolic 11 (19.3%), undetermined 29 (50.9%), large artery 17 (29.8%). The frequency of patients receiving rt-PA was 29.8%. Patients were scanned 20.8±25.5 days after stroke onset.
Non-stroke participants
There are 16 participants (44.6% men) who volunteered for DTI with mean age 60.1±5.6 year. The distribution of risk factors was hypertension 50.9%, diabetes 50%, hyperlipidaemia 51.8%, smoker 44.4%, ischaemic heart disease 35.7%. None of the participants had a clinical history of stroke nor MRI evidence of stroke.
Motor deficit
The mean and SD for the NIHSS on admission was 5.7±4.1. Motor deficits were initially present in 45 (78.9%) patients. The frequency of motor arm deficits was 26 (45.6%) and motor leg deficits was 20 (35.1%). The NIHSS at 3 months was 2.5±4.7. At this stage, the frequency of motor deficits had decreased to 42.1%; the frequency of motor arm deficit was 32.7%, motor leg deficit was 27.3% and moderate-to-severe disability 17.6%.
Infarct volume
The mean infarct volume was 3.8±8.9 mL. The mean involvement of the M1 fibre tract by infarct was 1.17±1.40 mL; PMdv fibre was 0.86±1.09 mL and SMA was 1.11±1.44 mL. There was no single infarct which involved only the M1 fibre, or only the PMdv fibre or only the SMA fibre. Isolated involvement at the level of the posterior limb of the internal capsule occurred in 27 (47.4%) and corona radiata in 24 (42.1%).
Involvement of corticofugal fibres and outcome
The AUC for arm motor deficit from M1 fibres involvement was 0.80 (95% CI 0.66 to 0.94), PMdv was 0.76 (95% CI 0.61 to 0.91) and SMA was 0.73 (95% CI 0.58 to 0.88). The AUC for leg motor deficit from M1 fibres involvement was 0.69 (95% CI 0.52 to 0.85), PMdv was 0.67 (95% CI 0.50 to 0.85), SMA was 0.66 (95% CI 0.48 to 0.84). The AUC for disability from M1 fibres involvement was 0.88 (95% CI 0.79 to 0.97), PMdv was 0.83 (95% CI 0.70 to 0.97), SMA was 0.82 (95% CI 0.67 to 0.97). The threshold infarct and their associated sensitivity and specificity are displayed in table 1 and figure 2.
Association between corticofugal fibres and clinical outcome

Examples of patients with infarct involving the posterior limb of the internal capsule but no motor deficit at 90 days. (A) 67-year-old male. Dysarthria on admission. (B) 75-year-old male. Motor deficit and aphasia on admission. No motor deficit at 90 days.
Univariable analyses
The univariable analyses for motor deficit and disability are displayed in table 1. In this study, the following variables were not significant at p=0.2 level: gender, hypertension, diabetes, smoking status, treatment with rt-PA, Fazekas score for WMH and time to MRI for arm motor deficit and disability. The variable time to MRI was significant for leg motor deficit and was entered into the multivariable model.
Multivariable analyses for leg motor deficit and disability
Leg motor deficit was associated with M1 fibres (OR 1.99/mL, 95% CI 1.15 to 3.46) and age (OR 1.06/year increase, 95% CI 1.01 to 1.12); PMdv fibres (OR 2.98/mL, 95% CI 1.32 to 6.73) and age (OR 1.07/year increase, 95% CI 1.01 to 1.14) and SMA fibres (OR 2.05/year increase, 95% CI 1.17 to 3.60) and age (OR per 1.06/year increase, 95% CI 1.01 to 1.12). The R2 for these regression anlayses are displayed in table 1 and range from 0.18–0.31.
Discussion
We had expected to find that involvement of the descending motor corticofugal fibres, in particular the M1 fibres, would always be associated with severe motor deficit. However, the associations between involvement of corticofugal motor fibres and motor deficit or disability were variable. Importantly, prognosis for motor recovery (particularly leg motor deficit) after subcortical infarction was not easily predicted from infarct location. In our small series, the finding does not support the use of subcortical infarct location for prognostication on stroke recovery.
Corticofugal fibres
We observed an association between involvement of descending motor corticofugal fibres and motor deficit in stroke patients but cautiously did not draw conclusion regarding the importance of one fibre tract over another. Using logistic regression methods, we were not able to assess the independent contribution of each fibre tract to motor outcome due to the presence of collinearity (correlated data). This occurred because of overlap between these fibres, making it a rare occurrence to have infarct affecting only one fibre tract.12
In this study, we used the AUC and logistic regression to illustrate the effect of involvement of corticofugal fibres on motor outcome. The expression of OR is familiar to readers of this journal but this metric is not easily understood clinically. By contrast, the use of the AUC may permit a clinical interpretation. In this study, the AUC results in M1 ranged from 0.69 (poor discrimination for motor leg deficit), 0.80 (good discrimination for motor arm deficit) to 0.88 (good discrimination for disability) suggesting that when randomly choosing from a group, the clinician may be incorrect 31% (for motor leg deficit), 20% (for motor arm deficit) and 12% (for disability) of the cases.21
With regard to M1 fibre involvement, our findings initially appeared at odds with other studies. With a partial R2 of 0.22 for arm motor deficit in our study (table 1) the strength of this association was not very strong. This discrepancy might be resolved when the results of those studies are examined in details. Investigators reported that involvement of the corticospinal tract led to arm motor deficit in 19 of 23 patients. However, 16 of those 19 patients had very mild arm motor deficit.6 Similarly leg motor deficit was present in 17 of 23 patients in this study with 13 of these 17 patients having mild leg motor deficit.6 There are exceptions with some studies reporting a stronger association between M1 and FM score/grip strength obtaining R2 of 0.67 (n=21),10 0.73 (n=50)5 and 0.74 (n=13).9
The importance of the M1 fibre to motor deficit is also argued from the point of early Wallerian degeneration of this fibre (n=18).11 However, the relationship between Wallerian degeneration of the corticospinal tract and motor outcome is inconclusive.22 Investigators showed that in the setting of subcortical stroke, this MR finding may slow functional recovery but not the final rehabilitation outcome (n=77).22 From a practical point, these findings imply that the involvement of corticofugal fibres by stroke increased the odds of motor deficit but it does not mean that permanent motor deficit will always occur. Based on this data, one cannot use this knowledge of subcortical infarct location to prognosticate on stroke recovery or to determine eligibility for rehabilitation.
The findings of this study generate the hypothesis that the corticofugal fibres may have large residual capacity. Poor motor outcome may not occur unless all of the fibres are disrupted. Even though the MR scans were performed approximately 3 weeks after onset, another possibility is that the T2 signal abnormality might have included oedema rather than just necrotic and gliotic tissue. As such the ‘infarct lesion’ might not have resulted in significant disruption of the corticofugal fibres and hence our findings of imperfect correlation.
Study limitations
The limitations of this study include the retrospective nature. Although the sample size in this study is larger than some of the other studies on this subject, the sample size remains relatively small.12 ,13 The severity of stroke deficit can be described as mild-to-moderate; this is not unexpected since we had chosen to evaluate subcortical stroke. In this study, the NIHSS was used to measure motor deficit as this tool had been deemed to be sensitive to aprediction of 3 months outcome.23 The NIHSS subitem for arm motor deficit measures arm drift and hence it provides a measure of proximal arm strength. This tool does not explicitly measure hand motor deficit (item 12 on original NIHSS).24 However, the assessment of this scale by factor analysis showed that the hand motor item did not make any contribution towards the underlying nature of NIHSS.25 The hand motor item (item 12) is no longer part of the NIHSS. Nevertheless, we urge caution with our findings with regard to the less than perfect correlation between arm motor deficit and corticofugal fibres. Finally, the effect of corticofugal fibre involvement on clinical outcome is inferred from the likely overlap between the sites of the fibres and the patients’ infarcts. We had not directly assessed for disruption of the corticofugal fibres in these patients. The reason was that the MR studies were performed as clinical scans and did not incorporate a dedicated diffusion tensor sequence. Further, there are technical issues associated with performing tractography in stroke patients.6 ,12 ,13
Conclusion
The motor outcome at 3 months following subcortical infarct was not universal and varied between upper and lower limbs. The descending motor corticofugal fibres may have different effect on motor outcome between the upper and lower limbs. Further research in this important area is needed to help with determining stroke outcome and understanding of the neural substrate of motor deficit.
Acknowledgments
The authors would like to thank Ms Kitty Wong for her help with data collection.
References
Footnotes
-
Contributors TGP, SVDV and VS conceptualised the study and formed the writing committee. TGP and SVDV performed the infarct segmentation; JC and RB performed the corticofugal tract segmentation; BC, JL, HM, EM and ET performed clinical characterisation. All authors reviewed and approved the final version of the manuscript.
-
Funding This research received no specific grant from any funding agency in the public, commercial or not-for-profit sectors.
-
Competing interests VS reported receiving an NHMRC/Heart Foundation Career Development Fellowship (ID:606544).
-
Ethics approval Research Directorate of Southern Health.
-
Provenance and peer review Not commissioned; externally peer reviewed.
-
Data sharing statement No additional data are available.