Article Text

Abstract
Objectives To summarise the methods of the European Prospective Investigation of Cancer (EPIC)-Norfolk Eye Study, and to present data on the prevalence of visual impairment and associations with visual impairment in the participants.
Design A population-based cross-sectional study nested within an on-going prospective cohort study (EPIC).
Setting East England population (the city of Norwich and its surrounding small towns and rural areas).
Participants A total of 8623 participants aged 48–92 years attended the Eye Study and underwent assessment of visual acuity, autorefraction, biometry, tonometry, corneal biomechanical measures, scanning laser polarimetry, confocal scanning laser ophthalmoscopy, fundal photography and automated perimetry.
Outcome measures Visual impairment was defined according to the WHO classification and the UK driving standard, and was based on presenting visual acuity. Summary measures of other ophthalmic measurements are also presented.
Results The prevalence (95% CI) of WHO-defined moderate-to-severe visual impairment and blindness was 0.74% (0.55% to 0.92%). The prevalence (95% CI) of presenting visual acuity worse than the UK driving standard was 5.87% (5.38% to 6.37%). Older age was significantly associated with visual impairment or blindness (p<0.001). Presenting visual acuity worse than UK driving standard was associated with older age (p<0.001), female sex (p=0.005) and lower educational level (p=0.022).
Conclusions The prevalence of blindness and visual impairment in this selected population was low. Visual impairment was more likely in older participants, women and those with a lower educational level.
- EPIDEMIOLOGY
- OPHTHALMOLOGY
This is an open-access article distributed under the terms of the Creative Commons Attribution Non-commercial License, which permits use, distribution, and reproduction in any medium, provided the original work is properly cited, the use is non commercial and is otherwise in compliance with the license. See: http://creativecommons.org/licenses/by-nc/2.0/ and http://creativecommons.org/licenses/by-nc/2.0/legalcode.
Statistics from Altmetric.com
Article summary
Article focus
-
▪ The European Prospective Investigation of Cancer-Norfolk Eye Study is part of an on-going UK population-based cohort study.
-
▪ This article describes the methods of the Eye Study component and the characteristics of the participants.
-
▪ In particular, the article presents the prevalence of visual impairment in the cohort, and sociodemographic associations with visual impairment.
Key messages
-
In total, 8623 participants aged 48–92 years attended the Eye Study.
-
While the prevalence of visual impairment or blindness was low due to the selected nature of the population, more than 5% of participants did not reach UK driving standard equivalent acuity.
-
Visual impairment was more likely in participants who were older, women and with lower educational achievement.
Strengths and limitations of this study
-
Large study sample.
-
Selected population susceptible to significant healthy volunteer bias.
-
Associations examined are cross-sectional and therefore limit causal inference.
Introduction
The European Prospective Investigation of Cancer (EPIC) is a 10-country collaborative study which started in 1989.1 ,2 EPIC-Norfolk, one of the UK centres, recruited 30 445 men and women resident in East Anglia, aged 40–79 years, between 1993 and 1997.3 The initial aim of EPIC was to examine the dietary determinants of cancer. However, the aims of EPIC-Norfolk were broadened to identify other determinants of chronic disease. Visual health assessment was included in the latest health examination (HE), and this is referred to as the EPIC-Norfolk Eye Study.
According to Sight Loss UK, in 2010 there were 1.86 million people in the UK with sight loss sufficient to have a significant impact on their daily lives; an increase from 1.8 million in 2008.4 ,5 Age-related macular degeneration (AMD) was the leading cause of certified visual loss, followed by glaucoma.6 Glaucoma remains the leading cause of irreversible blindness globally.7 The overall aim of the EPIC-Norfolk Eye Study is to further understand, in a selected, predominantly White British population, of the determinants of visual health, with an emphasis on glaucoma. The specific objectives of the EPIC-Norfolk Eye Study are to:
-
Describe the distribution of structural aspects of the eye within the cohort, including axial length, anterior chamber depth, corneal curvature, refractive error, optic nerve tomography and retinal nerve fibre layer (RNFL) tomography.
-
Describe the distribution of functional measures within the cohort, including visual acuity (VA) and visual field parameters.
-
Describe the frequency of ocular disease within the cohort, including uncorrected refractive error, glaucoma, AMD, diabetic retinopathy and other retinal diseases.
-
Determine associations of the above parameters and diseases with demographic factors and exposure measures available for the EPIC-Norfolk cohort, including nutritional and lifestyle measures, biological markers and genetic risk factors.
-
Assess the diagnostic performance of different measures using new ophthalmic assessment tools for glaucoma.
The objectives of this article were to (1) describe the methods for the EPIC-Norfolk Eye Study and the baseline characteristics of participants in the Eye Study, (2) describe the frequency and causes of visual impairment in the cohort and (3) describe the sociodemographic associations with visual impairment in the cohort.
Methods/design
Ethics
The EPIC-Norfolk Eye Study was carried out following the principles of the Declaration of Helsinki and the Research Governance Framework for Health and Social Care. The study was approved by the Norwich Local Research Ethics Committee (05/Q0101/191) and East Norfolk & Waveney National Health Service (NHS) Research Governance Committee (2005EC07L). All participants gave written, informed consent.
Study location
The study location is in the East of England and comprises the city of Norwich and its surrounding small towns and rural areas (figure 1). This region has the advantage of being served by one major university teaching hospital and by having little outward migration for the study age group.3 Study population stability facilitates outcome ascertainment through linkage to hospital-based disease records, and helps to limit loss to follow-up in the long term. The cohort is 99.7% White and has fewer smokers than the general UK population.3 Otherwise, the cohort is comparable with the UK general population in terms of anthropometric variables, blood pressure and serum lipids.3
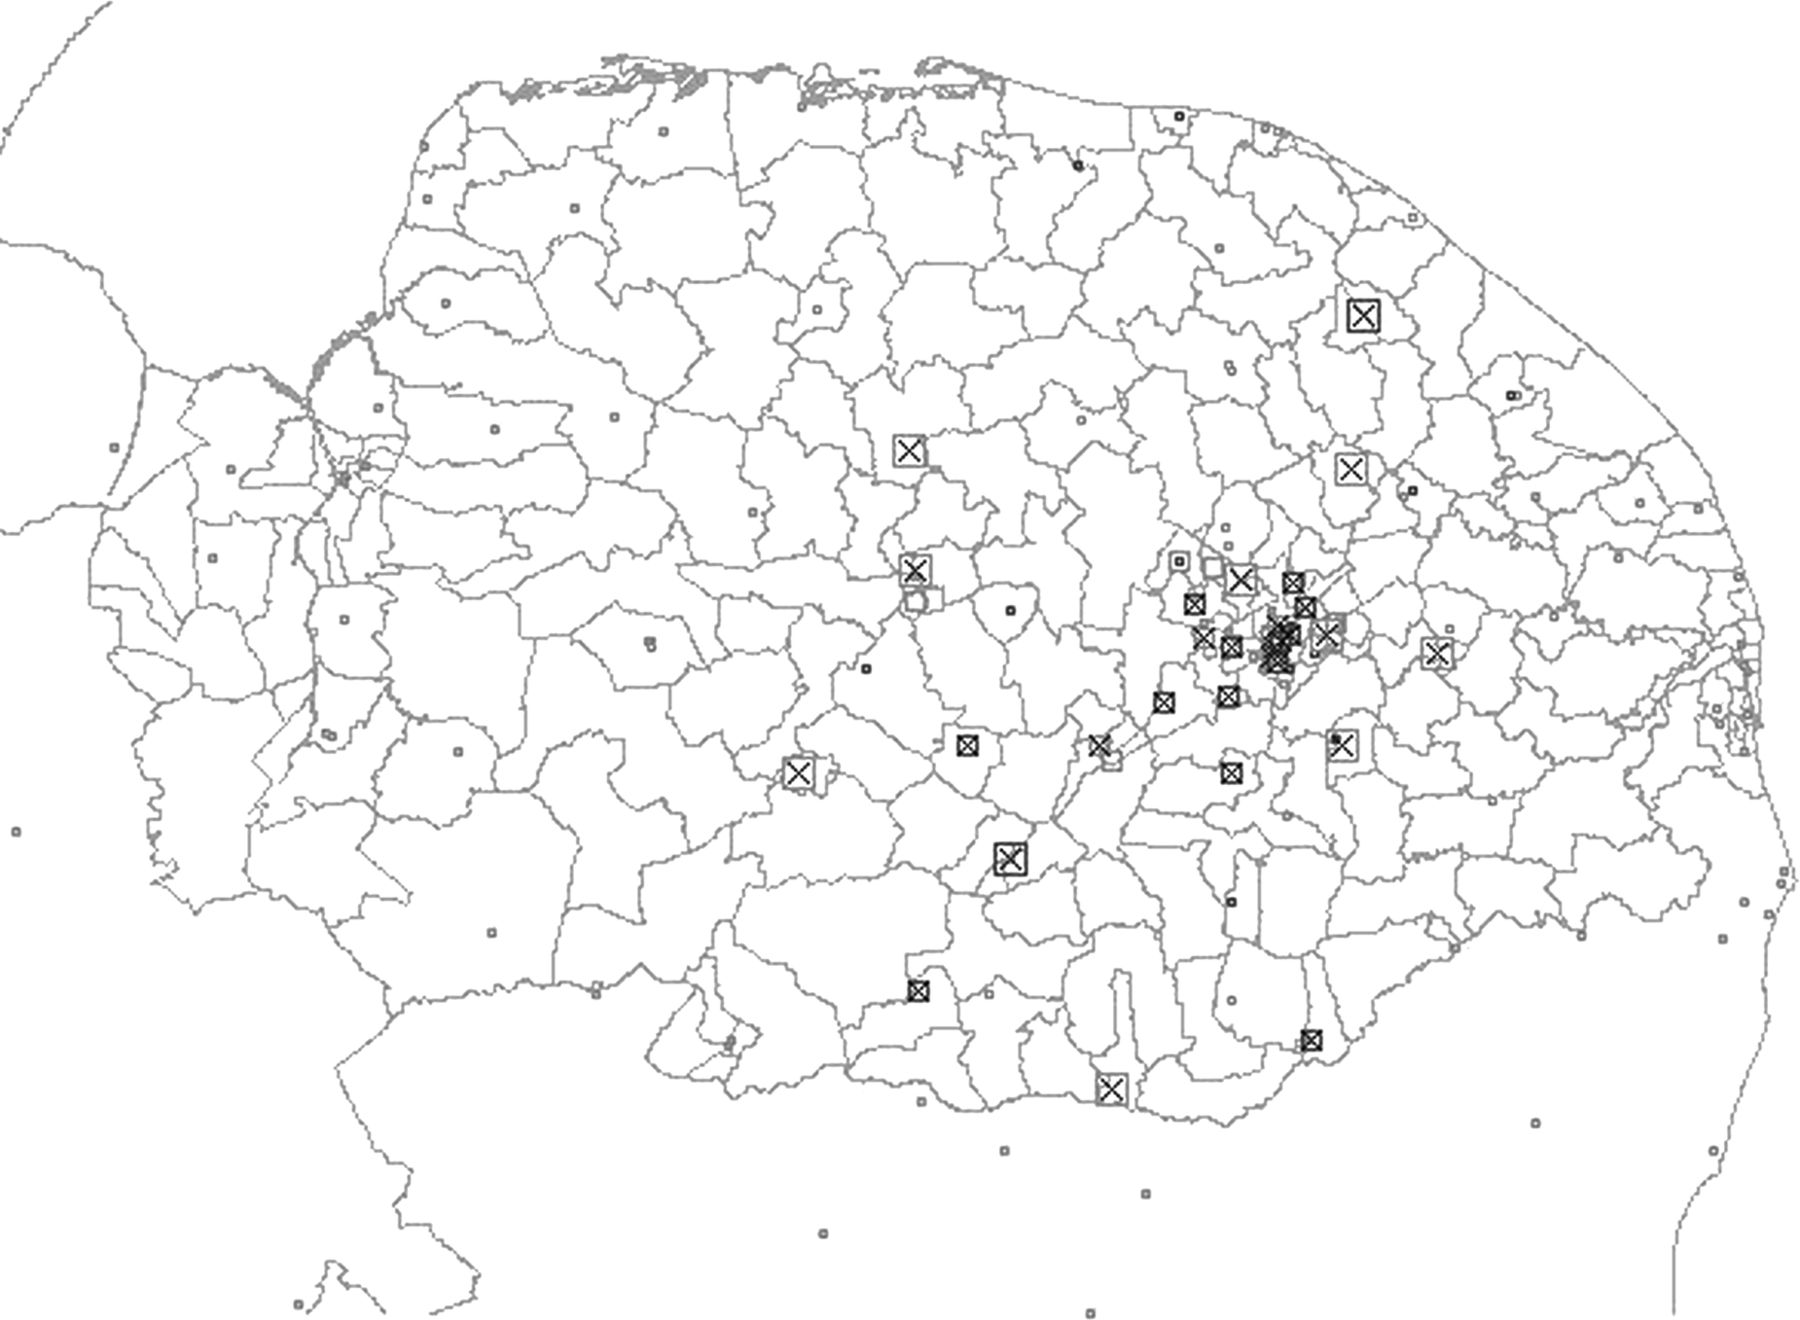
A map of Norfolk. Boxes with crosses in represent general practices that European Prospective Investigation of Cancer -Norfolk Eye Study participants attend; the larger the box, the larger the number of participants. Boxes without a cross represent general practices which no participants currently attend.
Recruitment
Participant recruitment to EPIC-Norfolk is summarised in figure 2. Baseline recruitment was by invitation of residents aged 40–79, via 35 participating general practices, between 1993 and 1997. Since virtually all residents in the UK are registered with a general practitioner through the NHS, general practice lists serve as population registers. Detailed EPIC methods have been published elsewhere.3 All living participants who had not opted out of the study were invited to take part in the third HE (n=18 380), of which 11 110 (60%) agreed to take part. Of these, 8623 (47%) completed the examination prior to closure of the study at the end of the grant funding.

A flow chart detailing participant recruitment for the European Prospective Investigation of Cancer -Norfolk Eye Study.
Examination procedures
There are extensive data available from the examinations undertaken at two previous rounds, and intervening postal questionnaires; these have included questionnaires regarding lifestyle (5 timepoints), physical activity (2 timepoints) and psychosocial domains (2 timepoints). Nutritional assessment comprised food frequency questionnaires (3 timepoints), 7-day food diaries (4 timepoints) and blood and urine biomarkers (3 timepoints). DNA is available for the whole EPIC-Norfolk cohort with varying degrees of genotyping having been conducted to date.
The focuses for data collection in the 3HE were visual health (EPIC-Norfolk Eye Study), cognition (8 validated tests assessing different domains of cognitive function), skin ageing (digital photographs under standardised conditions), physical activity (accelerometer and questionnaire), physical performance and muscle strength (modified version of the Established Populations for the Epidemiologic Studies of the Elderly battery).8 Furthermore, anthropometry (height, weight, waist circumference, hip circumference), blood pressure, heelbone ultrasound, impedance/body fat percentage, ankle brachial pressure, lung function and blood sampling were performed. The 3HE lasted between 150 and 180 min, with the Eye Study component lasting approximately 40 min.
All ocular measurements were undertaken by trained nurses following Moorfields Eye Hospital standard operating procedures adapted for the EPIC-Norfolk Eye Study. Intensive periods of staff training and validation were undertaken before the project started. Refresher training was provided at least annually and data were reviewed weekly by an ophthalmologist. All Eye Study examinations were undertaken without pupil dilation, and were as follows:
-
Ophthalmic history: A detailed ophthalmic history was elicited from participants, including details of previous ocular diagnoses and management, subjective VA, and family history of eye disease.
-
VA: Monocular VA was measured using a LogMAR (Logarithm of the Minimum Angle of Resolution) chart (Precision Vision, LaSalle, Illinois, USA) on a light box under standard illumination. Chart ‘1’ was used for all measurements. The test was carried out with the aid of the participant's usual distance correction at 4 m (or 2 m then 1 m if unable to read any letters). The test was terminated when the participant was able to read ≤3 letters on a line and testing repeated using pinhole-correction if participants were unable to read 3 letters on the 0.3 line. Standard letter-by-letter scoring was used to derive LogMAR VA. If a participant failed to read any letters at 1 m, further testing comprised counting fingers at 30 cm, followed by hand movements at 30 cm, followed by perception of light using a handheld torch.
-
Refractive error: Refractive error was measured using a Humphrey Auto-Refractor 500 (Humphrey Instruments, San Leandro, California, USA).
-
Ocular dimensions: Biometry was conducted using non-contact partial coherence interferometry (IOLMaster V.4, Carl Zeiss Meditech Ltd, Welwyn Garden City, UK). For each eye, five measurements of axial length, three measurements of corneal curvature and one measurement of anterior chamber depth were taken. Axial length measurements were repeated if flagged as more than 0.1 mm different to the others.
-
Tonometry and corneal biomechanical measures: Intraocular pressure (IOP) was measured on the first 443 participants using an AT555 Non-Contact Tonometer (Reichert, New York, USA). Three readings were taken for each eye, and measures were repeated if flagged as suspect (more than 5 mm Hg different to the other two). For all subsequent participants, IOP was measured using the Ocular Response Analyzer (ORA, Reichert, New York, USA; software V.3.01) which also measures corneal biomechanical attributes.9 Three readings were taken per eye following a demo puff. ORA measurements with a poor quality pressure waveform were repeated.
-
RNFL imaging: Scanning laser polarimetry (GDx VCC, Zeiss, Dublin, California, USA) was used to assess the peripapillary RNFL. Spherical equivalent values derived from the autorefractor were inputted. Initially a corneal scan was taken, followed by the RNFL scan. If the macular ellipse for corneal compensation was not well centred, it was modified accordingly. If an RNFL scan was not of sufficient quality (less than 7 quality score), it was repeated once.
-
Optic nerve head topography: Scanning laser ophthalmoscopy (Heidelberg Retinal Tomograph (HRT) II, Heidelberg Engineering, Heidelberg, Germany) was used to assess optic nerve head anatomy. The participant's keratometry was entered prior to scanning. If the image quality was poor (topography SD >40 μm) a repeat scan was undertaken. Contours around the disc margins were manually drawn and subsequently checked by an ophthalmologist (and redrawn if necessary). The HRT software was subsequently updated to Glaucoma Module Premium Edition (software V.3.1) and data exported following this. These data are equivalent to HRT3-derived parameters.
-
Fundus photography: Digital photographs of the optic disc and macula were taken using a TRC-NW6S non-mydriatic retinal camera and IMAGEnet Telemedicine System (Topcon Corporation, Tokyo, Japan) with a 10 megapixel Nikon D80 camera (Nikon Corporation, Tokyo, Japan). The photographs are undergoing masked grading for AMD, diabetic retinopathy, other retinopathy and optic disc parameters.
-
Automated perimetry: Visual fields were assessed in all participants meeting predetermined criteria and 1 in 10 participants not meeting the criteria, if time permitted (box 1). A Central 24–2 threshold algorithm on a Humphrey 750i Visual Field Analyzer (Carl Zeiss Meditech Ltd, Welwyn Garden City, UK) was used. Autorefractor results were inputted, and the trial lens calculated.
Criteria applied to determine whether a participant should undergo automated perimetry, or be referred for hospital examination
-
Criteria for automated perimetry
-
Any one of:
-
▪ IOP >24 mm Hg
-
▪ Any HRT II Moorfields Regression Analysis sector outside normal limits.
-
▪ Abnormal GDx RNFL average thickness/ standard deviation/superior thickness/inferior thickness measures (1 reading at p<0.5% or 2 readings p<1% or 3 readings p<2%).
-
▪ IOP >21 mm Hg AND either an abnormal HRT II Moorfields Regression Analysis (at least two sectors borderline) or abnormal GDx RNFL average thickness/standard deviation/superior thickness/inferior thickness measures (any two readings p<5%).
-
▪ In addition to this, perimetry was conducted in 1 in 10 participants not meeting the criteria, if time permitted.
-
Criteria for referral to hospital clinic
-
Any one of:
-
▪ Best-corrected VA >0.34 LogMAR in either eye.
-
▪ IOP >24 mm Hg in either of the eyes.
-
▪ IOP >21 mm Hg in either of the eyes with ≥3 borderline HRT II sectors on Moorfields Regression Analysis.
-
▪ GDx RNFL average thickness/standard deviation/superior thickness/inferior thickness measures outside normal limits in either of the eyes (1 reading at p<0.5% or 2 readings p<1% or 3 readings p<5%).
-
▪ Any HRT II sector Moorfields Regression Analysis outside normal limits.
-
▪ Manifest abnormalities on fundus photography in either of the eyes.
-
▪ HRT, Heidelberg retinal tomograph; IOP, intraocular pressure; RNFL, retinal nerve fibre layer; VA, visual acuity.
Referral criteria
All test results were reviewed by an ophthalmologist and participants meeting predefined criteria (box 1) were referred to a glaucoma specialist (DCB) at the major local ophthalmic department (Norfolk & Norwich University Hospitals (NNUH) NHS Foundation Trust). Participants referred underwent a full ophthalmic examination, by a glaucoma fellowship-trained ophthalmologist, including tonometry, pachymetry, gonioscopy, optic disc imaging and automated perimetry if clinically indicated. For participants already known to the NNUH who did not require additional review, a summary of their case notes and any study-related data were sent to the EPIC-Norfolk Eye Study coordinator. In total, 1703 participants were referred.
Power and statistical methods
For continuous outcome measures, the study is powered to detect a difference of 10% of SD, with 90% power at a 5% significance level (eg, 0.36 mm Hg for IOP, or 0.02 for HRT linear cup-to-disc ratio). For case–control analyses of primary open-angle glaucoma, using an estimated projection of 132 ‘definite’ cases, the study provides 90% power at a 5% significance level to detect an OR of 1.83, assuming an exposure prevalence of 25% in the controls.
For the analyses in this manuscript, comparisons of baseline characteristics were carried out using independent sample t tests for continuous variables (age and body mass index (BMI), both normally distributed) and the χ2 test for categorical variables. Presenting VA (PVA) was defined as the VA in the better eye, wearing usual correction if used. Rates of visual impairment were directly standardised to the mid-2010 population of England by age and sex. Causes of visual impairment were ascertained from hospital referral data or from self-report if the participant was not referred (nurse ascertained ophthalmic history at the HE or questionnaire ascertained). To test for associations with visual impairment and blindness, multiple logistic regression models were constructed containing age, sex, BMI, social class, education level and smoking status. Social class was recorded according to the Registrar-General's occupation-based classification system; this was based on the participant's last occupation if they were retired. Educational level was recorded and classified into four groups according to the highest qualification achieved. Smoking status was dichotomised (never/ever) since there were small numbers who were current smokers. For the purposes of the summary data, best-corrected VA was described (defined as the better of PVA or pinhole-corrected VA in the better eye). Stata V.12.1 (StataCorp LP, Texas, USA) was used for all analyses.
Publications to date
Interim data on a proportion of the cohort have been published, prior to the closure of the EPIC-Norfolk Eye Study. Publications include articles related to IOP and corneal biomechanical measures,10 refractive error,11 uncorrected refractive error,12 and an association between physical activity and ocular perfusion pressure.13
Results
In total, 8623 participants aged 48–92 years were seen at the 3HE, representing 28% of the original 30 445 participants who consented for the study at baseline between 1993 and 1997. Of those attending 3HE, 8011 (94%) had also attended the 1HE. The remaining 513 participants consented at baseline, but did not attend the 1HE. Table 1 compares the baseline characteristics of those who attended both 1HE and 3HE with those who attended 1HE only. Participants attending the 3HE were significantly younger, of lower BMI, higher social class, higher educational achievement level and less were smokers than those attending the 1HE only (all p<0.001). Table 2 summarises the numbers of participants completing each test and summary measures for these tests.
Comparison of baseline characteristics between participants attending the first health examination only (1HE) and participants attending both the European Prospective Investigation of Cancer -Norfolk Eye Study (ENES) and 1HE
Summary of numbers of participants completing each test in the European Prospective Investigation of Cancer-Norfolk Eye Study, and summary statistics from these tests
The proportions of participants with different categories of VA impairment according to WHO definitions14 and the driving standard in the UK15, are presented in table 3. The causes of impairment in those classified as blind or visually impaired by WHO criteria are summarised in table 4. Where there was more than one significant contributory cause to the visual impairment, all conditions were specified.
Distribution of presenting visual acuity in the better eye of participants (n=8563), according to different classifications of vision loss
Causes of visual impairment in those classified as blind or visually impaired by WHO criteria (n=63)
Sociodemographic characteristics of the participants stratified by visual impairment categories are presented in table 5. Results from the logistic regression models examining associations with visual impairment are summarised in table 6. These are based on participants with complete data on all covariates (n=8411). An increased odds of visual impairment or blindness was associated with older age (p<0.001) and there was a trend towards increasing odds with lower social class (p=0.09) and lower educational achievement level (p=0.08). An increased odds of PVA worse than UK driving standard was associated with older age (p<0.001), female sex (p=0.005), and there were trends for association with lower social class (p=0.09) and lower educational achievement level (p=0.022).
Sociodemographic characteristics of participants stratified by WHO visual impairment category
Multivariable logistic regression results
Discussion
The EPIC-Norfolk Eye Study is part of a prospective cohort study with a wealth of exposure measures obtained over a period of nearly two decades. The overall aim of the Eye Study was to further understanding of common eye diseases by examination of the epidemiology and associations within the cohort. Strengths of the EPIC-Norfolk Eye Study include the large sample size, the detailed ophthalmic phenotyping (particularly with respect to optic nerve anatomy) and the large number of participants referred for a clinical examination at the local hospital and the detailed data available from these visits. There are several limitations of the design of the study. The eye study population is highly selected and healthier than the baseline cohort (significantly younger, of lower BMI, higher social class, higher educational achievement level and fewer were smokers (all p<0.001)). These differences may limit generalisation and introduce bias if disease associations are different in healthier volunteers. The EPIC-Norfolk Eye Study is cross-sectional at present and while many exposure measures were obtained prior to the ophthalmic measurements, it is not possible to exclude undiagnosed ophthalmic disease being present at earlier HEs. This may limit causal inference for any associations examined. Another limitation is that automated perimetry was not carried out for all participants and slit lamp examination and gonioscopy were only performed in those meeting set referral criteria. Functional loss may sometimes precede measureable structural damage in glaucoma and failure to assess visual field can miss up to a third of primary open-angle glaucoma cases.16 Fundus photography was non-mydriatic, and this may limit the number of images of suitable quality for detailed grading. However, it is anticipated that most images will be of sufficient quality to detect moderate disease, such as significant AMD, and to assess optic disc parameters.
Rates of visual impairment in the EPIC-Norfolk Eye Study cohort were very low. According to WHO criteria,14 0.07% (95% CI 0.01% to 0.13%) of the participants were blind, and 0.74% (0.55% to 0.92%) were blind or had moderate-to-severe visual impairment. The EPIC-Norfolk Eye Study rates are lower than those reported by other UK studies, and this is likely to be due to selection bias causing an underestimate. Given the required self-completion of questionnaires and travelling to the study clinic, it was less likely that individuals with significant visual impairment would take part. Rates of visual impairment in two UK populations aged over 65 years were reported to be 14.3% (criterion <6/18)17 and 30% (criterion <6/12),18 and was reported to be 12.5% (criterion <6/18) in a UK population over 75 years of age.19 Prevalence of visual impairment (<6/18) was reported to be 0.90% in participants of the 1958 British birth cohort study aged 44 or 45 years.20 In addition to WHO criteria for visual impairment, we also presented data on PVA worse than the UK driving standard, as this represents an important sociofunctional threshold and, to the best of our knowledge, has not been reported previously at a population level. We found that over 5% of participants did not meet the equivalent acuity standard for driving in the UK. While this is not a high proportion, it may be significant given the importance of driving for maintaining independence, especially in rural areas. We also presented visual impairment prevalence rates adjusted to the age and sex distribution of the mid-2010 population of England. However, given the healthy nature of the cohort, these should not be interpreted as representative rates for the English population.
Of the 63 participants with visual impairment or blindness, 28% were secondary to uncorrected refractive error. This high rate of potentially reversible visual impairment (with glasses or a new glass prescription) is consistent with the 26% of participants aged 75 years or older reported in the MRC Trial of the Assessment and Management of Older People in the Community.21 The next most common causes of visual impairment were AMD followed by cataract and glaucoma. This is consistent with the other UK population-based studies that have published causes of visual impairment.18 ,21
Despite the limited generalisability of the cohort visual impairment prevalence, the data provides potential to examine associations with visual impairment. Age was an important determinant with a twofold to threefold increase in odds of visual impairment or PVA worse than UK driving standard (<6/10) per decade of increasing age. Women were more likely to have VA worse than 6/10, independently of age, which is in keeping with other UK studies.17 ,19 A previously published meta-analysis has demonstrated an OR of 1.63 (95% CI 1.30 to 2.05) for blindness in women compared with men in industrialised countries, using an age-stratified approach.22 However, due to smaller numbers, all age groups over 70 years were pooled for the meta-analysis. Therefore, this difference could have been due to higher rates of AMD in women who live longer in this age group (residual confounding by age within the over 70 years stratum). Another possible explanation for the higher observed rates in women is differential access to ophthalmic healthcare. However, in the EPIC-Norfolk Eye Study, women were more likely to have had cataract surgery than men (12.8% vs 9.9%. p<0.001), this indicates higher access to ophthalmic care. There were also trends for visual impairment in participants of lower social class and lower educational achievement level. A recently published review highlighted the evidence for the link between visual impairment and social class or education.23 Furthermore, it was reported recently that participants in the Los Angeles Latino Eye Study with incident visual impairment had spent less time in education, and were more likely to be unemployed.24
In summary, the EPIC-Norfolk Eye Study is a large ophthalmic epidemiological study nested within an on-going cohort study of a predominantly White British population. While the prevalence of visual impairment or blindness was low due to the selected nature of the population, more than 5% of participants did not reach UK driving standard equivalent acuity. The study provides evidence for higher rates of visual impairment in those who are older, women and with lower educational achievement.
Acknowledgments
We would like to acknowledge all members of the EPIC-Norfolk Eye Study Group.
References
Footnotes
-
Collaborators Members of the EPIC-Norfolk Eye Study Group: PJF, K-TK and NJW, principal investigators; SH, ND and DFG-H study design and management; DCB and Anna Few, clinical assessment of participants (NNUH); RL, Amit Bhaniani and Serena Anuj data management; MPYC, Alexander C Day, APK, JCS and JLYY, data analysis; Stephanie Moore and Elliott Grigg, research assistants; Daksha Parmer and Sandra Owen, study administration/assistants; DFG-H and Ananth Viswanathan, equipment provision; Pak S. Lee, nurse training; Anna McVittie, Peta Kerrigan and Karen Banks-Dunnell, Senior EPIC Research Nurses; Karen Smith, Josephine Fillery, Susan Allen, Anne Lazar, Jilly Gourlay, Mark Francis, Brian Emeney, Jayne Taylor, Mary Graydon, Jenny Jagger, Joy Blackburn, Judith Gowlett, Maureen Stuart and Lisa Davies, EPIC Research Nurses; Cristina Bouchcinsky, James Lawton and Sue Harvey, EPIC clinic study assistants; Heidi Cate, Corinne Haynes, Naomi Waller, Sally Edmunds and Karen LeGrys, NNUH research clinic staff.
-
Contributors APK carried out data analysis and drafted the manuscript. MPYC contributed to data analysis and interpretation. SH contributed to the conception and design of the study. DCB contributed to the conception and design of the study and carried out clinical assessment of referred participants. RL contributed to the design of the study, and to data acquisition and management. DFG contributed to the conception and design of the study. JCS and JLYY contributed to data analysis and interpretation. ND contributed to the conception and design of the study, and to data acquisition. NJW contributed to the conception and design of the study. KTK and PJF contributed to the conception and design of the study, and to data interpretation. All authors read and critically revised the manuscript. All authors approved the final manuscript.
-
Funding EPIC-Norfolk infrastructure and core functions are supported by grants from the Medical Research Council (G1000143) and Cancer Research UK (C864/A14136). The clinic for the third health examination was funded by Research into Ageing (262). Mr Khawaja is a Wellcome Trust Clinical Research Fellow. Miss Chan is a joint Medical Research Council/Royal College of Ophthalmologists Research Fellow, and received additional support from the International Glaucoma Association. Professor Foster has received additional support from the Richard Desmond Charitable Trust (via Fight for Sight) and the Department for Health through the award made by the National Institute for Health Research to Moorfields Eye Hospital and the UCL Institute of Ophthalmology for a specialist Biomedical Research Centre for Ophthalmology.
-
Competing interests None.
-
Ethics approval Norwich Local Research Ethics Committee (05/Q0101/191) and East Norfolk & Waveney NHS Research Governance Committee (2005EC07L).
-
Provenance and peer review Not commissioned; externally peer reviewed.
-
Data sharing statement The data sharing and preservation strategy in EPIC-Norfolk is in accordance with the Wellcome Trust data management and sharing policy. Full details about the study including contact information are on the website http://www.epic-norfolk.org.uk. Investigators wishing to work with EPIC data contact the EPIC management group through the website, letter, phone or fax, and proposals have to fulfil a number of criteria including that the work is within the bounds of consent given by participants and has been ethically reviewed and approved; there is no serious risk to the viability of continuing the cohort study for example, through offence to the participants from use of the data supplied; the science of the proposal has been satisfactorily peer reviewed and the proposal does not duplicate work already being done. Access to data for collaborators is provided through password protected website access. The large numbers of collaborators EPIC-Norfolk has locally, nationally and internationally (>300), as evidenced by collaborative publications, demonstrate the commitment to maximising the value of the study.