Article Text

Abstract
Objectives During the first wave of the 2009 influenza pH1N1, disease burden was distributed in a geographically heterogeneous fashion. It was particularly high in some remote and isolated Canadian communities when compared with urban centres. We sought to estimate the transmissibility (the basic reproduction number) of pH1N1 strain in some remote and isolated Canadian communities.
Design A discrete time susceptible-exposed-infected transmission model was fit to infection curves simulated from laboratory-confirmed case counts for pH1N1 on each day. The sampling from Poisson distribution was used to estimate the basic reproduction number, R0, of pH1N1 during the spring wave for five different communities in Manitoba and Nunavut, Canada, where remote and isolated communities experienced a high incidence of infection, and high rates of hospitalisation and intensive care unit admission.
Setting Remote and isolated communities in Northern Manitoba, Nunavut, and the largest urban centre (Winnipeg) in the province of Manitoba, Canada.
Results Using published values of the exposed and infectious periods specific to H1N1 infection, corresponding to the average generation time of 2.78 days, we estimated a mean value of 2.26 for R0 (95% CI 1.57 to 3.75) in a community located in northern Manitoba. Estimates of R0 for other communities in Nunavut varied considerably with higher mean values of 3.91 (95% CI 3.08 to 4.87); 2.03 (95% CI 1.50 to 3.19); and 2.45 (95% CI 1.68 to 3.44). We estimated a lower mean value of 1.57 (95% CI 1.35 to 1.87) for R0 in the Winnipeg health region, as the largest urban centre in Manitoba.
Conclusions Influenza pH1N1 appears to have been far more transmissible in rural and isolated Canadian communities than other large urban areas. The differential severity of the pandemic in these regions may be explained partly by differential transmissibility, and suggests the need for more nuanced, targeted or population-specific control strategies in Canada.
This is an open-access article distributed under the terms of the Creative Commons Attribution Non-commercial License, which permits use, distribution, and reproduction in any medium, provided the original work is properly cited, the use is non commercial and is otherwise in compliance with the license. See: http://creativecommons.org/licenses/by-nc/2.0/ and http://creativecommons.org/licenses/by-nc/2.0/legalcode.
Statistics from Altmetric.com
Article summary
Article focus
-
The perceived mild nature of the 2009 H1N1 pandemic is largely based on the observed outcomes of disease in urban centres and densely populated areas.
-
Estimates for the transmissibility of this virus suggest that the novel H1N1 was less transmissible than the 1918 pandemic strain.
-
These findings may not reflect the true nature of disease in remote and isolated communities.
Key messages
-
Transmissibility of the novel H1N1 pandemic appears to have been significantly higher in some remote and isolated Canadian communities compared to that in urban centres.
-
Our findings for indigenous communities with the type of attack rate and transmissibility of influenza infection tantamount to the 1918 pandemic is a cause for alarm, and underscore the need for nuanced and community-specific intervention measures with improved access to healthcare and critical infrastructures.
Strengths and limitations of this study
-
The differential severity of the pandemic in these regions may be explained partly by differential transmissibility.
-
Comparison of H1N1 transmissibility in several remote and isolated communities with an urban centre in Canada.
-
Limitations of this study include the simplifying assumption of homogeneity in the population interactions; and the lack of specific data, which precludes the use of more complex models with network structure or age-stratified populations. The simple model structure does not elucidate the specific mechanisms driving increased transmissibility in the communities studied here.
Introduction
Early outbreaks of the 2009 H1N1 influenza pandemic displayed variable degrees of incidence, apparently higher attack rates and more severe disease outcomes in several remote and isolated communities in Canada.1 ,2 Epidemiological data collected during the first wave of H1N1 pandemic indicate disproportionately higher rates of hospitalisation and intensive care unit (ICU) admission in these communities. For instance, hospitalisation rates in Nunavut and northern Manitoba were 2.44 and 1.27 per 1000 population, respectively, which are significantly higher than the corresponding rates for Winnipeg (0.13) or the province of Ontario (0.033). Similar differences are evident from data regarding ICU admission rates, which were higher for Nunavut (0.20) and northern Manitoba (0.16) than those for Winnipeg (0.032) and Ontario (0.0056), per 1000 population. The differential prevalence of predisposing health conditions including diabetes, pregnancy and morbid obesity, has received considerable attention as explicators of severe outcomes of H1N1 pandemic in rural and urban communities in Canada.2 The high rates of hospitalisation and ICU admission within these remote regions could be linked to both transmissibility of the disease and to the prevalence of factors predisposing to more severe outcomes in infected individuals.
An important index of transmissibility for a communicable disease is the basic reproduction number (R0) that represents the number of secondary infections generated by a single infected case in an entirely susceptible population.3 Early published literature for the transmissibility of pandemic H1N1 infection provides a range of 1.2−1.8 for R0,4–7 mainly in large urban settings, suggesting that the novel H1N1 strain was less transmissible than the 1918–1919 pandemic virus for which R0 has been estimated in the range 1.8−3.0.8 However, early estimates may not apply in remote and isolated communities that have distinct demographic characteristics, as well as distinct environmental (built or natural) conditions. We sought to evaluate differential transmissibility of H1N1 in five distinct population settings in Canada: a remote/isolated community in the Burntwood health region of northern Manitoba, three remote/isolated communities in Nunavut, and compare them with the largest urban area (ie, the Winnipeg health region) in Manitoba. Communities in Nunavut as well as several communities in northern Manitoba would be considered remote and/or isolated communities9 and many of these geographic areas have predominantly Aboriginal populations (eg, 85% of the Nunavut population and 76% of the northern Manitoba region self-identify as Aboriginal).10
Material and methods
To estimate plausible ranges for R0, we employed a discrete time epidemic model, and fitted to infection curves inferred from collected data for laboratory-confirmed cases of H1N1 infection during the first wave of the 2009 pandemic. Details of data and estimation procedure are described below.
Case data
We obtained the daily number of laboratory-confirmed cases of pandemic H1N1 influenza (in which the cases were reported based on the earliest date of symptom onset, initial care, specimen collection, hospital admission, or ICU admission) for the period of 3 May to 5 August 2009, for each community under study. A laboratory-confirmed case was reported as an individual with ILI or severe respiratory illness who tested positive for pandemic H1N1 influenza A virus by real-time reverse-transcriptase PCR (RT-PCR) or viral culture. These data were collected and provided by Manitoba Health, and the Nunavut Department of Health and Social Services.
The model
We considered a homogeneous mixing structure for the model in which individuals are identified by their epidemiological status as susceptible (S), exposed but not yet infectious (E), infectious (I) and recovered (R). Exposed state refers to the period of time following transmission of infection during which the newly infected person cannot transmit the disease and symptoms are absent before developing clinical disease. Assuming that the reduction in the number of susceptibles is small during the early stages of the outbreak (ie,  , where S0 is the initial number of susceptibles),11 the number of infections at time t is given by12
where σ and γ are the average duration of exposed and infectious stages, I0 is the initial number of infectious cases (in this case, the number of cases in datasets generated through sampling described below), and R0 is the basic reproduction number. The expression (1) describes the exponential growth of epidemic spread following disease outset. We estimated R0 by fitting I(t) to infection curves during the exponential phase of epidemic growth.
Model parameters
The values of exposed and infectious periods were taken from estimated ranges in the published literature specific to the 2009 pandemic, with a fixed exposed period of 1 day.13 We sampled the duration of infectiousness from a log-normal distribution with the mean of 3.38 days.11 Using a common heuristic, that the generation times can be estimated as the sum of the exposed period and half of the duration of infectiousness,14 leads to a mean generation times of 2.69 days. Considering a size-biased sampling approach, where primary cases with many secondary cases are assigned a greater weight,15 the mean of generation times includes an additional term given by variance multiplied by half of the duration of infectious period. This gives a slightly higher mean generation times of 2.78 days, which lies within the estimated range for pandemic H1N1.16–18
Sampling
To determine the variability in R0, we generated 1000 datasets for case counts on each day through sampling from a Poisson distribution. We considered the absolute difference between the number of laboratory-confirmed cases on day j and day j + 1 as the mean of distribution. To generate new datasets, we added (subtracted if the difference was negative) the sampled value to the number of reported cases on day j to obtain new cases on day j + 1. This sampling approach captures a higher variability in the number of observed cases during the epidemic course and a smaller variability at the onset or towards the end of epidemic.19 To create an infection curve for each dataset, first we sampled an infectious period for each case from a log-normal distribution with the scale parameter a=1.192 and shape parameter b=0.05.11 We assumed that the infectious period was initiated one day before the case was confirmed (reported date).11 ,12 This effectively means that every case was on the infection curve I(t) for its sampled duration of infectiousness (figures 1 and 2).

Infection curves for remote and isolated communities, generated through sampling procedure. The black circled-curves in the time courses correspond to the infection curves generated from the reported data, and grey curves are generated from sampled data.

Infection curve for Winnipeg health region, generated through sampling procedure. The black circled-curves in the time courses correspond to the infection curves generated from the reported data, and grey curves are generated from sampled data.
R0 estimation
Since the reproduction number reflects only the growth rate during the early stages of the epidemic, estimating R0 is sensitive to the time period chosen for fitting the model to the data.20 For a fit with very short timelines following the onset of the outbreak (establishment phase), the uncertainty in estimates of R0 will be high. On the other hand, fitting the model using data that extend beyond the epidemic peak will result in underestimating R0, through the influence of several factors, including widespread implementation of public health measures and an increase in herd immunity, which may in turn invalidate the assumption  . In order to minimise these effects, we obtained the turning points of the outbreaks following the initial exponential growth phase, beyond which the epidemic will no longer have exponential growth. We performed fitting from the date at which the first laboratory-confirmed case was identified, up to one day before the turning point for each infection curve, to ensure that R0 estimates reflect the initial growth phase of the outbreak. Turning point for each dataset was obtained through fitting the Richards model to the cumulative number of daily counts in each infection curve.21 ,22 Assuming that K represents the cumulative number of daily cases for an infection curve I(t) (generated through sampling method described above), the first turning point tm was obtained by solving the equation
  , where c is the deviation parameter estimated using the method of least squares through curve fitting.23 This equation holds at the inflection point for the solution of the Richards model. We then estimated R0 by fitting I(t) in equation (1) to the generated infection curves from the date of the first laboratory case until
  . The mean values and 95% CIs were obtained from the R0 distributions generated through the fitting procedure.
Results
The infection curves generated for fitting are illustrated in figures 1 and 2. The mean estimate of R0 for a northern community in Manitoba (figure 1a) is 2.26 (95% CI 1.57 to 3.75), which is higher than the estimate for Winnipeg health region with the mean value of 1.57 (95% CI 1.35 to 1.87). We obtained considerably higher estimates for the mean values of R0 for other communities in the territory of Nunavut (figures 1b–d): 3.91 (95% CI 3.08 to 4.87); 2.03 (95% CI 1.50 to 3.19); and 2.45 (95% CI 1.68 to 3.44). Mean values of R0 stay above previous estimates for H1N1 transmission in larger communities and urban centres.4–7 While estimated R0 ranges considerably overlap, outbreaks in Nunavut appear to have been driven by somewhat higher transmissibility that is comparable or higher than that of the 1918 pandemic.8 We further estimated R0 by creating a single dataset for northern communities in Manitoba and Nunavut. The mean value of R0 was 2.21 (95% CI 1.98 to 2.50), providing a significant difference (Wilcoxon signed-rank test: p<0.001) when compared with R0 estimates for the Winnipeg health region.
Discussion
Determining the variability in transmissibility of a novel disease in populations with different demographics (eg, age structure, household composition, and housing density) is crucial for identifying the within-community factors that have the greatest influence on disease spread and (by changing the total number of infections) its severity. Our results suggest that more severe outcomes observed in the 2009 influenza A H1N1 pandemic in remote and isolated communities2 may have been due to differential transmissibility of infection, resulting in more rapid epidemic spread and larger numbers of individuals affected at northern latitudes.24
Estimates of transmissibility could play an important role in determining the most effective utilisation of public health interventions, in particular when resources are scarce. It is important to note that R0 is effectively an exponent that determines both epidemic growth properties at the early stage of disease outset, the final size of an epidemic in the absence of interventions and the fraction of individuals who need to be vaccinated to achieve herd immunity.25 For example, the expected relative final size of an epidemic with an R0 of 2.7 is 25% larger in the absence of intervention than an epidemic with an R0 of 1.8; and to attain an immune herd (ie, critical vaccination level: 1–1/R0), the absolute fraction of the population vaccinated must be 19% higher in the population with the higher R0. This has important public health implications for vaccination programmes and suggests that transmissibility is an important consideration in prioritising the allocation of limited health resources.
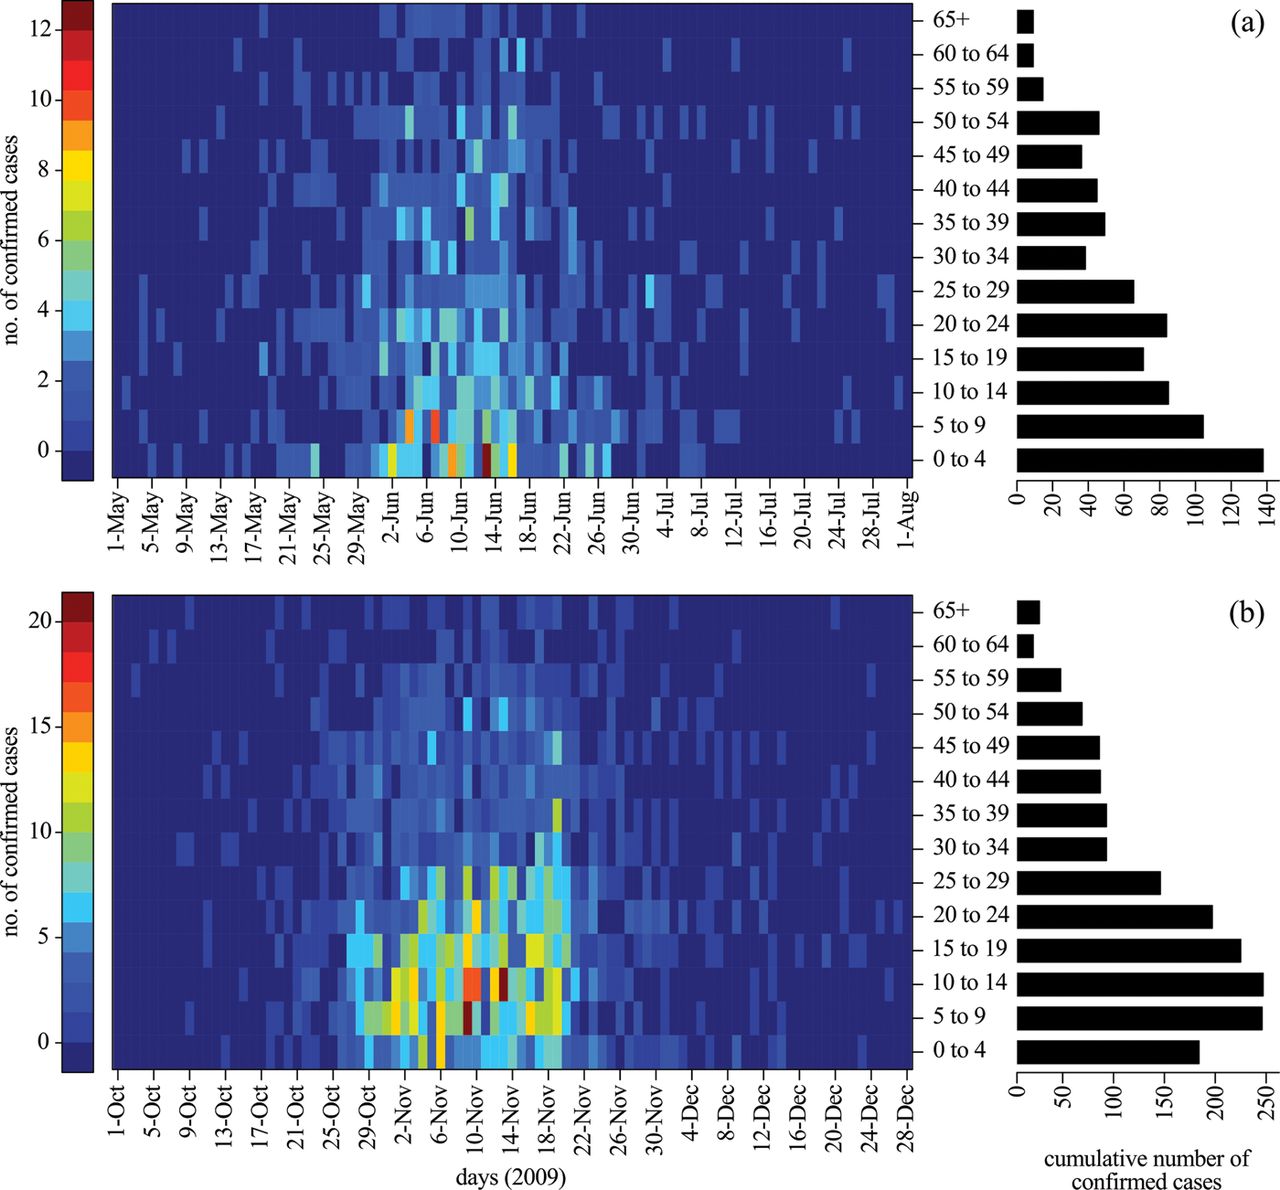
The mechanisms underlying the differential transmissibility of a pathogen in these Canadian communities are unclear, but could be related to the effectiveness of available disease control programmes, environmental factors including the prevalence of low-quality housing,26 exposure to indoor air pollutants, lack of access to clean water and also to differences in demographic characteristics, crowding and mixing patterns. For example, the average number of persons per household in the northern Manitoba region is 3.6, which is 44% greater than the mean size of 2.5 persons per household in Winnipeg as the largest urban centre in the same province.27 ,28 The average number of people per household in Nunavut is 3.8, which is higher than both northern Manitoba and Winnipeg;10 this may therefore account for a higher rate of secondary household transmission, which is known as a major route for the spread of influenza infection in the wider community.29–31 In addition, age has been recognised as an important parameter for the spread of disease with higher rates of infectious contacts among schoolchildren and younger adults. There are also differences in the age profiles of the populations studied here with other urban centres. For example, the average age in the northern Manitoba region is 24 and in Nunavut is 23,10 which is approximately 15–16 years younger than the average age (38.7) in Winnipeg.26 ,27 In Nunavut, only 2.7% of the population is greater than 65 years of age and 34% of the population is less than 15 years of age.10 Although older age has been associated with a higher risk of severe outcomes during seasonal influenza epidemics, pandemics (eg, 1918, 1957) are generally characterised by high rates of morbidity and mortality among younger adults,32 ,33 as has also been documented for the 2009 H1N1 pandemic.34 Moreover, serological studies have shown the existence of cross-reactive antibody responses for individuals older than 50 years of age due to prior exposure to similar viruses,35 which may reflect a reduced likelihood of H1N1 infection in older populations. As was observed in other geographic regions,36 in Manitoba the 2009 pandemic predominantly affected young adults and children in both spring and fall waves (figure 3).
Heatmaps represent the daily number of laboratory confirmed cases of H1N1 infection for various age-groups during the first (a) and second (b) waves of the 2009 pandemic in the province of Manitoba. Barplots represent the cumulative number of laboratory confirmed cases for different age-groups during the first (a) and second (b) waves of the 2009 pandemic in the province of Manitoba.
In populations with low mean age (such as Nunavut), the buffering effect of pre-existing immunity in older individuals is less pronounced, which may contribute to higher transmissibility of the virus. In remote and isolated communities in Canada, climate, healthcare capacity in the community, socioeconomic status, health status, presence of vulnerable groups (eg, children <5 years of age, immunocompromised, and pregnant women), limited numbers of healthcare workers in the community, equipment and facilities, medical transportation and other critical infrastructure such as housing also play a role in determining differential epidemic impact.37
The model employed in this study is subject to limitations, including the simplifying assumption of homogeneity in the population interactions. Some of the limitations are imposed by the lack of specific data, which precludes the use of more complex models with network structure or age-stratified populations. The simple model structure does not elucidate the specific mechanisms driving increased transmissibility in these communities. However, empirical evidence to support the observation of increased transmissibility in these communities clearly demonstrates the need for ongoing research in order to identify the specific mechanisms. Due to uncertainties in the level of pre-existing immunity and its distribution in different age segments of the population, we did not include the effect of immune responses in our model. However, considering prior immunity38 we would expect to estimate greater values for R0 compared to when the entire population is assumed to be susceptible. Finally, our model considers these communities without considering travel or interactions with other population settings in the same region. It is possible that some influenza cases were undiagnosed and thus not captured in surveillance data; this would lead us to underestimate the transmissibility of the virus, making our estimates ‘lower bound’ estimates. We would expect underreporting to be less likely in the first wave of the pandemic (the time period that we examined) than the second wave, as individuals with influenza-like illness symptoms were encouraged to seek medical care, especially in remote and isolated communities. In the absence of data for the true burden of the disease, we used laboratory-confirmed case counts, which may be subject to biases due to differential rates of testing between different age groups, different geographic regions and over time. However, it is difficult to assess the magnitude and direction of such biases. Data available for this study did not provide any relevant information on other potential confounders that could be included in our estimation model. Despite these limitations, our results suggest that there is indeed a considerable difference between the reproduction numbers of H1N1 outbreaks in remote and isolated communities and urban centers. Further investigation is required to explore the underlying mechanistic reasons for this differential transmissibility, which could determine population-specific factors that should be integrated into the process of public health decision making for future planning, in the face of an emerging infectious disease.
Acknowledgments
This study was supported by the Canadian Institutes of Health Research (Grant no. 114932, 104047), and the Mathematics of Information Technology and Complex Systems.
References
Footnotes
-
Contributors SM conceived, designed the study and collected data. LG, CB developed the model and performed inference. DF, AG, SM wrote the paper. LG, CS, AG, DF, SM contributed reagents/materials/analysis tools. All the authors have read the final version of the paper and approved it.
-
Funding This study was supported by the Canadian Institutes of Health Research (Grant no. 114932, 104047), and the Mathematics of Information Technology and Complex Systems. The funders had no role in study design, data collection and analysis, decision to publish or preparation of the manuscript.
-
Competing interests None.
-
Ethics approval Data use was approved by the Human Research Ethics Board of the University of Manitoba (H2009:339), Health Information Privacy Committee of Manitoba (2009/2010–2040) and the University of Toronto Research Ethics Board.
-
Provenance and peer review Not commissioned; externally peer reviewed.
-
Data sharing statement The data were obtained from Manitoba Health and Nunavut Social Health Services (Canada), and research agreements were signed with First Nations assembly for the use of data. Data sharing is not permitted under these research agreements.