Article Text

Abstract
Objectives To assess whether in people with poorly controlled type 2 diabetes (HbA1c>7.5%) improvement in HbA1c varies by ethnic and social group.
Design Prospective 2-year cohort of type 2 diabetes treated in general practice.
Setting and participants All patients with type 2 diabetes in 100 of the 101 general practices in two London boroughs. The sample consisted of an ethnically diverse group with uncontrolled type 2 diabetes aged 37–71 years in 2007 and with HbA1c recording in 2008–2009.
Outcome measure Change from baseline HbA1c in 2007 and achievement of HbA1c control in 2008 and 2009 were estimated for each ethnic, social and treatment group using multilevel modelling.
Results The sample consisted of 6104 people; 18% were white, 63% south Asian, 16% black African/Caribbean and 3% other ethnic groups. HbA1c was lower after 1 and 2 years in all ethnic groups but south Asian people received significantly less benefit from each diabetes treatment. After adjustment, south Asian people were found to have 0.14% less reduction in HbA1c compared to white people (95% CI 0.04% to 0.24%) and white people were 1.6 (95% CI 1.2 to 2.0) times more likely to achieve HbA1c controlled to 7.5% or less relative to south Asian people. HbA1c reduction and control in black African/Caribbean and white people did not differ significantly. There was no evidence that social deprivation influenced HbA1c reduction or control in this cohort.
Conclusions In all treatment groups, south Asian people with poorly controlled diabetes are less likely to achieve controlled HbA1c, with less reduction in mean HbA1c than white or black African/Caribbean people.
- diabetes & endocrinology
- primary care
- therapeutics
- public health
This is an open-access article distributed under the terms of the Creative Commons Attribution Non-commercial License, which permits use, distribution, and reproduction in any medium, provided the original work is properly cited, the use is non commercial and is otherwise in compliance with the license. See: http://creativecommons.org/licenses/by-nc/2.0/ and http://creativecommons.org/licenses/by-nc/2.0/legalcode.
Statistics from Altmetric.com
Article summary
Article focus
-
Variation in HbA1c improvement by ethnic and social groups, in people with poorly controlled type 2 diabetes (HbA1c>7.5%).
-
HbA1c improvement with different types of diabetes treatment by the ethnic group.
Key messages
-
South Asian people have less improvement in HbA1c than white or black African/Caribbeans.
-
This is true in all treatment categories whether on metformin alone, combined oral or insulin.
Strengths and limitations of this study
-
It is representative of people routinely cared for by general practitioners in community settings.
-
Duration of diabetes is an important influence on HbA1c and treatment response with longer duration in South Asians. We were unable to reliably ascertain duration of diabetes and cannot confirm whether duration is the cause of our findings.
Introduction
An estimated two million (4%) people in the UK have type 2 diabetes. It is a leading cause of cardiovascular and related morbidity and reduces life expectancy by 10 years.1 ,2 Higher HbA1c values are associated with greater mortality and morbidity.3 ,4
Ethnic and social differences in diabetes prevalence are substantial and increasing particularly among south Asian people in whom onset is a decade earlier, with higher levels of HbA1c and increased morbidity in comparison with white people.1 ,5 In 2004, initiatives to improve care targeted the most socially disadvantaged ‘Spearhead’ Primary Care Trusts (PCT). In addition national guidance was supported by a national quality and outcomes framework (QoF) with financial incentives to general practitioners who achieved HbA1c levels controlled to 7.5% or less.6 ,7 From 2004 to 2010 more intensive drug treatment was associated with improved HbA1c control in all ethnic groups, but differences between ethnic groups persisted.8–13 The 2009 national UK diabetes audit recorded 70% of white people with controlled HbA1c levels, compared to 58% of south Asian people.1
There have been no trials to evaluate whether diabetes treatments to control HbA1c levels are variably effective by ethnic and social group.14–16 We aimed to assess, if improvement in HbA1c in people with poorly controlled type 2 diabetes (HbA1c>7.5%) varies by ethnic and social group using primary care data in an ethnically diverse population.
Methods
This study is based on the electronic medical records of all 101 general practices in Newham and Tower Hamlets PCT which serve 440 000 people. The same computer system and prespecified codes for recording data are used by all practitioners. The data were accessed via EMIS web (www.emis-online.com) in August 2010.
Individual self-reported ethnicity was recorded by general practices using the groups identified in the 2001 UK census and collapsed into four categories; white (British, Irish and other white), south Asian (Bangladeshi, Indian, Pakistani, other Asian and mixed Asian), black African/Caribbean (African, Caribbean, black British and mixed black) and other (any other recorded ethnic group). This enabled comparison with existing studies in the UK. Social deprivation was measured using the Townsend score, which is routinely available in these electronic medical records. This score is derived from Census data on unemployment, car and home ownership and overcrowding at lower superoutput area level (approximately 400 households) linked to individual patient postcode.17 ,18 The score indicates the spectrum of deprivation within small geographical areas where the most deprived are likely to be unemployed, without a car and living in rented, overcrowded accommodation.
Body mass index (BMI) and serum cholesterol were estimated using the latest recording in 2007. The latest HbA1c value and all diabetes prescriptions within each annual 12 month period were recorded. Variables were marked as missing if values lay outside specified limits.
Broadly speaking there are four clinical stages of treatment to reduce HbA1c levels in patients with diabetes; diet only, metformin, other oral hypoglycaemic medication with or without metformin and insulin alone or in combination with oral hypoglycaemic agents. We extracted all prescriptions during the study period for the cohort. We categorised treatment as; ‘Metformin Only’ if the patient received only metformin for the whole study period, ‘Combined Oral’ if the patient received any other oral hypoglycaemic either without or in addition to metformin for the whole study period and did not receive insulin; ‘Insulin’ if the patient received insulin for the whole study period; ‘Metformin Only to Combined Oral’ if the patient changed from Metformin to Combined Oral over the study period; ‘Any to Insulin’ if the patient changed from Metformin only, or Combined Oral over the study period. We did not include patients without any prescriptions in a given year as we were unable to ascertain whether they had in fact left the practice.
The sample was drawn from all individuals recorded as having type 2 diabetes at the start of the observation period in the 101 general practices, aged 37–71 years in 2007, who had uncontrolled diabetes (HbA1c>7.5%) in 2007 and who also had HbA1c recorded in 2008 and 2009. Patients were excluded if treatment was missing during one or more years or treatment did not fit in any of the cohort treatment categories described. The lower age limit excluded misclassified type 1 diabetes and older ages were excluded because intensive treatment may be clinically inappropriate.19 ,20
Typically the ‘Combined Oral’ treatment will consist of either sulphonylurea alone, or one of the newer oral agents—thiazolidinediones, insulin secretagogues, dipeptidylpeptidase-4 inhibitors—alone, or in combination with the sulphonylurea. We considered five subcategories for ‘Combined Oral’: ‘Sulphonylurea alone’ if the patient received only sulphonylurea for the whole study period, ‘New agent alone’ if the patient received only new agents for the whole study period, ‘Sulphonylurea and new agent’ if the patient received sulphonylurea and new agents for the whole study period, ‘One to both’ if the patient begun on either sulphonylurea or new agents and their treatment was intensified to both treatments during the study; and ‘Other’ otherwise.
Diabetes duration at baseline was categorised as ‘0–2 years’ if the patient received their first diabetes diagnosis code between 2005 and 2007, and ‘>2 years’ if they received their first code prior to 2005. Exploratory analysis indicated that these codes were unreliable to estimate time-with-diabetes prior to 2004.
Two outcome measures were used to assess treatment effectiveness; change from baseline (CfB) HbA1c and HbA1c control. HbA1c values in 2007 were taken as the baseline covariate values. Thus, a patient's CfB HbA1c for 2008 was their 2008 value minus their 2007 value; CfB HbA1c 2009 was their 2009 value minus their 2007 HbA1c value. A patient was considered to achieve HbA1c control in 2008 if their 2008 HbA1c value was 7.5% or less and in 2009 if their 2009 HbA1c value was 7.5% or less.
Statistical analysis
Analysis was performed using Stata V.12.0 (www.stata.com). Demographic statistics for each ethnic group were calculated. Data were structured with variation at four levels; the lowest level was year, level 2 was person, level 3 was practice and level 4 was PCT. A linear multilevel model was used to estimate the CfB HbA1c in 2008 and 2009.21 A logistic multilevel model was used to estimate the probability of achieving HbA1c control in 2008 and 2009. These models incorporated the structure of the data by including random effects for person, practice and year. The models were adjusted for baseline HbA1c (2007 HbA1c value), age, sex, year, BMI, serum cholesterol, cohort treatment, diabetes duration, Townsend category and ethnic group as these variables were considered likely to influence HbA1c improvement. Patients with ‘Other’ ethnic groups recorded were not included in the model construction as they consisted of many different ethnic groups and were small in number.
An ethnicity×treatment interaction was added to each model to assess whether ethnicity was a factor in HbA1c reduction and HbA1c control for each treatment. An ethnicity×year interaction was added to the models to assess if the difference in HbA1c reduction and achievement of HbA1c control between ethnic groups changed between 1 and 2 years. An ethnicity× diabetes duration interaction was added to the models to assess whether the difference between ethnic groups in HbA1c reduction and achievement of HbA1c control varied between the two duration categories. Significance was set at the 5% level.
Exploratory analysis was conducted on the ‘Combined Oral’ subcategories.
Results
In August 2010, data were collected from 100 of the 101 practices in Tower Hamlets and Newham. One practice declined participation. Over the 3 years of the study, a total of 28 041 people in the study age range were identified as having type 2 diabetes in 2007 and 17 670 (63%) had an HbA1c recording in 2007. Of these 17 670 people, 8864 (50%) had uncontrolled diabetes (HbA1c>7.5%) of whom 42% were white, 50% were black African/Caribbean and 53% were south Asian. Among the 8864 uncontrolled patients, 6464 (73%) also had HbA1c values in 2008 and 2009. Of those excluded because of missing HbA1c records, 30% were white, 25% south Asian and 27% black African/Caribbean people; 27–28% were in each social deprivation group. Finally 207 (3%) people were excluded because they had missing treatment information in one or more years and 153 (2%) did not fit into any of the cohort treatment categories described in the methods.
The final sample therefore consisted of 6104 (68.9%) of the 8864 people with uncontrolled diabetes HbA1c >7.5%. Of these, 6017 (99%) had ethnicity recorded, 6087 (>99%) people had Townsend score recorded. Age and sex was recorded in everyone and serum cholesterol in 95% and BMI in 94%. In total there were 1101 (18%) white, 3785 (63%) south Asian, 993 (16%) black African/Caribbean and 160 (3%) other ethnic groups in the sample. Only 2% of people fell in the two least deprived quintiles, so the least three quintiles were combined and categorised as ‘Least’ deprived (N=1204, 20%), ‘High’ deprivation if they were in the most deprived quintile (N=1858, 31%) and ‘Medium’’ (N=3025, 50%) otherwise.
Table 1A describes the variable mean or percentage in each category for each demographic group. Table 1B describes the HbA1c mean and proportion of HbA1c control for each demographic group. Baseline HbA1c and the diabetes duration distribution were similar between ethnic groups. After 1 and 2 years mean HbA1c decreased in each ethnic group but the mean reduction in HbA1c from baseline was less in south Asian patients than other ethnic groups and these patients had the least chance of achieving HbA1c controlled to 7.5% or less. A similar proportion of each ethnic group fell into each deprivation category.
Patient characteristics
Altogether, 7% of patients remained on ‘Metformin Only’ for the whole study, 46% on ‘Combined Oral’ and 33% on ‘Insulin’. Treatment intensity increased in 15% of patients during the study. Despite similar baseline HbA1c, treatment categories between ethnic groups differed significantly (p<0.001); there was a greater proportion of south Asian people on ‘Combined Oral treatment’ 50% than white 35% or black African Caribbean 44% and a greater proportion of south Asian 80% and black African/Caribbean people 79% started and remained on more intensive treatment (either Combined oral or insulin) than white 75%.
Fewer south Asian people, 36% started or changed to insulin compared to black African/Caribbean 42% and white people 49%. A subanalysis indicated white people were significantly more likely to increase their treatment intensity 30%, than south Asian 19% and black people 22% (p<0.001).
Table 2A,B describe the statistical models to estimate CfB HbA1c and HbA1c control. Person, practice and PCT were all significant (p<0.001) and were included in the final models. Baseline HbA1c, age, serum cholesterol, ethnicity, sex and cohort treatment had a significant effect on CfB HbA1c and HbA1c control. Townsend category and BMI were not significant but were retained in the models as variables of interest. The ethnicity×treatment and ethnicity×year interactions were not significant and were not included in either model.
Statistical model parameter estimates
In people with uncontrolled HbA1c at baseline, after 1 and 2 years on treatment; south Asian people had 0.15% less reduction in mean HbA1c than white people (p=0.005) and white people were 1.6 times (p<0.001) as likely to achieve HbA1c control relative to south Asian people. White and black African/Caribbean people had no significant difference in CfB HbA1c (p=0.705) or HbA1c control achievement (p=0.460). There was no evidence that social deprivation affected HbA1c reduction or HbA1c control achievement.
The ethnicity×treatment interaction was not significant, indicating that in each of the different treatment groups, south Asian people had the smallest reduction in HbA1c and the lowest probability of achieving HbA1c control after 1 and 2 years. This also indicates white and black African/Caribbean people have a similar response to each treatment. The ethnicity×diabetes duration interaction was not significant, indicating that south Asian people have the smallest reduction in HbA1c and probability of achieving HbA1c control when their duration of diabetes is between 0 and 2 years and more than 2 years.
Figure 1 illustrates that for an individual with HbA1c 9% at baseline on ‘Metformin Only’ and ‘Insulin’ treatments, that south Asian people had the least reduction in HbA1c for each treatment.

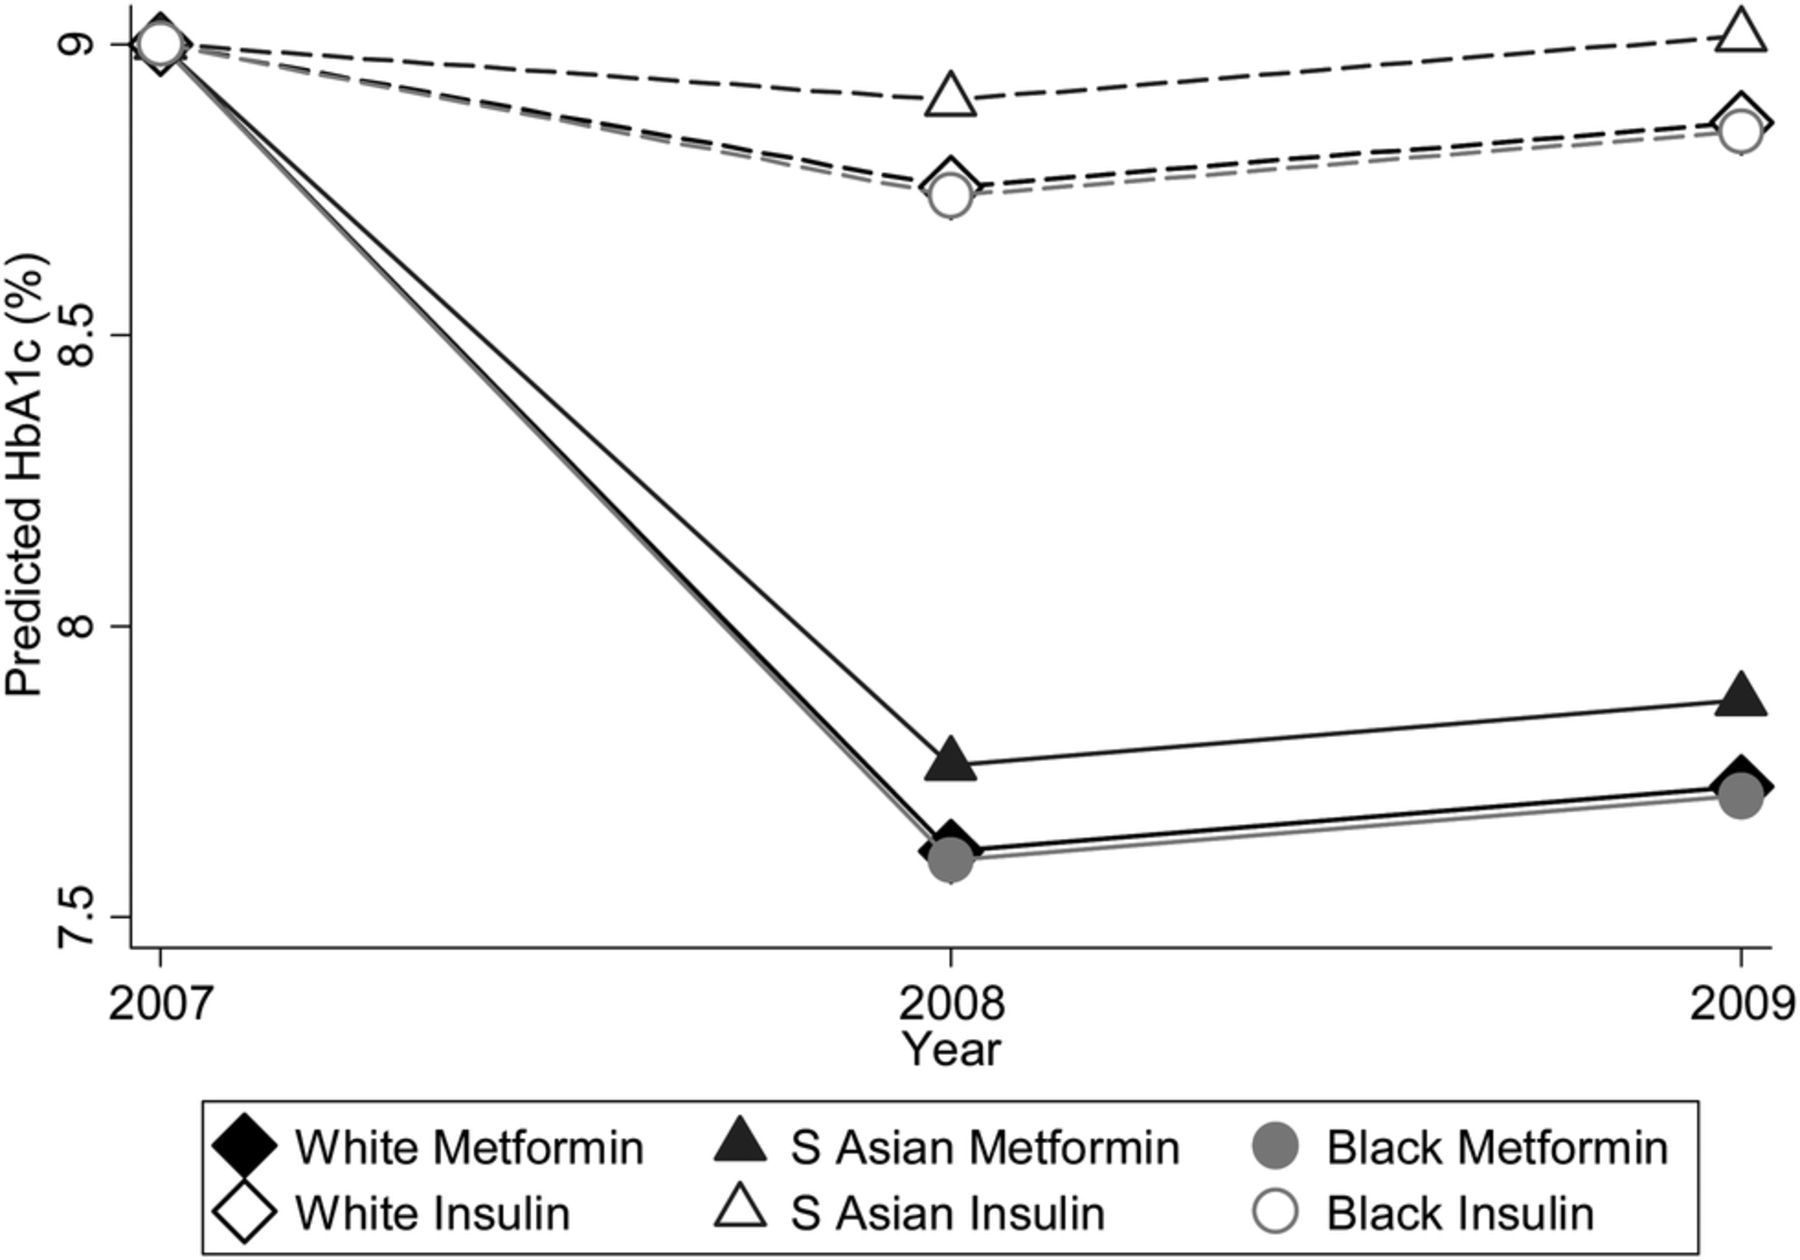
Expected HbA1c for each ethnic group on ‘Metformin Only’ and ‘Insulin’ treatment.
There was little variation in the distribution of subcategories in the ‘Combined Oral’ treatment between ethnic groups (table 3). Most noticeably, white people were the most likely to intensify 20%, followed by black African/Caribbean people 18% and south Asian people 17%.
Combined oral treatment subcategories
Discussion
This observational study is the first to assess whether HbA1c responds equally to different types of diabetes treatment in different ethnic and social groups. We found HbA1c improved in all ethnic groups over a 2- year period, but HbA1c improved less in south Asian people for each treatment relative to other ethnic groups. We found no association between social deprivation and HbA1c improvement after adjustment for other variables.
The interpretation of the model coefficients in tables 2A,B can be illustrated by considering two patients similar for all variables except for treatment. One patient is on ‘Metformin Only’ and the other on ‘Insulin’. In 2008, the patient on ‘Insulin’ will have their HbA1c reduced by 1.11 less than the patient on ‘Metformin Only’ treatment. The same comparison in table 2B indicates a patient on ‘Insulin’ treatment has an OR of 0.06 meaning that a patient on Metformin is 16.67 (1/0.06) times as likely to achieve HbA1c control than a patient on Insulin. However, this does not indicate that Metformin is more effective at controlling HbA1c then Insulin. This study is unable to compare the effectiveness of these treatments as HbA1c levels in patients on insulin are more difficult to control as they are likely to have increased duration of diabetes and other diabetes drugs have failed to control their HbA1c levels.
Higher HbA1c in south Asians has been confirmed in most studies which also confirm their higher intensity of oral treatment and lower use of insulin.15 ,22–24 Poor HbA1c control in African Americans has also been reported in the USA, though our study found no such disparity in black African/Caribbean people.14 ,16 ,25 ,26
Our study is unable to differentiate the reasons why south Asian patients respond less favourably to treatment. It could be lack of treatment efficacy in these patients. Alternatively it could be due to the duration of diabetes where HbA1c control has been shown to deteriorate despite treatment in all categories over time.27 South Asian people have earlier onset of diabetes as reflected in our study by the younger mean age; 56 years in south Asians compared to 60 years in white and 58 years in black African/Caribbean people. At the start of the study more black African/Caribbean 79% and south Asian patients 80% were already on higher-intensity treatment (either Combined oral or insulin) than white patients 75%. During the study period a significantly higher proportion of white people (p<0.001) increased their intensity of treatment than black African/Caribbean or south Asian people and this may also have contributed to less reduction in HbA1c in the latter who were already on more intensive treatment.
Our study is large and included almost all those diagnosed with type 2 diabetes in the age range in a large contiguous geographical area. It has high numbers of people in each ethnic group allowing for precise comparisons between ethnic groups and the extent and quality of ethnic group and social deprivation recording was high. For all adjustment variables used, less than 10% of data was missing. All patients had longitudinal HbA1c values allowing us to examine the change in HbA1c over time.
The different ethnic groups had similar mean baseline HbA1c suggesting diabetes severity was similar across ethnic groups. HbA1c increases with duration of diabetes but information was limited as exploratory analysis indicated that durations exceeding 2 years could not be further categorised reliably. The inclusion of age and treatment in the statistical models explains some but not all of the effect of diabetes duration on HbA1c. Longer diabetes duration could therefore be an explanation for the observed ethnic group differences.
A limitation of the study was the exclusion of 31% of those with uncontrolled diabetes because of missing treatment or HbA1c records which may have introduced bias. However, fewer south Asians were excluded for this reason which suggests that as a group, they were more likely to be more concordant with care. Selection bias was an unlikely cause of the smaller reduction of HbA1c in south Asian people in this study. Finally, there is no evidence to suggest that south Asian people are less likely to respond to change in lifestyle factors such as diet or physical activity as compared with other ethnic groups.
Conclusion
This study provides evidence that south Asian people with poorly controlled type 2 diabetes are on higher-intensity treatment than white or black African/Caribbean people. Despite this, south Asians tended to achieve less HbA1c reduction over time than other ethnic groups from all types of diabetes treatment whether this was metformin alone, combined oral treatment or insulin alone or in combination. While the reasons for this remain uncertain, this finding is relevant to clinicians seeking to achieve HbA1c control below 7.5%, particularly in areas with large south Asian populations.
Acknowledgments
We are grateful to S Shajahan who managed the project and to K Boomla and the east London Clinical Effectiveness Group and east London general practitioners for access to data.
References
Footnotes
-
Contributors GJ designed the analysis and undertook data extraction, analysis and interpretation, PB undertook the literature review. All authors contributed to the drafting of the paper and development of core ideas. JR and SH were principal investigators who initiated and supervised the study.
-
Funding The study was funded by The Health Foundation.
-
Competing interests None.
-
Ethics approval Ethical committee consent was not required for review of non-identifiable routinely collected data.
-
Provenance and peer review Not commissioned; externally peer reviewed.
-
Data sharing statement No additional data are available.