Article Text

Abstract
Objectives To assess whether delaying risk reduction treatment has a different impact on potential life years lost in younger compared with older patients at the same baseline short-term cardiovascular risk.
Design Modelling based on population data.
Methods Potential years of life lost from a 5-year treatment delay were estimated for patients of different ages but with the same cardiovascular risk (either 5% or 10% 5-year risk). Two models were used: an age-based residual life expectancy model and a Markov simulation model. Age-specific case fatality rates and time preferences were applied to both models, and competing mortality risks were incorporated into the Markov model.
Results Younger patients had more potential life years to lose if untreated, but the maximum difference between 35 and 85 years was <1 year, when models were unadjusted for time preferences or competing risk. When these adjusters were included, the maximum difference fell to about 1 month, although the direction was reversed with older people having more to lose.
Conclusions Surprisingly, age at onset of treatment has little impact on the likely benefits of interventions that reduce cardiovascular risk because of the opposing effects of life expectancy, case fatality, time preferences and competing risks. These findings challenge the appropriateness of recommendations to use lower risk-based treatment thresholds in younger patients.
This is an open-access article distributed under the terms of the Creative Commons Attribution Non-commercial License, which permits use, distribution, and reproduction in any medium, provided the original work is properly cited, the use is non commercial and is otherwise in compliance with the license. See: http://creativecommons.org/licenses/by-nc/2.0/ and http://creativecommons.org/licenses/by-nc/2.0/legalcode.
Statistics from Altmetric.com
Article summary
Article focus
Short-term cardiovascular risk scores have been criticised as being biased towards treatment of older patients and for leading to delayed treatment in younger patients.
The fundamental question remains as to whether there is a true difference in potential life years lost for patients of different ages but with the same short-term cardiovascular risk.
We used mathematical models to compare the potential life years lost for a 5-year treatment delay versus no delay obtained for patients at different ages but at the same short-term coronary heart disease (CHD) risk. These models incorporate age-specific case fatality rates, competing risks and time preference.
Key messages
Patient age at onset of treatment will have little impact on the likely benefits of interventions that reduce cardiovascular risk.
This is because of the opposing effects of life expectancy, case fatality, time preferences and competing risks.
These findings challenge the appropriateness of recommendations to use lower risk-based treatment thresholds in younger patients.
Strengths and limitations of this study
Two different models were used and the results corroborate. Neither relies on the use of a particular risk score.
The models only accounted for life years lost due through death and not quality of life lost due to non-fatal events. As the severity of non-fatal events also increases with age, the direction of the findings would likely be similar if these events were included.
Only case fatality rates for CHD were used in the models as relevant data for total cardiovascular disease were not available. The results are unlikely to change with the addition of cerebrovascular disease as 5-year case fatality rates by age are similar for CHD and stroke.
Introduction
A common criticism of using short-term (eg, 5- or 10-year) cardiovascular disease (CVD) risk calculators is that they strongly favour treating older individuals who generally have high short-term risk but lower life expectancy.1–3 Intuitively, a young person at the same short-term CVD risk as an old person would appear to lose more in terms of life years simply because of their longer life expectancy. The dilemma is brought into sharpest focus when we consider patients at the same short-term risk but of different ages. Given a predicted CVD risk, of say 20% in 10 years, who stands to gain more from treatment: the young or the old patient?
This apparent limitation of short-term CVD risk prediction may explain the increasing interest in models that attempt to redress the perceived imbalance towards treating older people, such as lifetime CVD risk prediction models.3 4 These models are promoted as being better at identifying individuals who do not reach the recommended treatment threshold using standard 5- or 10-year risk calculators5 but have an increased relative risk (RR) of CVD compared with their peers: mainly young men with multiple but modestly increased risk factors.3 It has been proposed that these individuals, who are at low 10-year risk but high lifetime risk, should be started on treatment.
Experts, however, have questioned the use of such approaches in clinical practice.6 7 It is true that older people have a shorter life expectancy than the young but they also have higher case fatality rates after a cardiovascular event.8 The case fatality rates from other competing risks, that is, non-CVDs, are also higher with increasing age. The consequences of using lifetime risk assessment would mean that larger numbers of young asymptomatic individuals would be expected to take drugs every day for many years, potentially causing short-term harm, in order to prevent or delay an event occurring in the far-off future. Indeed, the lifetime risk approach may not accurately represent the decisional issues as it ignores three important factors: age-specific case fatality rates, competing risks and ‘time preferences’ that value the near future over the distant future.
This study addresses the fundamental question: is there a true difference in potential life years lost for patients of different ages but with the same short-term cardiovascular risk? If there is no difference, then attempts to correct the perceived imbalance are unnecessary and will have unintended harmful consequences. In this paper, mathematical models were used to quantify the size and direction of any differences in losses of young and old patients at identical short-term risks of CVD. These models incorporate the factors of age-specific case fatality rates, competing risks and time preference.
Methods
In order to answer the question of whether the young and old should be treated differently, a comparison of potential life years lost for a 5-year treatment delay versus no delay is obtained for patients at different ages but at the same short-term coronary heart disease (CHD) risk. This simulates a scenario where two patients—one young and the other old—present with identical absolute CHD risks; does one patient suffer greater potential life year loss from a 5-year treatment delay than the other?
Figure 1 illustrates the method used to address the study question. First, the life expectancy is calculated for a person in the age group 35–39 at a specified 5-year CHD risk (for example, 10%) who remains untreated (top arrow). Next, the life expectancy of a person of identical age and risk is estimated but with the CHD risk for the first 5 years reduced to zero (the hypothetical treatment is assumed to be 100% effective—second arrow). The difference in life expectancy from the results of both arms gives the potential years of life lost (PYLL) due to a treatment delay of 5 years for that age and CHD risk.
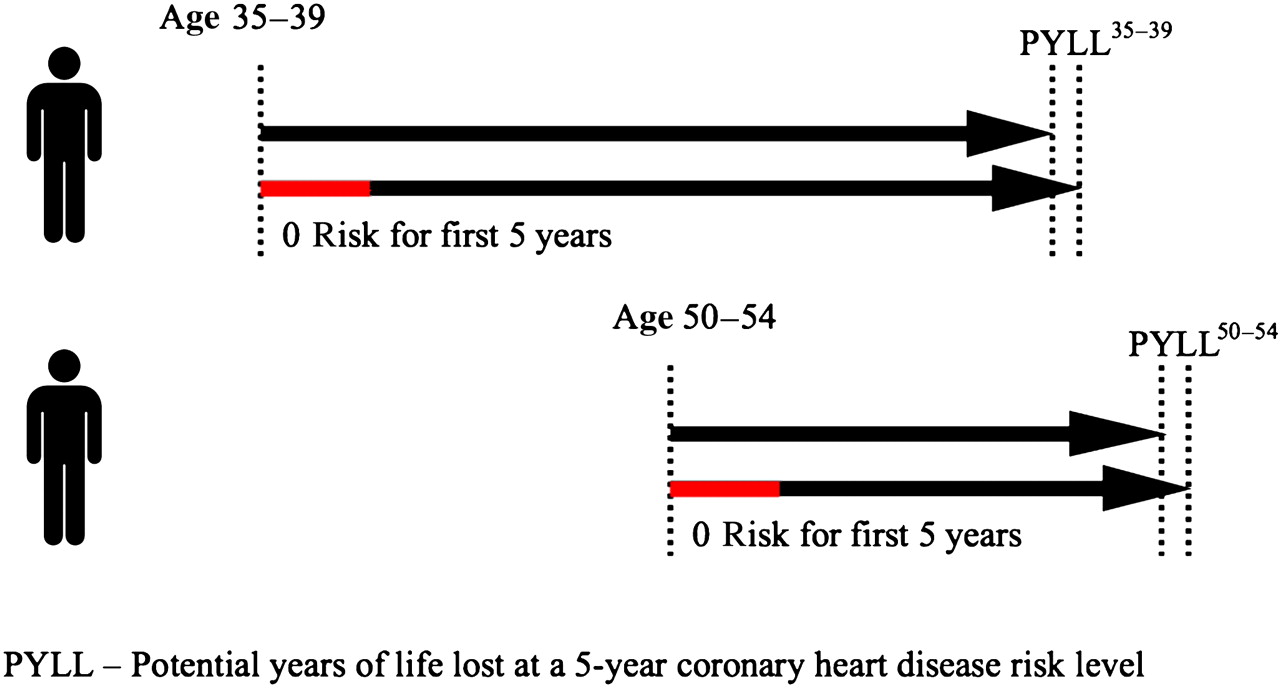
Method used to estimate the potential years of life lost for a 5-year treatment delay in older and younger patients with the same 5-year cardiovascular disease risk. Arrows indicate life expectancies in those treated from baseline for 5 years (red part of lower arrow for each patient) and those not treated.
Figure 1 also shows how the same process is used to determine the PYLL due to a treatment delay for a person in the age group 50–54 at the same CHD risk as the younger person. The PYLL35–39 can then be compared with the PYLL50–54 to compare the life years lost with treatment delay at different ages but at the same absolute risk level.
The process was repeated for different age groups from age 35 to 85. This allows the graphical comparison and detection of trends of losses due to treatment delay at different ages but at the same specified absolute risk level.
Treatment is assumed to be 100% effective. While this will exaggerate the absolute effect of treatment, it provides a valid relative comparison of the PYLL for a treatment delay of 5 years at different ages and at different risk levels. The difference of 100% effectiveness applies to all strategies, so it ‘overestimates’ equally for all; it would give the same relative results if a 30% or 50% reduction was used.
Two different modelling approaches (age-based residual life expectancy models and Markov simulation cohort models) are used to determine the PYLL by not initiating treatment earlier in patients with the same 5-year CHD risk but at different ages. Five-year risk levels of 5% and 10% were selected, as they are approximately equivalent to 10-year risks of 10% and 20%—the key thresholds in UK and European guidelines.9 10
Sensitivity analysis was conducted by the use of two different models and various time preference rates.
Age-based residual life expectancy model
In this model, the hypothetical treated cohort has a zero risk of CHD death during the 5-year treatment period, returns to the average risk of the general population at 5 years and then uses the average further life expectancy (beyond the 5 years) for the population to calculate the PYLL. The calculation was done with and without a time preference rate to account for the increasingly lower value that patients currently give to life years further out into the future. The preference rate accounts for both the uncertainty surrounding future events (‘risk aversion’) and the natural preference for present gratification as compared with future benefit (time preference). A positive time preference rate is placed on later years, meaning that the further it is in the future, the smaller the value of that life year.11 12
The formula for life expectancy with time preference is13
The PYLL due to being exposed to a set CHD risk level at different ages was then calculated using the following formula:
Markov simulation cohort
As with the first (age-based residual life expectancy) model, the hypothetical treated cohort in the Markov model has a zero CHD mortality risk during the 5-year treatment period. However, in contrast to the first model, the Markov model subsequently differentiates between the ongoing competing risks of death, CHD and non-CHD, of both the treated and untreated hypothetical cohorts.
The Markov model calculates the life expectancy of simulated cohorts with 100 hypothetical people for 5-year age groups starting from 35 (ie, 35–39, 40–44, etc). The cohorts were modelled with a base CHD risk of 5% in 5 years, and the process was repeated using a base CHD risk of 10% in 5 years. All the cohort members start in the ‘well state’. The length of each cycle is set at 5 years. In every cycle, we calculate the numbers who die due to CHD (starting with the base CHD risk specified and age-specific myocardial infarction (MI) case fatality rates15) and those due to non-CHD using non-CHD case fatality rates.16 17 Non-CHD rates were derived from the Office of National Statistics on UK death registrations by age, sex and underlying cause and population estimates for 2007.16 17 We used the RR of CHD per year of increasing age (RR=1.05 for men and RR=1.04 for women) as given by the Framingham study18 to calculate the increase in CHD risk in each cycle. The process is repeated, moving more and more members into the ‘dead state’, until the cycle sum falls below 1 person-cycle where every member is dead.19 The life expectancy of the cohort is obtained by adding up the number of person life years in the ‘well’ column. For the same age band, we repeat the process using the same rates except that for the first cycle, the CHD risk is reduced to 0. The potential life years lost for one person is then calculated by the following formula:
This, in effect, allows the results of the simulation to be comparable to the first method.
We then applied a time preference rate with half cycle correction to the Markov simulation cohort model. The Markov simulation cohort assumes that transition from one state to another occurs between cycles and that the number of participants in each state remains stable during the cycle. If membership of the cohort is counted at the beginning of the cycle, this leads to overestimation of the life expectancy of the cohort. If counted at the end of the cycle, there is underestimation of the life expectancy of the cohort. To correct this, a half cycle correction is employed whereby transition is assumed to occur halfway through the cycle.19
Results
Using a time preference rate of 0.03, the life expectancies for different age groups were obtained as shown in table 1. Figure 2 shows the PYLL with and without using the time preference rate of 0.03.
Estimates of life expectancy, UK; without time preference (r=0) and with a time preference rate (r=0.03)

Potential years of life lost (PYLL) for men at 5-year 5% coronary heart disease risk—with and without time preference.
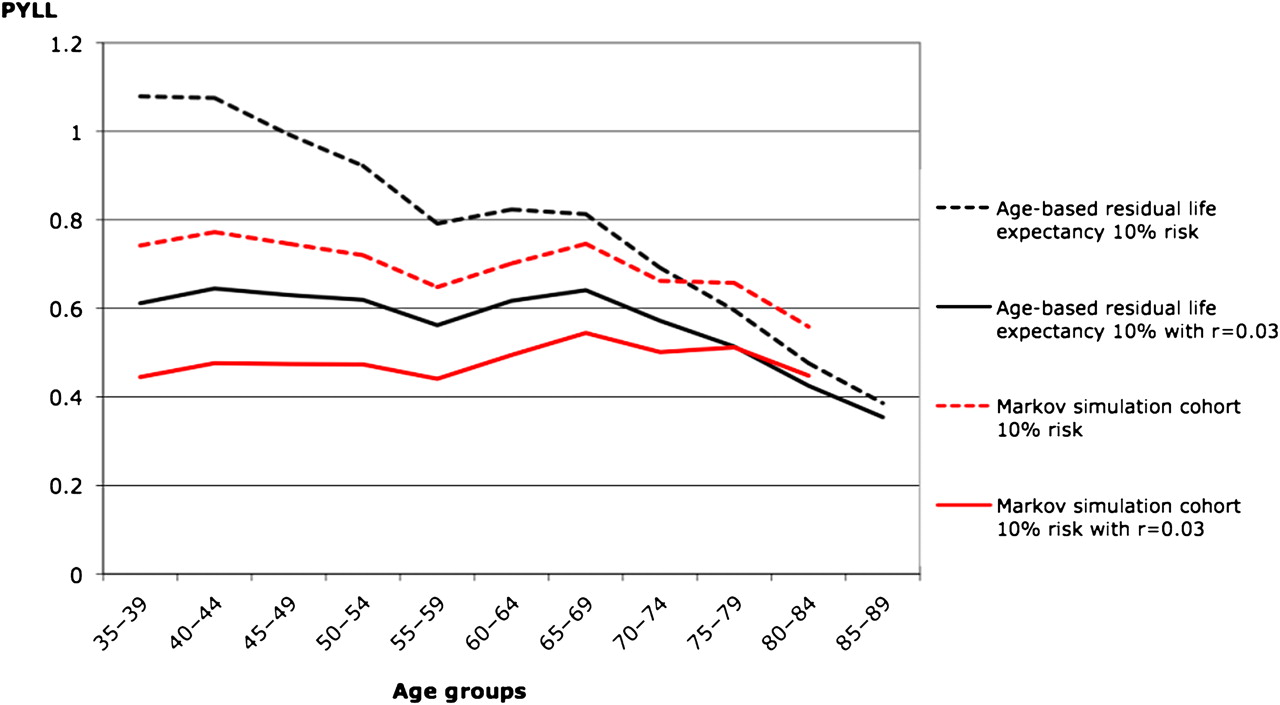
Figures 2 and 3 show the results obtained from both models. The black lines represent the age-based residual life expectancy models and the red lines represent the Markov models. The dotted lines indicate the results of the models without time preference and the solid lines for those with time preference.
Potential years of life lost (PYLL) for men at 5-year 10% coronary heart disease risk—with and without time preference.
The PYLL from delaying treatment by 5 years for different ages for both the 5% and 10% 5-year CHD risk levels can be read from the graphs. For example, the results show that for a treatment delay of 5 years, the PYLL over a lifetime for a 35–39-year-old person at 10% 5-year CHD risk is slightly >1 year in the age-based residual life expectancy model and 0.75 year in the Markov model when time preference is not taken into account.
As expected, the PYLL is higher for all models at 10% risk compared with that for 5% risk.
The estimated PYLL in the age-based residual life expectancy model without time preference for the cohorts with both 5% and 10% 5-year CHD risk has a downward slope with increasing age, indicating that younger age groups have more potential life years to lose than older age groups at the same CHD risk level. Although this appears quite steep, the actual difference is only a maximum of about 0.70 years (8.5 months) in the 10% risk model. Moreover, in the Markov model, which accounts for competing causes of death in addition to the age-specific case fatality rates, the maximum difference in PYLL between the youngest and oldest age categories reduces to about 0.20 years (2.5 months).
With the application of a minimal (3%) time preference rate, the difference in PYLL almost disappears for the age-based residual life expectancy model in the age range from 35–39 to about 70–74 years. In the older age groups (over about 75 years), the time preference adjustment has a minimal effect.
When time preference is incorporated into the Markov model, there is some indication of an upward trend in PYLL with increasing age from the age groups 35–39 to 65–69. This suggests that when increasing case fatality with age, time preference and competing risks are considered, there is no difference in PYLL from delaying treatment for 5 years, for men at different ages with the same CHD risk.
The analysis was sensitive to the time preference rate used, though for typical rates the PYLL was similar at different ages. The sensitivity analysis also showed that an increase in time preference rate would actually increase the PYLL at older age groups.
Discussion
Statement of principal findings
Clinicians are increasingly being advised to use short-term CVD risk prediction tools to help determine the effects of multiple risk factors on their patients' risks of developing CVD and to help weigh the benefits and costs of starting treatment in individual patients. Intuitively, short-term risk prediction does not appear to acknowledge that younger people have a longer life expectancy and would lose more years of life following a CVD event than older people who have a shorter life expectancy. However, our findings suggest that the additional benefit to life expectancy by preventive therapy in younger compared with older patients is counterbalanced by a number of opposing factors.
First, younger patients have lower case fatality rates. That is, in younger individuals with the same short-term CVD risk as older individuals, fewer will die from the event and only those few who do die will lose any life years.
Second, older individuals also face increasing risks of other causes of death that ‘compete’ with their CVD risk. In other words, for a given estimated 5-year CVD mortality risk, older people are more likely to die of another cause than younger people. This effect is illustrated by the difference between the results of the age-based residual life expectancy model, which does not account for competing risk, and the Markov simulation cohort method, which does.
Finally, each of the ‘potential life years lost’ is not considered as equal by patients. A life year in the far-off future is unlikely to be valued as much as one in a near future, especially when there exist the possibility of harm and other immediate costs due to the intervention. Balanced treatment decisions should therefore account for how people value future events. We have done this by modelling a time preference rate. We used a time preference rate of only 3% and even this minimal rate had a major effect on the potential life years lost; for the same cardiovascular risk, there is little difference in potential life years lost at different ages.
These findings suggest that models that do not take the factors of case fatality rates, time preference and competing risks into account will overestimate the benefits of treatment in younger patients and may possibly underestimate the benefits in older people.
Strengths and weaknesses of the study
This study suggests that there is little difference in the potential life years lost by delaying treatment in younger compared with older patients who have the same estimated short-term cardiovascular risk. Two different methods were used and the results corroborate. Neither method relies on the use of a particular risk score, meaning that the findings are applicable across a wide range of risk.
A potential limitation of this study is that both methods only took into account life years lost through death and not quality of life lost as a result of non-fatal events. However, the severity of non-fatal events is also likely to increase with age, so it is unlikely that including non-fatal events in the models would change the direction of the findings. Moreover, there is no robust evidence on the impact of CVD events on the quality of life at different ages and therefore we considered it unlikely that the added number of assumptions required and increased complexity of analyses would generate more meaningful conclusions.
The complexity of the models could have been increased by including multiple disease states. For example, a ‘post-CHD’ state could have been added to the three states included (ie, ‘well’, ‘CHD death’ and ‘non-CHD death’) as those who survived an event would have a higher than normal risk of CHD and death. Other states were also options; for example, the model could have incorporated states of post double or triple CHD events, different types of events such as heart failure and so on. However, all models are approximations and the models used here allow a satisfactory differentiation between the young and old with minimal bias. The addition of other states would necessitate greater assumptions, which would increase complexity but not necessarily the accuracy as additional bias and uncertainty is also increased.
Also, the models did not take account of case fatality rates from cerebrovascular disease (only CHD case fatality was used) as we were unable to find case fatality rates for total CVD for the UK population data used by our models. However, a study in New Zealand20 and another from Sweden21 showed that the 5-year case fatality by age is similar for definite MI, other CHD and stroke. Hence, the addition of cerebrovascular disease, that is, stroke, is unlikely to cause a significant change in our results.
Strengths and weaknesses in relation to other studies, discussing particularly any differences in results
The QRISK group in the UK has recently developed a lifetime CVD risk calculator. Using a threshold of >50% lifetime risk of CVD disease, over half of men identified as being at high risk were in the youngest age group (30–44 years of age). In women, over one-third were in this age group.3 The authors presented several case studies that raised concerns about the clinical usefulness of lifetime risk and stated that they were uncertain whether using such an approach was appropriate for treatment decisions. Yet recent media articles have suggested new national UK guidelines will change from advocating the use of 10-year risk to lifetime risk calculators in clinical practice.7
In Norway, a different approach has been adopted where thresholds for treatment are different for different ages. For those aged 40–49 years, the threshold is set at a 10-year risk of CVD death of 1%, whereas for those aged 60–69 years, it is set at 10%. The new recommendations are based on a Markov model, which showed that more life years were gained using age-differentiated thresholds. Their model adjusted for the increase in case fatality rates with age but did not account for time preference or competing risks.22
This is a cause for concern given that our study demonstrates that the adoption of approaches such as these that seek to redress the issue of age in short-term risk scores overestimate the CVD in younger people and lead to a substantial (and unnecessary) increase in the number of young people on medication.
Montgomery et al23 used simulation models to estimate the effectiveness and cost-effectiveness of blood pressure-lowering treatment over a lifetime. One of their objectives was to compare the increase in life expectancy from treatment at different ages. This appears to be similar to our objective—they measured gains from treatment, while we examined losses from treatment delay. However, their model evaluated lifetime treatment versus lifetime non-treatment. Our models sought to answer the impact of only a 5-year delay. This is a crucial difference. The young person who presents at one point in time with a cardiovascular risk score that is higher than average for his age group will be monitored and assessed again at a future point in time. This will mean that he is likely to receive treatment as he ages. Therefore, to compare treatment and no treatment for a lifetime is not a clinically relevant comparison.
The ‘low-’ and ‘high-risk’ profiles used in the Montgomery model are also based on age-specific mean values for systolic blood pressure and centile values for other risk factors. As the values used are age specific, it is likely that the absolute risk category for the young and old are different, that is, the low-risk elderly is likely to have overlapping absolute risk with the high-risk young in the model. The differentiation of absolute risk by this method would be smaller in the older age groups and bigger in the younger age groups resulting in a reduction of gains in life expectancy with treatment as age increases. This would account for the greater gains in life expectancy seen in the young compared with the old in their paper.
Meaning of the study: possible mechanisms and implications for clinicians or policymakers
Our findings show that there is minimal difference in potential life years lost from delaying treatment for 5 years in younger and older patients when important and objective factors such as case fatality rates and competing risks are considered. When a time preference adjuster is also added, the difference is largely abolished. This suggests that the use of models that preferentially treat younger over older patients would mean that a number of low-risk individuals would be exposed to long-term medication with questionable benefits and an even greater number of those in older age groups would not be offered preventive treatment and could go on to develop preventable CVD.
Unanswered questions and future research
In examining the use of CVD risk for young versus old patients, we have only addressed the issues of age-specific case fatality rates, competing risks and time preference. However, there are other factors that clinicians and patients may consider when making treatment decisions based on CVD risk. Both the frequency and impact of adverse effects may differ between young and old. The older people may also have a different attitude to mortality and may consider the mode of death as well as the timing of death. Further research is needed to address the impact of these issues on the use of CVD risk in cardiovascular risk management.
Conclusions
When case fatality rates, competing risks and time preference are taken into account, there appears to be minimal differences in the potential life years lost from experiencing a CVD event among patients of different ages but the same short-term cardiovascular risk. These factors need to be considered when assessing the potential impact of future CVD events in patients of different ages.
References
Supplementary materials
Supplementary Data
This web only file has been produced by the BMJ Publishing Group from an electronic file supplied by the author(s) and has not been edited for content.
Files in this Data Supplement:
- Data Supplement - Manuscript file of format pdf
- Data Supplement - Manuscript file of format pdf
Footnotes
To cite: Liew SM, Jackson R, Mant D, et al. Should identical CVD risks in young and old patients be managed identically? Results from two models. BMJ Open 2012;2:e000728. doi:10.1136/bmjopen-2011-000728
Contributors All authors conceived the original idea. SML collected data, designed and analysed the models and drafted the manuscript. PG contributed in the design and analysis of the models. All authors contributed to the interpretation of the findings, reviewed and approved the final manuscript. All are guarantors.
Funding This research received no specific grant from any funding agency in the public, commercial or not-for-profit sectors.
Competing interests None.
Provenance and peer review Not commissioned; externally peer reviewed.
Data sharing statement No additional data are available.