Article Text

Abstract
Objective To investigate the effects that prevalence has on the diagnostic performance of junior doctors in interpreting x-rays.
Design Two-armed cross-sectional design using systematic sampling.
Setting Emergency department in the UK.
Participants From a sample of 2593 patients (1434 men and 1159 women) taken from an unselected attending cohort between January and April 2002, 967 x-rays were analysed. The sex distribution was 558 men and 409 women, and the mean age of those receiving an x-ray was 34.6.
Interventions The interpretation of x-rays by junior doctors after their triage into high- and low-prevalence populations by radiographers.
Main outcome measures Sensitivity, specificity, likelihood ratios, diagnostic odds ratios and receiver operator characteristic curve.
Results There were statistically significant differences in the performance characteristics of junior doctors when interpreting high-probability and low-probability x-rays. For the high- and low-probability populations, respectively, the sensitivities were 95.8% (95% CI 91.1% to 98.1%) and 78.3% (95% CI 65.7% to 87.2%) and the specificities were 56.0% (95% CI 41.9% to 69.2%) and 92.3% (95% CI 90.0% to 94.2%). Hierarchical logistic regression showed that the sensitivity did depend on the type of x-ray being interpreted but the diagnostic odds ratios did not vary significantly with prevalence, suggesting that doctors were changing their implicit threshold between the two populations along a common receiver operator characteristic curve.
Conclusions This study provides evidence on how the prevalence may affect the performance of diagnostic tests with an implicit threshold and potentially includes the clinical history and examination. This has implications both for clinicians applying research findings to their practice and the design of future studies.
This is an open-access article distributed under the terms of the Creative Commons Attribution Non-commercial License, which permits use, distribution, and reproduction in any medium, provided the original work is properly cited, the use is non commercial and is otherwise in compliance with the license. See: http://creativecommons.org/licenses/by-nc/2.0/ and http://creativecommons.org/licenses/by-nc/2.0/legalcode.
Statistics from Altmetric.com
Article summary
Article focus
The sensitivity, specificity and likelihood ratios of a diagnostic test are often assumed to remain constant even when the prevalence (pre-test probability) of disease changes.
There is a lack of research in the literature on the effects that the prevalence has on the performance of diagnostic tests particularly those tests with implicit thresholds such as when doctors interpret x-rays.
This study investigates the effects that prevalence has on the diagnostic performance of junior doctors in interpreting x-rays.
Key messages
This study provides empirical evidence that the sensitivity, specificity and likelihood ratios may change with prevalence in diagnostic tests that require subjective interpretation, as in the case of junior doctors examining x-rays.
The most plausible explanation for the effect seems to be doctors modifying their threshold for an abnormal diagnosis based on the results of previous tests.
These results suggest that likelihood ratios and other test accuracy statistics derived from clinical studies have the potential to be misleading when applying them in practice.
Strengths and limitations of this study
The study models a large data set collected from a real-life clinical setting and is representative of everyday clinical practice.
The findings are likely to extend beyond the clinical tests analysed here.
There is a potential for review bias owing to a lack of blinding between the test and reference standard.
Introduction
It is convenient in the assessment of diagnostic tests to divide the study population into two disjoint subpopulations consisting of those with disease and those without. Leading from this observation, many authors have asserted that performance characteristics, such as the sensitivity and specificity, which are derived from one or other of these populations but not both, are independent of the prevalence of disease.1–4
This assertion has been questioned by some authors,5–8 and circumstances in which a change in prevalence may affect the sensitivity and specificity have been described.5 6 A Bayesian approach to diagnostic medicine relies on the reported values of the sensitivity, specificity and, hence, likelihood ratios being reproducible in practice. For the evidence-based clinician hoping to apply likelihood ratios reported in published studies to their practice, the potential for them to vary with the prior probability could have a profound effect on the reliability of applying diagnostic test research.
Despite its potential importance, currently there are few studies6 8–13 which have considered the effects of prevalence on a test's performance. Ideally, this would be demonstrated by a study design, which has at least two arms, where prior testing has modified the pre-test probabilities so that they are different for each arm, before the test under investigation is applied. There are instances where this has been done for diagnostic tests, which have an explicit (fixed) threshold for a positive result.14–16
By contrast, in tests which have an implicit threshold, such as examining an MRI scan, the operator sets the level of the threshold, usually based on prior training and experience, but potentially in response to prior test results. This latter point seems to have received little attention in the literature. While there are examples of studies which have evaluated the performance of tests combined sequentially,17–20 due to limitations in design,17–20 the effect that each of the different outcomes of a test may have on the performance of a subsequent test has rarely been estimated.21 22
To help address this, the example used here investigates the effect the pre-test probability has on the performance of junior doctors in interpreting plain x-rays in an emergency department (ED) setting, before considering the implications for similar diagnostic tests. This study was part of a larger investigation, which has been published elsewhere.23 Although the data were collected in 2002, the lack of research in this area and the continuing relevance of the findings underline the importance of research in this field. Note that pre-test probability and prevalence are used interchangeably.
Method
Between January and April 2002, systematic sampling was used to collect data on an unselected attending cohort of patients at the ED of the Horton Hospital in the UK.
All patients seeing an ED junior doctor underwent a clinical examination to determine whether treatment or further investigation was necessary. As part of their evaluation, some patients were required to have an x-ray, where the type of x-ray received depended on the results of the clinical examination.
Before the junior doctors viewed any x-rays, they were first interpreted then triaged, on the basis of their findings, by one of the departmental radiographers (radiologic technologists). Thus, those x-rays considered abnormal or ‘high-probability’ x-rays were marked with a red dot by the radiographer otherwise they were left unmarked. All the radiographers had received in-house training in interpreting x-rays.
Each x-ray was then interpreted by one of the ED junior doctors (each with similar training of at least 1-year experience post-qualification). All x-rays were then verified by a radiologist and this was the reference standard.
The data collected included the date, patient's age, x-ray type (eg, scaphoid), radiographer's triage result, junior doctor's diagnosis and reference diagnosis. The x-rays were classified by the part of the body irradiated (x-ray type), such as chest x-rays.
Features considered abnormal on an x-ray depended on the x-ray type and included fractures (skeletal x-rays), cardiomegaly (chest x-rays) and dilated bowel (abdominal x-rays), thus covering a range of target disorders and are detailed elsewhere.23 In the high-probability (red dot) x-rays, the prevalence of abnormal findings was 77% compared with 13% in the ‘low-probability’ x-rays. Although the junior doctors were aware that a red dot indicated a higher probability of an abnormality, they were not aware of how high this probability was.
Statistical analysis
Two by two tables were derived for each of the high- and low-prevalence subpopulations. The sensitivity, specificity, likelihood ratios and diagnostic odds ratios (DOR) were used for comparison and a receiver operator characteristic (ROC) curve was constructed.1 24–27
While performance statistics, such as the sensitivity and specificity, could be calculated from pooling the data across all the junior doctors, this does not take into account variation in the performances between junior doctors. Furthermore, it does not allow for the effects of the x-ray type on the performances of individual junior doctors.
Hence, a hierarchical logistic regression model27 28 was constructed to study the effects of different covariates on the dependent variables, logit sensitivity and logit specificity. Junior doctors were included in the model as a random effect, and covariates on prevalence, x-ray types and broader groupings of x-ray types were also included.
As any effects of prevalence on performance may be explained by differences in performance across different x-ray types, the interaction between the prevalence and x-ray type was evaluated. Cross-level interactions between explanatory variables were also investigated by allowing the slope to vary across individual doctors. Models were compared using the log likelihood ratio test statistic (LRT), which has an asymptotic χ2 distribution with degrees of freedom (df).27 28 All analyses were completed using the statistical software R, and statistical significance was set at p<0.05. A full description of the model may be found in the online appendix.
The type of x-ray a patient receives is, in part, indicative of their morbidity. Thus, the distributions of x-ray types were inspected to give some indication on whether the mix of patients (or patient-mix) varied between the high- and low-prevalence populations. If some x-ray types are more difficult to interpret than others (such as abdominal x-rays compared with tibial x-rays), then differences in the relative proportions of these may explain differences in the performance characteristics.
Results
There were 1053 x-rays interpreted by 26 ED junior doctors following triage by a radiographer. Eighty-six were excluded due to incomplete information on the radiographers' triage result (28), junior doctors' diagnosis (10) and reference diagnosis (48). The remaining 967 x-rays are analysed in table 1.
Contingency tables showing the summary totals in each of the cells after pooling all the junior doctors
The striking feature of these results is the change in sensitivity, specificity and positive likelihood ratio between the low- and high-prevalence populations (table 2). The differences are statistically significant and provide evidence against the null hypothesis that the performance characteristics of junior doctors at interpreting x-rays do not vary with prevalence.
Summary performance estimates given for the independent significant covariate, prevalence. Also given are the estimates of sensitivity for each level of the covariate x-ray group, which was significant for the dependent variable logit (sensitivity)
In contrast, the DOR for each of the high- and low-prevalence populations were not statistically significantly different, being very close to each other at 37.3 (95% CI 3.6 to 101.3) and 36.1 (95% CI 21.0 to 62.3), respectively. This is consistent with the null hypothesis that the DOR is constant, which has a bearing on the shape of the ROC curve. A common DOR generates a symmetrical ROC curve,24–26 and observing how closely the points are to the curve, this informs a possible cause to the variation in the sensitivity and the specificity, namely a change in the implicit threshold for test positives as applied by the junior doctors (figure 1).

Symmetrical receiver operator characteristic curve (weighted mean diagnostic odds ratios (DOR)) for the average junior doctor. Weighted mean DOR (36.4) was derived from weighting model estimates of DORs for high-prevalence population (37.3) and low-prevalence population (36.1). Point estimates of sensitivity and 1− specificity for both populations are also given.
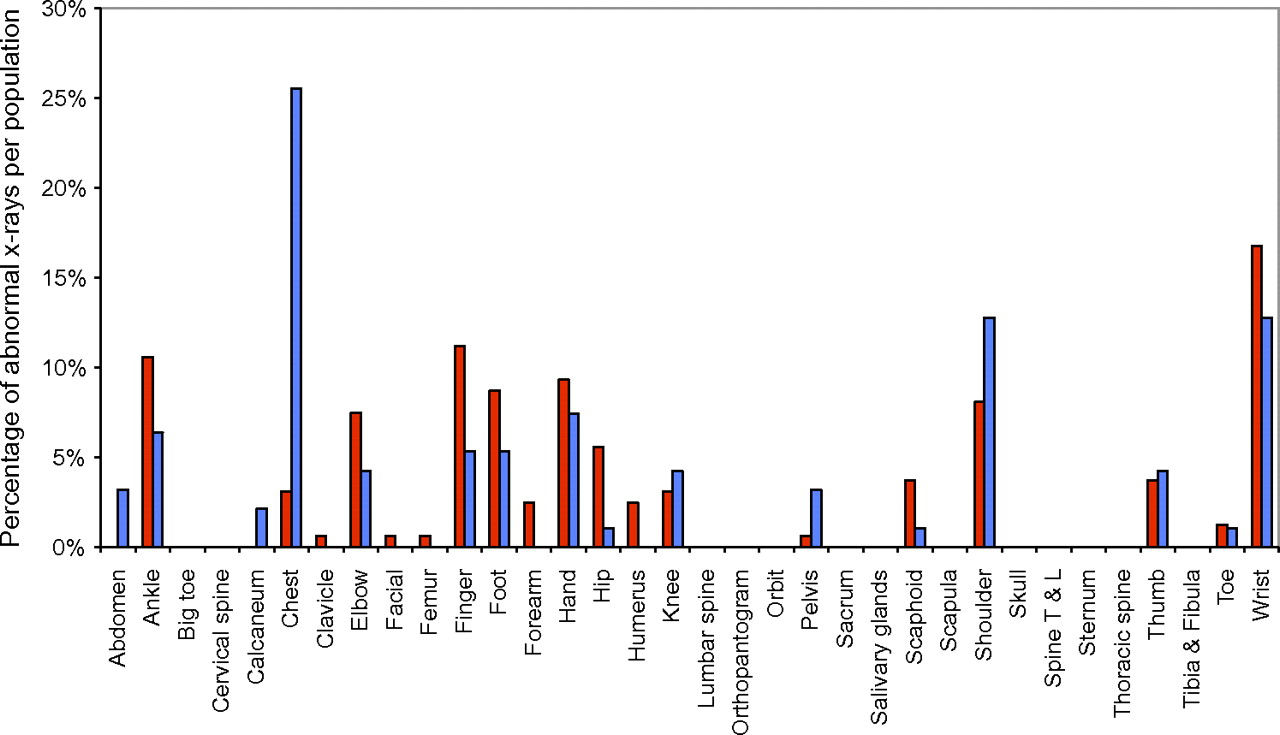
The x-ray distributions for each of the normal and abnormal populations are shown in figures 2 and 3. On inspection, the distributions are broadly similar for the high- and low-prevalence populations in each case, with only chest x-rays being an outlier in figure 3. This would suggest that any differences in performance between the high- and low-prevalence populations are unlikely to be due to differences in the relative proportions of x-ray type.
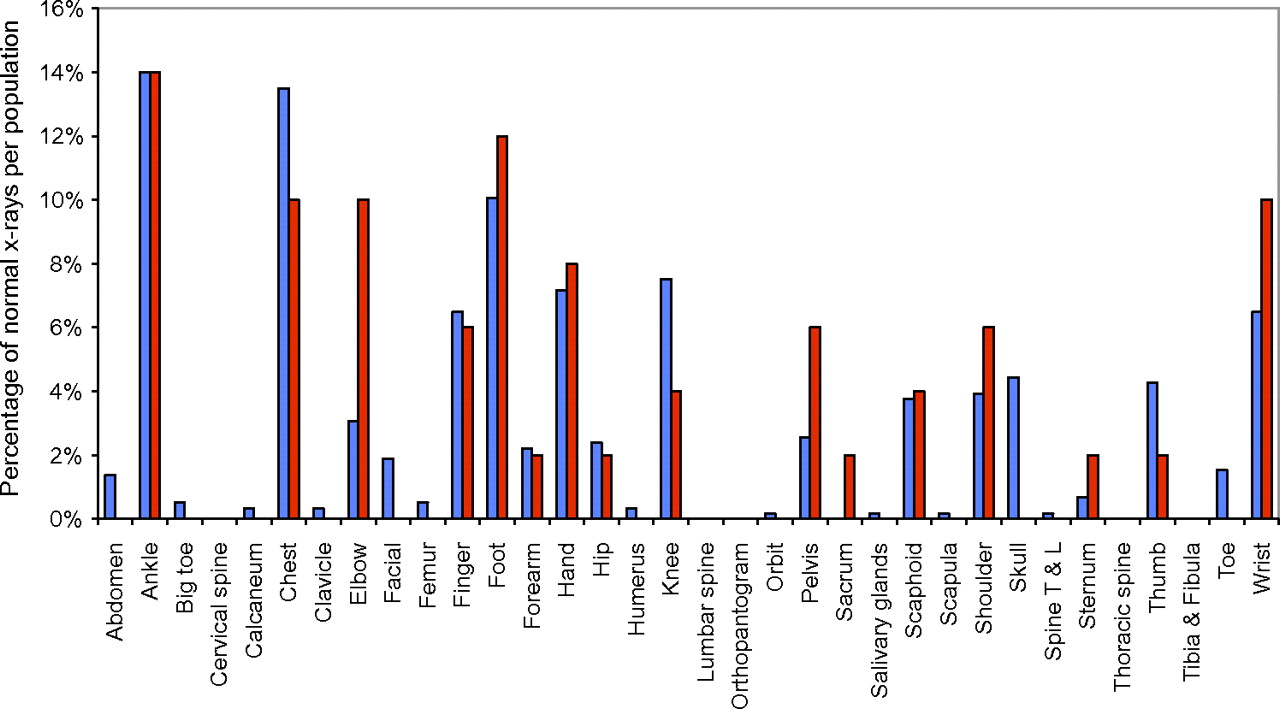
Distribution of x-rays with a normal diagnosis in the two populations: high prevalence (red) and low prevalence (blue). Shown are the percentage of normal x-rays in each population (high or low prevalence), which are of a particular type. For example, 10% of x-rays diagnosed normal in the high-prevalence (red) population were of elbows. Differences in the distributions between the high- and low-prevalence populations could potentially account for differences in the specificity between the respective populations. Note that the normal diagnosis refers to the reference standard diagnosis. T & L, thoracic and lumbar.
Distribution of x-rays with an abnormal diagnosis in the two populations: high prevalence (red) and low prevalence (blue). Shown are the percentage of abnormal x-rays in each population (high or low prevalence), which are of a particular type. For example, 10.5% of x-rays diagnosed abnormal in the high-prevalence (red) population were of ankles. Differences in the distributions between the high- and low-prevalence populations could potentially account for differences in the sensitivity between the respective populations. Note that the abnormal diagnosis refers to the reference standard diagnosis. T & L, thoracic and lumbar.
The effects that the change in x-ray distributions may have on performance between the two subpopulations was modelled using hierarchical logistic regression. Unsurprisingly, prevalence was a significant covariate for each of the dependent variables logit sensitivity (LRT=20.6, df=1, p∼10−5) and logit specificity (LRT=42.8, df=1, p∼10−11).
In contrast, x-ray type was not a significant covariate for either logit sensitivity (LRT=34.4, df=24, p=0.078) or logit specificity (LRT=23.3, df=33, p=0.89). Owing to the number of levels to the factor x-ray type (34), this could be due to insufficient data. Therefore, x-ray types were grouped into three broad mutually exclusive groups: skeletal x-rays that were subdivided anatomically into appendicular (limbs, hands and feet) and axial (skull, facial and spine)29 and soft tissue x-rays (chest and abdomen). The x-ray group was a significant independent covariate for logit sensitivity (LRT=10.88, df=2, p=0.0043) but not for logit specificity (LRT=2.74, df=2, p=0.26) (table 2). However, interaction terms between prevalence and x-ray group and across levels between x-ray groups and junior doctors were not significant for either dependent variable.
As chest x-rays were a potential outlier (figure 3), a sensitivity analysis was performed to investigate the effects of this category on the statistical significance of covariates, by including and excluding this category from the model. No significant effects were found.
Discussion
This study demonstrated statistically significant differences in the sensitivities, specificities and positive likelihood ratios between the high- and low-prevalence populations (table 2), providing evidence that the diagnostic performance of junior doctors in interpreting x-rays does vary with prevalence. There was evidence that the sensitivity depended on the x-rays being interpreted, and although such dependence could not be demonstrated for individual x-ray types (due to sample size), it was demonstrated for broader categories of x-rays. Since the x-ray type is an indicator of the type of target disorder and therefore patient, this implies that the diagnostic performance does depend to some degree on both the type of x-ray being interpreted and the target disorder being sought.
However, this was an independent effect: analysis of the interaction between prevalence and x-ray group was not significant. The effect of the junior doctors' performance varying with prevalence occurred irrespective of the type of x-ray being interpreted or target disorder being sought. Although performance was evaluated over different types of x-rays and multiple target disorders, these findings suggest the potential of observing such prevalence effects when only a single target condition is of interest.
Given there was insufficient evidence to reject the hypothesis of a common DOR and considering the closeness of the (sensitivity, 1− specificity) pairs to the ROC curve (figure 1), the doctors' performance seems to change along a single symmetrical ROC curve. This is consistent with the junior doctors changing their implicit threshold for an abnormal diagnosis on the basis of the radiographer's triage result. This does seem plausible when it is noted that the doctors both had knowledge of the previous test's (radiographer's triage) results and could change their subjective threshold for a positive test result on the basis of this information. It is possible that this latter point was amplified by the relative lack of experience in the participating doctors, with more experienced clinicians being expected to exhibit such threshold effects to a lesser degree. Clearly, this study does not answer this latter point.
Other explanations are still possible: the ROC curve may not be unique or symmetrical24–26; differences in the patient spectrum between the two populations may affect the different performance characteristics observed.30 31 For instance, the initial triaging by the radiographers into high- and low-probability x-rays is dependent on their ability to spot abnormal features. Severe cases, where the abnormal features are more striking, are more easily identified and more likely to be allocated to the high-prevalence (probability) population. Thus, the differences in performance between the high and low populations could be a reflection of differences in severity.
This cannot be discounted and almost certainly explains part of the effect of the prevalence on performance. However, the circumstantial evidence in favour of junior doctors changing their implicit threshold seems more extensive, suggesting that this is likely to be the most important factor.
The question that is raised by this example is whether the effects observed may be generalised to other diagnostic tests? An example where these may occur is in the dynamic process of taking a clinical history or examining a patient, where information from previous tests such as the response to a particular question is available to inform future tests. During this process, the clinician may adjust their threshold for a positive result on the basis of the previous test results. The strength of expectation generated by the previous test results is likely to play a role in how far the clinician adjusts this threshold. Thus, a sequence of four positive responses to directed questions in a history might influence a clinician to lower their threshold for the next question, thereby increasing the sensitivity and decreasing the specificity, compared with if the four previous responses had been negative.
In this study, the test was evaluated in two separate subpopulations in which the main difference was the prevalence of abnormality. This has obvious advantages over two separate studies by controlling for a number of factors that may affect the test performance: the same junior doctors, same radiographers, same reference standard and similar patient-mixes.
Nonetheless, there are two principal limitations relating to the quality of the reference standard (a single radiologist's opinion) and a lack of blinding between the test and the reference standard, raising the potential for review bias.32 It is difficult to gauge the effect a lower quality reference standard would have on performance estimates, but it is unlikely to have a differential bias between the high- and low-prevalence populations. Equally, the effects of review bias are likely to inflate estimates of the sensitivity and specificity in both the high- and low-prevalence populations and given it is differences between these performance statistics that are important to demonstrate the principle, inflated estimates in both subpopulations are less of a problem.
In the regression model, the sensitivity and specificity were treated as independent variables. A bivariate random effects model would maintain the association between the sensitivity and specificity, and individual patient data models have been suggested.33 While such advanced approaches may augment the analysis, they would not change the broad findings demonstrated here.
In summary, the diagnostic performance of junior doctors in interpreting x-rays does vary with pre-test probability and this seems to be predominantly based on changing the implicit threshold in response to previous test results. Furthermore, it is unlikely that these findings are confined to the example analysed here. As such, it is an area deserving of further research to establish the extent by which it affects those tests in which there is a subjective element in the execution of the test.
Acknowledgments
I would like to thank Dr Shyamaly Sur, MRCOG, in helping collect some of the original data for the study, Professor Chris Hyde, FFPHM, Professor Aneez Esmail, PhD, and Professor Graham Dunn, PhD, for comments on the manuscript. I had full access to all of the data in the study and take responsibility for the integrity of the data and the accuracy of the data analysis.
References
Supplementary materials
Supplementary Data
This web only file has been produced by the BMJ Publishing Group from an electronic file supplied by the author(s) and has not been edited for content.
Files in this Data Supplement:
- Data Supplement - Manuscript file of format pdf
- Data Supplement - Manuscript file of format pdf
- Data Supplement - Manuscript file of format pdf
- Data Supplement - Manuscript file of format pdf
- Data Supplement - Manuscript file of format pdf
- Data Supplement - Manuscript file of format pdf
Footnotes
To cite: Willis BH. Empirical evidence that disease prevalence may affect the performance of diagnostic tests with an implicit threshold: a cross-sectional study. BMJ Open 2012;2:e000746. doi:10.1136/bmjopen-2011-000746
Contributors BHW conceived the study, interpreted the data and wrote this manuscript.
Funding This research received no specific grant from any funding agency in the public, commercial or not-for-profit sectors. The author was in receipt of a Medical Research Council fellowship during the conduct of this study.
Competing interests The author has completed the Unified Competing Interest form at http://www.icmje.org/coi_disclosure.pdf (available on request from the corresponding author) and declares that (1) BHW had support from a Medical Research Council fellowship during the conduct of this work, (2) has no relationship with any companies that might have an interest in the submitted work in the previous 3 years, (3) spouse, partner or children have no financial relationships that may be relevant to the submitted work and (4) have no non-financial interests that may be relevant to the submitted work.
Provenance and peer review Not commissioned; externally peer reviewed.
Data sharing statement No additional data are available.