Article Text

Abstract
Objective To explore the feasibility of producing small-area geospatial maps of chronic disease risk for use by clinical commissioning groups and public health teams.
Study design Cross-sectional geospatial analysis using routinely collected general practitioner electronic record data.
Sample and setting Tower Hamlets, an inner-city district of London, UK, characterised by high socioeconomic and ethnic diversity and high prevalence of non-communicable diseases.
Methods The authors used type 2 diabetes as an example. The data set was drawn from electronic general practice records on all non-diabetic individuals aged 25–79 years in the district (n=163 275). The authors used a validated instrument, QDScore, to calculate 10-year risk of developing type 2 diabetes. Using specialist mapping software (ArcGIS), the authors produced visualisations of how these data varied by lower and middle super output area across the district. The authors enhanced these maps with information on examples of locality-based social determinants of health (population density, fast food outlets and green spaces). Data were piloted as three types of geospatial map (basic, heat and ring). The authors noted practical, technical and information governance challenges involved in producing the maps.
Results Usable data were obtained on 96.2% of all records. One in 11 adults in our cohort was at ‘high risk’ of developing type 2 diabetes with a 20% or more 10-year risk. Small-area geospatial mapping illustrated ‘hot spots’ where up to 17.3% of all adults were at high risk of developing type 2 diabetes. Ring maps allowed visualisation of high risk for type 2 diabetes by locality alongside putative social determinants in the same locality. The task of downloading, cleaning and mapping data from electronic general practice records posed some technical challenges, and judgement was required to group data at an appropriate geographical level. Information governance issues were time consuming and required local and national consultation and agreement.
Conclusions Producing small-area geospatial maps of diabetes risk calculated from general practice electronic record data across a district-wide population was feasible but not straightforward. Geovisualisation of epidemiological and environmental data, made possible by interdisciplinary links between public health clinicians and human geographers, allows presentation of findings in a way that is both accessible and engaging, hence potentially of value to commissioners and policymakers. Impact studies are needed of how maps of chronic disease risk might be used in public health and urban planning.
This is an open-access article distributed under the terms of the Creative Commons Attribution Non-commercial License, which permits use, distribution, and reproduction in any medium, provided the original work is properly cited, the use is non commercial and is otherwise in compliance with the license. See: http://creativecommons.org/licenses/by-nc/2.0/ and http://creativecommons.org/licenses/by-nc/2.0/legalcode.
Statistics from Altmetric.com
Article summary
Article focus
To explore the feasibility of producing small-area geospatial maps of chronic disease risk for use by clinical commissioning groups and public health teams.
Key messages
Creating small-area geospatial maps of risk of type 2 diabetes is feasible using routinely collected data from electronic general practice records.
Maps complement a traditional statistical approach to public health data, requiring different ways of processing and presenting information.
Such maps may be of use to commissioners and public health planners who seek to make sense of vast amounts of routine health information.
Strengths and limitations of this study
The study uses routinely collected local individual patient data to generate high-quality small-area maps of disease risk across an entire district.
Quality and completeness of the data set from which the geospatial maps were derived was high.
A potential limitation of our study is the uniqueness of the local IT context. In order for the method used here to be successfully reproduced by others, a number of conditions need to be met.
Introduction
Non-communicable disease
Non-communicable diseases—diabetes, cardiovascular disease, chronic respiratory disease and cancers—account for 60% of global deaths.1 Their cumulative financial burden world wide in 2008 was estimated to be US$2.35 trillion, and this burden of disease is projected to greatly increase.2 Almost 350 million people have diabetes, and the number expected to die from this cause is predicted to double between 2005 and 2030.3 In the UK, approximately 4% of the population have diabetes, with 400 new diagnoses every day; 90% are classified as type 2.4
Prevention of non-communicable diseases is essential for long-term reduction in disease burden.5 The 2011 United Nations High Level Summit on Non-Communicable Disease called for a strengthening of national policies and health systems, including information systems for health planning and management to facilitate public health interventions.6
Chronic disease risk, health inequalities and social determinants of health are intimately linked.7–9 The relationship between environmental variables and development of obesity and type 2 diabetes is significant and complex.10 Social and ethnic diversity of urban populations heavily influence chronic disease risk, for example, South Asians are four times more likely to develop diabetes than the white population and more likely to die of complications.11 12 Prevention may be feasible through national, community and individual measures, which may reduce development of diabetes by 0.5%–75%.13–15
Risk prediction of non-communicable disease
Models for predicting risk of developing chronic disease have become more common.16–18 A recent systematic literature review revealed 145 such models for type 2 diabetes, and while some researchers had speculated that their model might be used to identify high-risk sectors of the community for public health interventions, most risk models and scores were being used only in individual clinical encounters (or not at all).19 The QDScore, a risk model designed for use on general practice electronic records, is particularly well suited for producing population-level risk estimates.17
Clinical commissioning of health services
The English National Health Service is undergoing radical restructuring, including transfer of commissioning of clinical and public health services to clinical commissioning groups (comprising general practitioners, secondary care clinicians, nurses and lay members).20 Part of the public health function will shortly be transferred to local authorities, who are traditionally responsible for urban planning and environmental health. Commissioning and local authority bodies will need health information in an easily accessible format in order to plan, procure, monitor, evaluate and coordinate clinical and public health interventions and neighbourhood initiatives.
Geovisualisation
Historically mapping has often been used in a public health context. For example, the well-known maps of cholera cases around Broad Street pump in London in the mid-1800s.21 22 Geovisualisation—the use of computer-aided graphical methods (Geographic Information Systems) to visualise geospatial information23—is a technique which has begun to be used to help guide health service planning, public health interventions and inform the public about disease ‘hot spots’.10 A well-known use of this technique are the maps of obesity produced by the Center for Disease Control in the USA, which have shown higher prevalence in the southern states and a shift in prevalence from low (shown in blue) through high (shown in red) over the past 40 years.24
Geospatial mapping of self-reported questionnaire data has shown the USA to have a ‘diabetes belt’ (ie, a band of states with high prevalence of this condition) in the south-east of the country linked to distribution of the known risk factors of obesity, inactivity, low socioeconomic status and African–American ethnicity.25 Small-area geographical variation in diabetes prevalence has also been mapped in a single city in Canada using research survey data and links demonstrated with the geographical distribution of social and environmental determinants including family income, education, aboriginal status and neighbourhood crime.26 In the UK, small-area mapping of coronary heart disease morbidity and mortality using multiple data sources (eg, hospital admission statistics and mortality statistics) has been linked to social and environmental risk factors (eg, income and ethnicity) and geographical ‘hot spots’ of coronary heart disease demonstrated in localities where these risk factors are clustered.27 Data from a UK population-based register of arthritis have been used to identify geographical clusters of polyarthritis.28
A key aspect of rigour in geovisualisation of disease or risk of disease is the completeness, accuracy, timeliness, accessibility and granularity of the primary data from which the maps are constructed, and in particular, the extent to which the data are capable of illuminating the fine-grained geographical variability needed to inform locality-based health or environmental interventions.
Unlike USA and Canada, the UK has the advantage of near-universal registration with general practitioners, whose records are at an advanced state of computerisation.29 Quality of electronically held data is high in most practices, partly due to a national financial incentive scheme for general practice, the Quality and Outcomes Framework, a component of which is chronic disease management.30 Aggregated data from Quality and Outcomes Framework returns have been used to model estimates of disease prevalence by locality.31
Recent advances in general practice computer systems include remote server ‘cloud’ storage of records, with staff gaining access via the world wide web rather than records held on practice-based servers. This allows authorised staff to undertake complex data searches across large numbers of practices, allowing local general practice records to be used as the data source for sophisticated mapping of disease or risk factors by small geographical area. However, accessing and using personal medical data for this purpose raises significant practical, technical, ethical and information governance challenges.
To our knowledge, there are no previous studies of small-area geospatial mapping of either disease or risk factors using electronic general practice patient records as the data source and oriented primarily to an audience of local health planners. This is important when considering dense urban areas where a street may separate relatively poor and affluent neighbourhoods. Models estimating disease prevalence often show greatest discrepancy between observed and expected prevalence in areas of social complexity, suggesting that small-area mapping may be particularly useful in such areas.32
Using type 2 diabetes as an example, the purpose of this study was to (1) explore the feasibility of producing maps of population risk of chronic disease, calculated from general practitioner electronic record data; (2) link this information with small-area data on putative social and environmental determinants of health and (3) consider the extent to which such information would be useful to clinical commissioners and local authorities engaged in neighbourhood regeneration. A particular focus of this study was to identify the practicalities and information governance hurdles around the secondary uses of general practice data at a time when local general practice led commissioning groups were being established.
Methods
Setting
The study was based in Tower Hamlets, an inner-city district in the East End of London, UK, known internationally for its vibrant street life, restaurants and culture and also for its socioeconomic deprivation and poor health outcomes (eg, unemployment and crime rates are twice the national average, illegal drug use is high, 7% diabetes prevalence is 40% above the national average and mean life expectancy is 7 years lower than in Chelsea, another more affluent district of London, UK).33 Tower Hamlets is home to a large British Bangladeshi population and to more recent migrants from Africa and to a white British working class population. The district includes significant pockets of deprivation, mainly in high-rise estates, alongside pockets of affluence such as riverside suburbs in the South and parkside ones in the North. Tower Hamlets thus exemplifies the challenges facing providers and commissioners planning for culturally diverse and disadvantaged populations in inner-city urban areas.
Data sources, extraction and management
We used two complementary data sources: postcode with clinical risk factors for individual residents of Tower Hamlets, drawn from general practice electronic records, and social and environmental determinants of health, drawn from local authority registers and nationally available data at lower super output area level (relating to around 400 households/1000–1500 people) or middle super output area (around 2000 households/5000–7200 people).
Using the electronic general practice record system, a cohort was identified comprising all non-diabetic individuals aged 25–79 years in Tower Hamlets from 35 of 36 general practices that used the same computer system. Data download were carried out on secure N3 networks. In order to overcome the information governance hurdle of preventing postcode linking to clinical variables, it was necessary to first download clinical variables attached to a pseudonymised identifier (n=163 275—‘data set 1’). And then, postcode was downloaded separately attached to the same pseudonymised identifier (n=159 353—‘data set 2’). The reduction in numbers was due to two practices that could not share postcode due to technical reasons. We converted Tower Hamlets postcode districts (n=8911) to lower super output area (n=130) using an electronic lookup table.34 Data set 2 (with lower super output area but without postcode) was linked using the pseudonymised identifier to data set 1. Thus, each individual record in the final data set comprised a set of individual-level clinical risk factors plus a lower super output area level indicator of geographical locality, which could be related to local and nationally available statistics.
Our local authority data set, extracted at middle super output area, comprised (1) fast food outlets per capita (n=371); (2) green spaces per square kilometre and (3) population density per square kilometre. Fast food outlets were identified using local authority registry data for codes X15 ‘takeaway’ and X17 ‘restaurants’. All X17 codes were manually reviewed by two researchers and premises unlikely to serve fast food as a major part of their business based on their registration details were removed. This step was necessary because large corporate fast food chains such as McDonalds were registered as ‘restaurants’ rather than ‘takeaways’. Green spaces are quantified at the lower super output area level using the Generalised Land Use Database from 2005, which provides data on the area (in square kilometres) in each lower super output area dedicated to public green space. This does not include private gardens.35 Population density was defined as the total population size of the middle super output area divided by the area in square kilometres. This was calculated from the Office for National Statistics midyear population estimates for 2010, the most recent available.
Estimating diabetes risk
For each individual in the final data set, 10-year risk of diabetes was estimated using the QDScore.17 It is based on 11 variables: age, gender, ethnicity, Townsend score of deprivation (based on unemployment, car ownership, owner occupation and overcrowding), family history of diabetes, personal history of cardiovascular disease, smoking status, treated hypertension, current corticosteroid usage and height and weight. If no family history is recorded, the QDScore algorithm defaults to none. If body mass index is missing, a substituted value is computed based on age, sex, ethnicity, smoking status, presence of treated hypertension and cardiovascular disease. Missing data on smoking are replaced with non-smoking status. If ethnicity is not stated, the algorithm defaults to white British.
Descriptive statistics and data handling were performed using STATA V.1036 and Microsoft Excel 2007. Quintiles of risk were derived and ‘high risk’ defined as ≥20% risk of developing type 2 diabetes in 10 years.
Geospatial mapping
We knew of no previous methodology for describing how chronic disease risk from an entire district's set of general practice electronic records should be displayed by lower super output area. Methodological principles were therefore applied from other relevant research.37 Determining how to display and group data, such as using deciles versus quintiles or percentage at risk versus median risk score (as QDScore was not normally distributed), required consultation and consensus building with relevant local partners including academics, general practitioners and the director of public health. Our final selection of display formats reflected what these consultees considered the most meaningful framings of the data.
Three different geospatial mapping techniques were employed using ArcGIS V.9.238 and Adobe Illustrator V.10. In the ‘basic’ (choropleth style) map, the high-risk population was displayed by lower super output area as a proportion of the denominator (non-diabetic adults aged 25–79 years). A second basic map was created of the Index of Multiple Deprivation score 201039 to allow a visual comparison between high risk of type 2 diabetes and a different indicator of deprivation than that used within the QDScore. Statistical analysis of correlation was not performed due to an unquantified degree of collinearity between Townsend score, which is used in the QDScore and Index of Multiple Deprivation. Basic maps thus presented the data as geographically defined lower super output areas (typically defined by street blocks) in different shades of colour. A list of general practices and hospitals were located using their postcode. They were located in GIS using the centre of each postcode. This analysis was performed to demonstrate the potential usefulness of informing local practice geographical needs assessment.
The ‘heat map’ assigned the proportion at high risk to the population-weighted centroid for each lower super output area. A kriging procedure (which uses a global semivariogram algorithm) was used to create an interpolated surface of risk.40 Heat maps thus offered a statistically ‘smoothed’ presentation of the data in which the lower super output area blocks were no longer visible.
The ‘ring map’ is a relatively new technique, which allows factors of interest (such as putative environmental determinants) to be displayed circumferentially around a map.41 To produce these, we aggregated data to the level of middle super output area (n=31) and presented as quintiles of risk. The following data were assembled for each middle super output area: (1) fast food outlets per capita, (2) percentage of non-green space and (3) population density per square kilometre. Using a validated adjustment procedure,41 we divided each of these into highest quartile, middle 50% (second and third quartiles) and lowest quartile. The ring map thus gives a less granular picture of the geographical distribution of a variable but allows additional mapping of factors that might influence this variable in each locality. Had the map focused on prevalence of diabetes rather than a risk score we could have included known risk factors. We avoided this, however, to avoid any overlap or collinearity between the variables of the QDScore.
Management and governance
This exploratory study was made possible by a number of key partnerships. The work was led by DN, a public health registrar who had previously worked at Tower Hamlets Primary Care Trust and was on an academic attachment with the Centre for Primary Care and Public Health within the medical school, with input from the Department of Geography.
An initiative to improve and maintain data quality of general practice records across the Primary Care Trust had been in place for several years, led by the Clinical Effectiveness Group within the Centre for Primary Care and Public Health. Key relationships and infrastructure including data sharing and governance arrangements were thus already in place to enable Clinical Effectiveness Group staff to securely download and audit data from the electronic medical records of 35 of 36 practices in the district which used the same electronic record system, the Egton Medical Information System (EMIS), and had recently moved to a web-based version of this system enabling remote access.17
The study was classed as service ‘audit’ and deemed outwith its remit by the local National Health Service Research Ethics Committee in January 2011. The local information governance group representing the general practices at the Primary Care Trust agreed to the study and advice on data handling, and mapping was also sought from the National Information Governance Board.
Feasibility assessment
The tasks of identifying, extracting, manipulating, sharing, summarising and presenting our data, especially those derived from the electronic medical records of a large cohort of general practice patients, presented complex practical, technical and information governance challenges.
To capture these, we prospectively collected a data set comprising documents (protocols, service-level agreements, agendas and minutes of meetings) and correspondence (letters, emails, notes of telephone calls). Those represented in this data set included the NHS Research and Ethics Board, University Departments, Tower Hamlets Primary Care Trust, local general practitioners and public health specialists, and the National Information Governance Board.
We analysed this data set by applying a theoretical framework developed previously to study the complex organisational, social and political issues involved in introducing a nationally shared electronic medical record.42 Specifically, we considered: (1) information governance challenges; (2) practical challenges, such as the ease with which procedures could actually be carried out and (3) technical challenges including issues of data security, downloading and interoperability.
Results
Data quality
Completeness of general practice records in our selected cohort aged 25–79 years without diabetes (data set 1, n=163 275) was as follows: age (100%), gender (100%), ethnicity (92.1%), Townsend deprivation score (99.7%), body mass index (76.4%), smoking status (96.3%) and family history of diabetes (21.5%). Of the data that were used in the mapping (n=157 045) 9.48% of people (n=14 885) were at high risk of developing type 2 diabetes within 10 years. This is in addition to the 7% of the adult population of Tower Hamlets already known to have type 2 diabetes.43
Records could not be generated or were removed if (1) the general practice was not able to share the data for technical reasons (n=3922) or patient permission was withheld (n=187), (2) the individual record contained no postcode (n=29) or lower super output area was not calculable from the available postcode (n=275), (3) the geographic location was outside Tower Hamlets (n=1813) or (4) there was a mismatch between records in set 1 and set 2 (n=4). This left 157 045 records for analysis (96.2%) representing 33 of 36 general practices. Reducing the list of restaurants to those with a major business purpose of takeaway food resulted in a total sample of 371 outlets.
Mapping results
The basic map (figure 1A) illustrates the variation in prevalence of high diabetes risk across lower super output areas in Tower Hamlets, with a maximum of 17.3% of the non-diabetic population being at high risk (not including the 7% already diabetic). General practices and hospitals are also shown in figure 1A. The areas of highest prevalence for diabetes risk were distributed on either side of the main east-west highway which transects the district and corresponds with well-known deprived housing estates and high-rise blocks of flats on either side of this road.
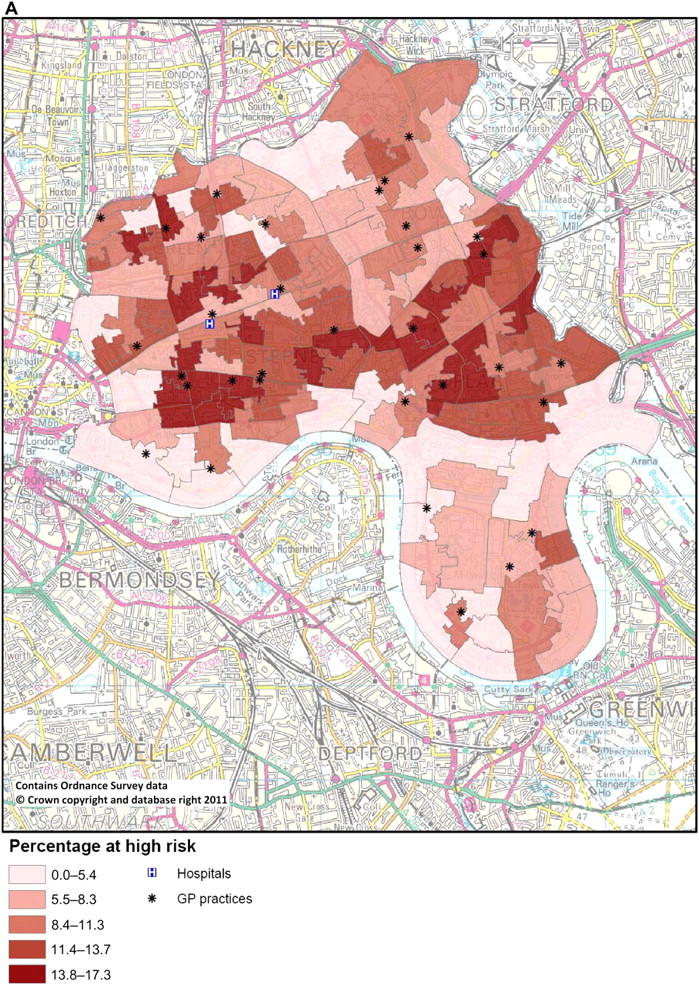

(A) Basic map showing percentage of adult population at high risk of diabetes by lower super output area. (B) Basic map showing Index of Multiple Deprivation score by lower super output area.
A basic map of Index of Multiple Deprivation scores by lower super output area (figure 1B) showed a near-identical geographical distribution with high diabetes risk.
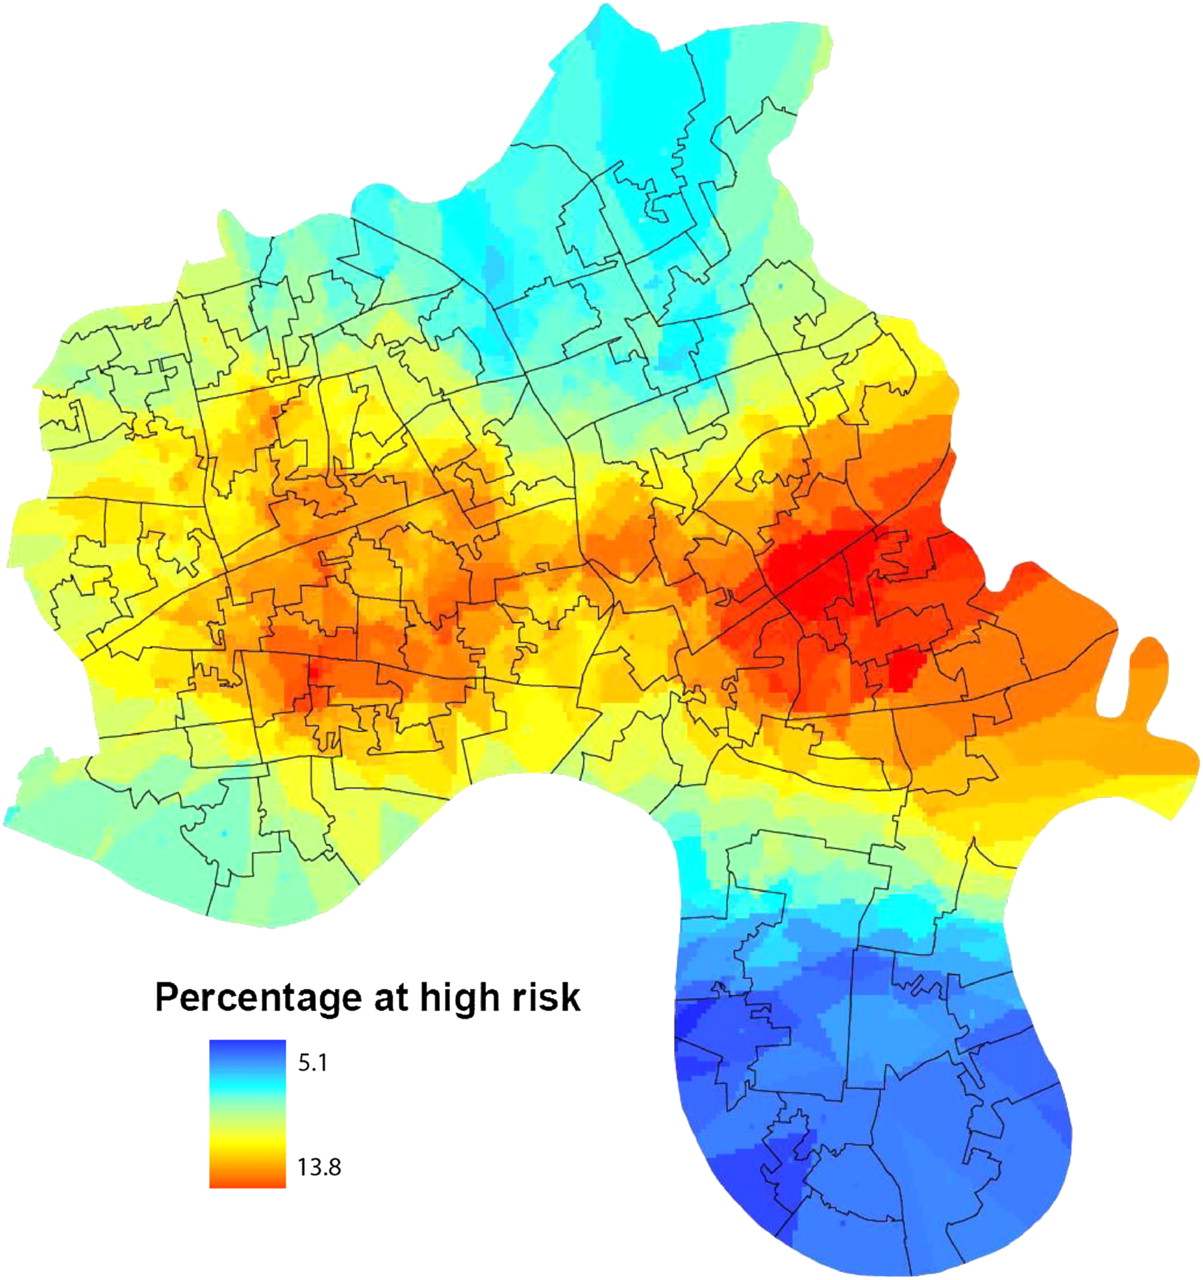
The heat map (figure 2) shows the same information as figure 1A but displayed as a globally smoothed surface over the entire geographic area. The prevalence of high diabetes risk in this smoothed version of the data varied from 5.1% to 13.8%. This way of visualising the data depicts—somewhat more dramatically—a high-risk ‘hot’ band running west to east through the deprived housing estates and much lower risk ‘cool’ areas in the more affluent riverside in the south and parkside in the north of the district. The heat map is free from the visual lower super output area administrative boundaries that are commonly used in maps of the ‘basic’ type. The resulting map is likely more intuitive for users to interpret due to the colour scheme, and there are no boundaries to disrupt the visualisation of diabetes risk.

Heat map showing percentage of adult population at high risk of diabetes using a statistical smoothing technique.
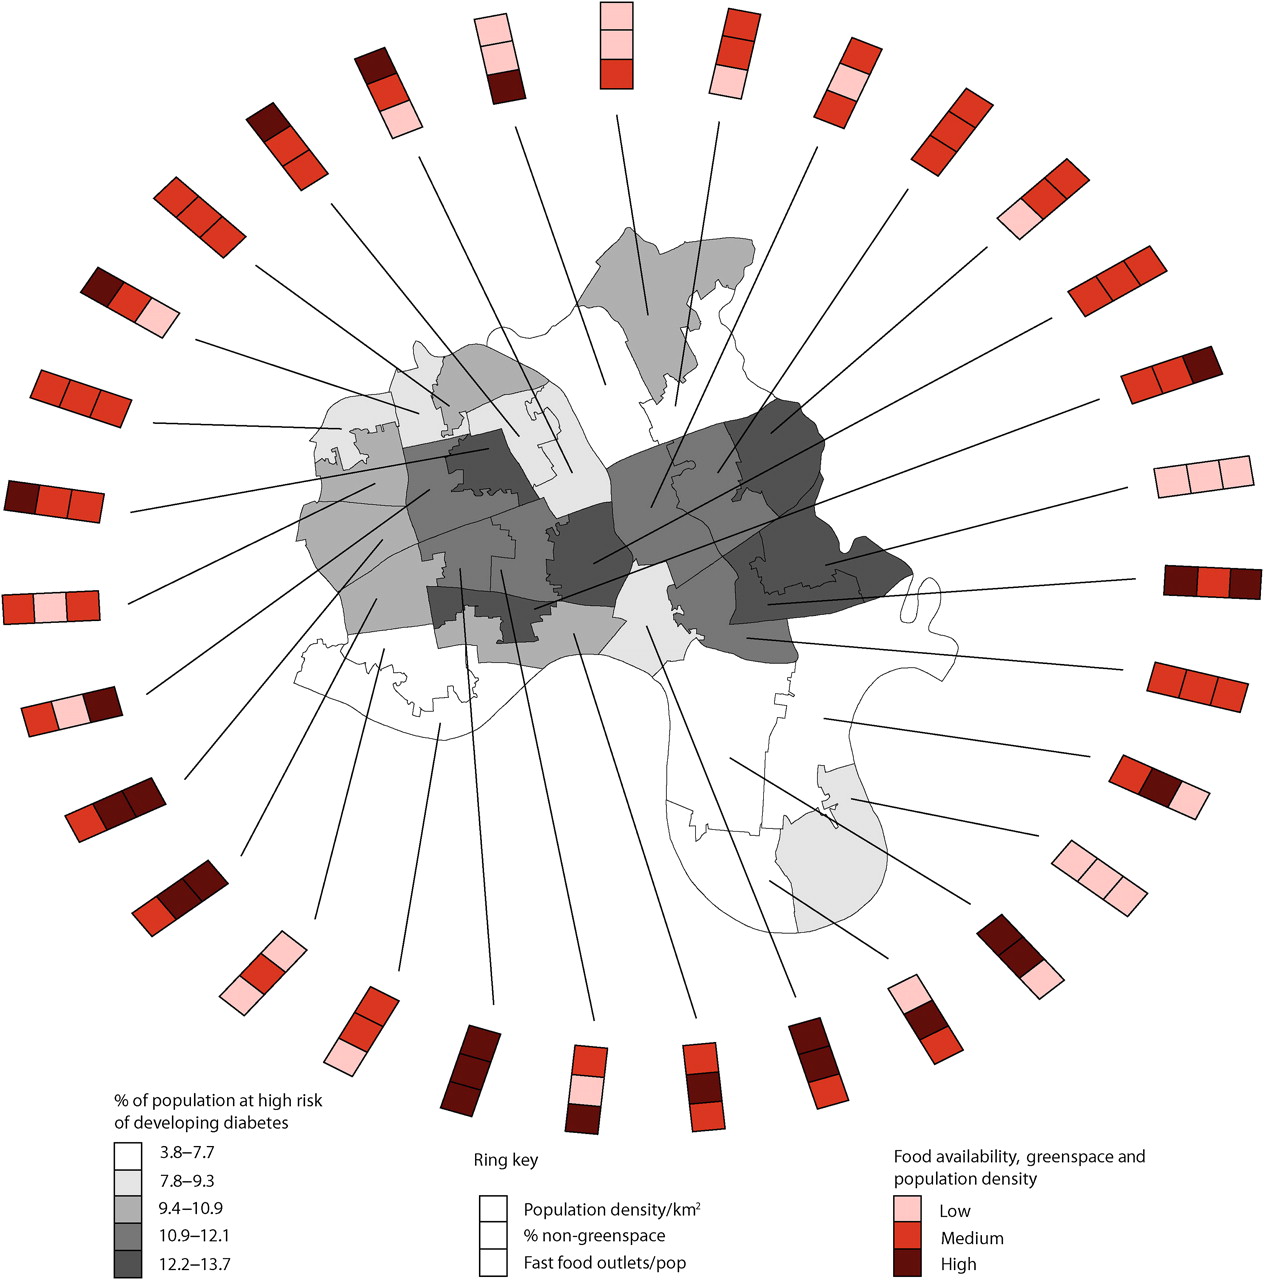
The ring map (figure 3) shows prevalence of high diabetes risk by middle super output area. In this depiction of the data, prevalence of diabetes risk ranges from 3.8% to 13.7%. Each middle super output area is shown linked to a band of three social and environmental indicators, which are often suggested to influence poorer health.44 These are (from the inside out) fast food outlets per head of population, percentage of non-green space and population density per square kilometre.
Ring map showing percentage of population at high risk of diabetes, with selected social and environmental characteristics, by middle super output area.
Overall, the ring map provided a striking visual display of type 2 diabetes risk in the areas that corresponded to known deprivation, and the ring provided a relatively new way of displaying social and environmental determinants of health at a small area level. The ring provides a dashboard of indicators of wider determinants of health that appeared most useful when locally applied to specific population groups of 5000–7200 persons. It demonstrates the sort of putative environmental determinants that public health specialists may want to map as part of routine health needs assessment to inform interventions at small area level.
Feasibility assessment
As we had anticipated, the information governance challenges were substantial and were as time consuming as the technical ones. In order to access the data from general practice records, permission had to be obtained from both the local information governance committee of the Primary Care Trust and the National Information Governance Board. In addition, because we considered that this project had a research element, we were also required to seek advice from the local National Health Service Research Ethics Committee and from the university's Research and Development Office (who both deemed the project ‘audit’). Potentially identifiable data from patient records had to be handled securely under a protocol advised by the National Information Governance Board. This kept postcode information separate from clinical variables with pseudonymised conversion to lower super output area.
Information governance issues were thus time consuming and required specialised knowledge and formal permissions, but they were not insurmountable. Furthermore, the process of establishing a procedure for the current project built a stock of in-house knowledge and a network of contacts that would make any subsequent set of permissions and procedures substantially easier to set up.
The practical challenges of undertaking this work were relatively minor. However, this was probably due to a near-optimal local infrastructure (see ‘Management and governance’ above). Unusually, we had access to a single electronic database covering an entire Primary Care Trust area due to unique data sharing arrangements between the local general practices, the Primary Care Trust and the university. Furthermore, the quality and completeness of general practice electronic data across the district was higher than average. Those seeking to replicate this approach in other parts of the world may need to undertake groundwork to establish a mechanism for data extraction from multiple different computer systems, underpinned by relationships and permission for governance, data sharing and data quality.
Technical challenges included downloading and cleaning the data, which had to be done in several stages due to the size of the files and handling of multiple values. Conversion of postcode to lower super output area with lookup tables and secure data pairing protocols between data sets 1 and 2 was time consuming. Specialist software was expensive and different versions used between the clinical effectiveness group and the geography department were inconvenient and resulted in time spent converting files and reducing lines of data, with older software unable to hold as much data. EMIS web does not keep records of searches performed once an update is installed (which occurs every 4–6 months), so there is a limited time window for cross-sectional analysis.
All geographical work was carried out on a 256 bit NHS encrypted memory stick in the geography laboratory so that files with lines of patient information were never used outwith the clinical effectiveness group except on secure memory sticks. This was time consuming and prevented regular backup of data, which had to be done between two encrypted memory sticks periodically. The technical process of mapping was relatively straightforward—once the data had been prepared, received and decisions made about what maps to create—as expertise was present within the research team to use GIS and Adobe Illustrator. It is unlikely that without these skills high-quality maps could be produced.
Discussion
Summary of findings
In this study, we have shown that it is possible to (1) obtain a near-complete set of de-identified data drawn from an entire district's electronic general practice records in an ethnically and socio-economically diverse inner-city district, (2) use a computer algorithm to determine 10-year risk of type 2 diabetes for individuals on this data set and (3) use geospatial mapping to highlight dramatic variation in diabetes risk by small-area geography and show how social and environmental determinants of health can be effectively displayed and communicated. Information governance and technical issues were challenging but surmountable. We conclude that the technique of geospatial mapping, of which we have explored three different formats, may help to meet the rapidly growing need for local health intelligence by planners and commissioners of health services.
Mapping health information
Taking a geospatial view of health information such as population at risk of disease complements a traditional statistical approach to such data. Epidemiologists use statistical tests, arithmetic adjustments and critique causality claims and data. By contrast, cartographers use geospatial visualisation, utilise classing breaks (eg, quintiles) and critique symbolisation.37 These different paradigms have an important complementary role. Quantitative analysis identifies statistically significant trends; cartography brings meaning and local relevance. Yet merely converting routine epidemiological data into maps runs the risk of oversimplifying complex data and misunderstands the purpose of geovisualisation, which is to represent data spatially. Grouping and classing data for mapping is an interpretive process, and ‘points of interest’ to which the eye is drawn on a map may or may not correspond to statistically significant relationships between variables as determined by traditional epidemiological approaches.
The key aim in health mapping is not to identify statistically significant relationships but to gain first insight, then understanding of the ways in which health status varies over space and to reveal the potential drivers behind this variation. In our research, by identifying areas of highest prevalence of greater diabetes risk in relation to small areas, local general practitioners, public health specialists and planners can be aware of increased risk and possible causes in their locality, so as to target individual and population interventions. Such ‘local’ information may be unlikely to emerge from statistical analyses alone.
Although we emphasise small-area geographic analysis, we recognise that individual health is linked to non-spatial social determinants, and a map of local-level data is most valuable when interpreted in the wider social context. Relative income inequality within the UK is likely to influence weight (and therefore diabetes) via complex pathways.45 One example is the ‘obesogenic environment’ model, which encompasses local and national, physical and social environments.46 The maps presented here are ideally considered with this context in mind.
Resources and skills in handling health information in order to commission new interventions and services may be limited, particularly where they relate to dual responsibility of both local authorities and health providers for the health of local populations. Geospatial mapping offers one option to address these deficiencies and present diverse information about health and its wider determinants in an accessible format to support commissioning and planning expertise. It is possible, though somewhat speculative at this stage, that investment in the skill base needed for this approach may prove a sound investment in the longer term.
Strengths of this study
This study is the first in the UK (and possibly world wide) to use routinely collected, local individual patient data to generate high-quality small-area maps of disease risk across an entire district. A significant strength of this study was the quality and completeness of the data set from which the geospatial maps were derived. We obtained up-to-date data on over 96% of the target cohort (aged 25–79 years) across the whole of Tower Hamlets and only one of the data fields (family history of diabetes) contained a significant proportion of missing data.
The completeness of data capture in this study was attributable to a number of things: (1) existing partnerships between the university and the National Health Service; (2) a 20-year history of using electronic medical records in local general practices, with standard data entry templates for performance monitoring, audit and needs assessment; (3) existence of local data sharing agreements and information governance infrastructure for overseeing the use of electronic personal medical data and (4) the fact that 35 of 36 general practices in the district used the same computer system (EMIS) which was compatible with the chosen diabetes risk algorithm (QDScore) and 33 of 35 shared postcode.
Limitations of this study
A potential limitation of our study is the uniqueness of the local context. In order for the method used here to be successfully reproduced by others, a number of conditions need to be met. First, effective data sharing agreements must be in place and a high degree of trust is necessary between all parties. Second, the general practice records of a whole population need to be accessible and the quality of relevant data fields on these records (completeness, accuracy and consistency of coding) must be high. Third, our method requires that patients registered at a particular general practice live in the same district. This was not the case for 1813 (1.1%) individuals in this study. In some other localities, this discrepancy might be far greater. Fourth, the task of downloading and cleaning data and geographically mapping disease risk required an advanced set of skills and took many hours of input from a data analyst, public health specialist and human geographer. We are some way off a set-up whereby planners or general practitioners can simply hit the ‘map it’ button on their consoles to produce maps like the ones illustrated in this paper.
Conclusions
Using small-area maps to plot risk of chronic disease at a local level is relatively novel. In particular, ring maps have been used previously by other research teams, but this technique is still in its infancy.41 It informs visualisation of important social determinants of health, which may generate engagement of people with an interest (including local populations) in research and targeted initiatives for improvement. However, the use of this technique beyond the research environment may be limited by governance and technical factors and by the specialist skills needed for the data extraction and mapping. The methodology could be refined through further research of potential utility to improve geospatial mapping for public health planning. Further studies of feasibility, impact and cost are needed, as are published information governance guidance on how to handle patient-level data for geospatial mapping.
References
Footnotes
To cite: Noble D, Smith D, Mathur R, et al. Feasibility study of geospatial mapping of chronic disease risk to inform public health commissioning. BMJ Open 2012;2:e000711. doi:10.1136/bmjopen-2011-000711
Contributors DN led the conceptualisation and management of the project, briefed and supported all researchers, assisted with data analysis and the technical process of creating the maps and led the writing of the paper. DS performed all of the mapping procedures, advised on methodology and revised versions of the manuscript. RM extracted and cleaned quantitative data from electronic general practice records and commented on versions of the manuscript. JR oversaw data extraction from general practice records, led on information governance and revised versions of the manuscript. TG helped conceptualise and manage the study, assisted with interpreting the data and developing the maps and revised versions of the manuscript. JR and TG act as guarantors.
Funding The study was funded from small grants from Tower Hamlets and Newham and City & Hackney Primary Care Trusts, and an MRC fellowship (G0802447) for DS. The Primary Care Trusts funded the research in return for a separate report on diabetes risk in East London. The funders had no role in the analysis of data or the content of the final manuscript. The study was exempted from research ethics approval by the Chair of East London and The City Research Ethics Committee, on the grounds it was audit and service development.
Competing interests JR was an author of the QDScore.
Provenance and peer review Not commissioned; externally peer reviewed.
Data sharing statement No further data to share.
Linked Articles
- Miscellaneous