Article Text

Abstract
Objectives To develop a prognostic model to identify and quantify risk factors for mortality among patients admitted to the hospital with COVID-19.
Design Retrospective cohort study. Patients were randomly assigned to either training (80%) or test (20%) sets. The training set was used to fit a multivariable logistic regression. Predictors were ranked using variable importance metrics. Models were assessed by C-indices, Brier scores and calibration plots in the test set.
Setting Optum de-identified COVID-19 Electronic Health Record dataset including over 700 hospitals and 7000 clinics in the USA.
Participants 17 086 patients hospitalised with COVID-19 between 20 February 2020 and 5 June 2020.
Main outcome measure All-cause mortality while hospitalised.
Results The full model that included information on demographics, comorbidities, laboratory results, and vital signs had good discrimination (C-index=0.87) and was well calibrated, with some overpredictions for the most at-risk patients. Results were similar on the training and test sets, suggesting that there was little overfitting. Age was the most important risk factor. The performance of models that included all demographics and comorbidities (C-index=0.79) was only slightly better than a model that only included age (C-index=0.76). Across the study period, predicted mortality was 1.3% for patients aged 18 years old, 8.9% for 55 years old and 28.7% for 85 years old. Predicted mortality across all ages declined over the study period from 22.4% by March to 14.0% by May.
Conclusion Age was the most important predictor of all-cause mortality, although vital signs and laboratory results added considerable prognostic information, with oxygen saturation, temperature, respiratory rate, lactate dehydrogenase and white cell count being among the most important predictors. Demographic and comorbidity factors did not improve model performance appreciably. The full model had good discrimination and was reasonably well calibrated, suggesting that it may be useful for assessment of prognosis.
- COVID-19
- epidemiology
- statistics & research methods
- rationing
Data availability statement
Data may be obtained from a third party and are not publicly available. Data for this study were licensed from Optum. While we are unfortunately not able to publicly share the data, an R Markdown HTML document (with all code and output for the manuscript as well as supplemental analyses) is available at https://github.com/phcanalytics/covid19-prognostic-model and in online supplemental file 2. Interested researchers may contact Optum for data access requests. All interested researchers can access the data in the same manner as the authors. The authors had no special access privileges.
This is an open access article distributed in accordance with the Creative Commons Attribution Non Commercial (CC BY-NC 4.0) license, which permits others to distribute, remix, adapt, build upon this work non-commercially, and license their derivative works on different terms, provided the original work is properly cited, appropriate credit is given, any changes made indicated, and the use is non-commercial. See: http://creativecommons.org/licenses/by-nc/4.0/.
Statistics from Altmetric.com
Strengths and limitations of this study
To our knowledge, this is the largest dataset used for prognostic modelling of patients with COVID-19 in the USA.
Interpretable models were developed that can explain the clinical effects of predictors and quantify their relative importance in a straightforward manner.
Model evaluation was performed by assessing both discrimination and calibration; bootstrap resampling and a random training/test split were used for validation.
Considerable missing data in the laboratory results were imputed using multivariate imputation by chained equations and diagnostics were run to assess adequacy.
Estimates of mortality may be underestimated due to lack of out-of-hospital mortality data.
Introduction
In December 2019, an outbreak of novel COVID-19 occurred in Wuhan, China, and was officially declared a pandemic in March 2020 by the WHO. To date (March 2021), more than 120 million people have been infected worldwide and over 2.7 million people have died1 with case and fatality rates among the highest in the USA. Severe COVID-19 illness can result in hospitalisation, intensive care stays and death. Mortality rates among hospitalised patients are especially high and have ranged from 15% to 20% in the USA.2–4
High mortality rates are due to a number of factors, including severity of the disease, a lack of available treatments, and in some cases, shortages in medical supplies and personnel caused by surges in hospitalisations. Yet, despite high mortality rates, there is still some uncertainty about which factors place patients most at risk for the poorest outcomes. Efforts to reduce this uncertainty through better quantification of the relative importance of risk factors for severe illness can help on a number of fronts. Specifically, it has been suggested that known risk factors for severe outcomes can be used by medical staff to triage patients or for health systems to identify priority groups for vaccination.5–7 Furthermore, it can help individuals understand their own risks of illness and clinicians assess prognosis for their patients. Finally, a better understanding of risk factors for COVID-19 mortality can be used to stratify patients in clinical trials or to identify covariates to adjust for in comparative-effectiveness analyses using observational data.8–10
For many of these reasons, there has been a strong interest in the development of prognostic models for COVID-19. While a number of models have already been developed, there is still a need for more rigorous and validated models. Wynants et al5 conducted a systematic review of existing models and found that most studies had a high likelihood of bias due to non-representative patient cohorts, overfitting due to small sample sizes and exclusion of patients who have not yet had an event. While, to date, total deaths in the USA comprise almost one-fifth of global deaths,1 few models have been developed using large geographically diverse US cohorts. Existing studies have also inadequately adjusted for confounding variables when assessing the impact of particular risk factors. It is, therefore, difficult to make claims on the relative importance of different risk factors.11
In this study, we developed a prognostic model of in-hospital mortality in the USA and aimed to overcome many of the limitations of prior studies.
Methods
Data source
The Optum de-identified COVID-19 Electronic Health Record dataset was used to identify patients hospitalised with COVID-19. This dataset consists of a national sample of inpatient and outpatient medical records sourced from hospital networks from across the USA. Data are de-identified in compliance with the Health Insurance Portability and Accountability Act Expert Method and managed according to Optum customer data use agreements.4 Age for those 89 years and older was aggregated in the dataset.
Study cohort
To be eligible for the hospitalised cohort in this study, patients were required to be older than 18 years old and have: (1) a U07.1 or U07.2 diagnosis, (2) a positive SARS-CoV-2 diagnostic test (eg, either molecular or antigen tests) or (3) a B97.29 diagnosis with the absence of a negative SARS-CoV-2 molecular test within a 14-day window. Eligible hospitalisations required inpatient or emergency room (ER) overnight visits with a COVID-19 diagnosis or starting up to 21 days after a COVID-19 diagnosis. Contiguous ER and inpatient visits, with up to a 1-day gap were considered a single hospitalisation. The date of admission was used as index date when COVID-19 diagnosis occurred before hospitalisation; otherwise, index date was set to the date of COVID-19 diagnosis. Only the first hospitalisation was considered in this study. The study period was 20 February 2020–5 June 2020.
Outcome
The outcome was a binary measure of in-hospital all-cause mortality. To ensure that there was sufficient follow-up time, patients were removed from the study population if their index date was less than 2 weeks prior to the date the Optum dataset was censored (5 June 2020), resulting in the removal of approximately 5% of the overall study population. Evidence from the US Centers for Disease Control and Prevention on time to death following hospital admission (median: 5 days, IQR: 3–8 days)12 suggests that this was sufficient to capture most deaths.
Predictors
Candidate predictors were chosen based on prior research and included demographics, calendar time, comorbidities, vital signs and laboratory results.5 Demographic variables were age, sex, race, ethnicity, geographical division and smoking status. To capture trends over time, a calendar time variable was derived that measured the number of days between a patient’s index date and the date of the first case in the data. Comorbidities were identified based on International Classification of Diseases, Ninth Revision (ICD-9) and ICD-10 codes within a year of index date and included hypertension, diabetes, and those included in the Charlson Comorbidity Index (CCI).
Vital signs considered were peripheral oxygen saturation, systolic blood pressure, heart rate, respiratory rate, temperature and body mass index (BMI). Laboratory results for aspartate aminotransferase, C reactive protein, creatinine, ferritin, lactate dehydrogenase (LDH), troponin I, lymphocyte count, neutrophil count, platelet count (PLT) and white blood cell count (WBC) were obtained. D-dimer and procalcitonin laboratory measures were also considered but were dropped due to very high missingness (90% and 49%, respectively). We restricted vital signs and laboratory results to those within a (−3, +1) day window surrounding the index date and used the (median of the) value(s) closest to the index date when multiple values were available within the window.
Missing data for each of the candidate predictors are summarised in online supplemental file 1 section 1. There were significant missing data for race, ethnicity, BMI, smoking status, and some of the vital signs and laboratory results. Multiple imputation was consequently used as described below.
Supplemental material
Model development and statistical analysis
A multivariable logistic regression was used to model mortality. To protect against overfitting, we first performed variable selection by fitting a logistic model with a group lasso penalty.13 14 We repeatedly fit the lasso model 100 times and used 10-fold cross-validation during each of the 100 iterations to select the optimal tuning parameter, ‘lambda’. Variables with non-zero coefficients in at least 90% of the iterations were included. In practice, only two variables were excluded: peptic ulcer disease and neutrophil count (online supplemental file 1 section 2).
The model with all predictors chosen by group lasso was the ‘full’ model. For comparison, we fit four more parsimonious models with the following predictors: (1) age only, (2) comorbidities only, (3) all demographics (and calendar time), and (4) demographics (and calendar time) and comorbidities. Non-linear relationships between mortality and continuous predictors were modelled using restricted cubic splines. Three knots were deemed sufficient based on graphical assessment of univariate fits in nearly all cases; four knots were used for respiration rate to capture a bathtub-shaped relationship with mortality. These graphical assessments also showed that a few outliers were influencing the fit of some of the laboratory results. They were consequently truncated from above (at the ‘outer fence’ defined as the third quartile plus three times the IQR), which led to stronger and more clinically meaningful relationships (online supplemental file 1 section 3).
Predictor effects were summarised in four ways. First, coefficient estimates were translated into clinically meaningful ORs. ORs for each value of a categorical variable were computed based on comparisons with a reference group. ORs for continuous predictors were based on changes in value from the 25th percentile to the 75th percentile. Second, we predicted log odds across different values of each predictor and visually assessed the effects. Third, predicted probabilities were computed by age, sex and calendar time for a random sample of 1000 patients, and then averaged across patients. Fourth, variable importance was assessed using Χ2 minus df from a Wald test that tests the hypothesis that the coefficient of each term associated with a variable (eg, all categories of a categorical variable or all spline terms of a continuous variable) is zero.15 16
To validate the model, we randomly split the data into a training and test set using an 80/20 split and evaluated the model in both the training and the test sets. Model performance was assessed using the C-index (area under the receiver operating characteristic curve) and Brier score. To assess overfitting, 50 bootstrap replications were used to quantify ‘optimism’ in the training set, defined as the average of differences in model performance between the training and bootstrapped samples. Calibration was assessed using a calibration curve that compared predicted probabilities with actual probabilities.
Missing data were imputed using multivariate imputation by chained equations.17 A total of five datasets were imputed. Assessment of the imputation was performed by comparing the distribution of the missing imputed data with the observed data for each predictor. Online supplemental file 1 section 4 shows that these distributions were very similar for each variable, which suggests that the imputation was adequate. Coefficient estimates and CIs were combined across the imputations using Rubin’s rule.18
Analyses were performed using R V.4.0.0. We used three main R packages in the analysis: mice for multiple imputation, oem to fit the group lasso, and rms to fit the multivariable logistic regressions, summarise the coefficients and validate the model.14 15 17 Additional details of the methodology and code for the analyses are available in online supplemental file 2.
Supplemental material
Patient and public involvement
No patients were involved in the design or implementation of the study, nor were they involved in the interpretation or writing up of the results.
Results
Characteristics of the study population
We identified 17 086 patients who met the inclusion criteria for the COVID-19 hospitalised cohort, defined in detail elsewhere.4 The characteristics of the 13 658 patients included in the training set are described in table 1 and in additional detail in online supplemental file 1 section 5.
Characteristics of hospitalised patients with COVID-19 in training set by mortality status
The median age was 62 years old (IQR: 49–75). The cohort was composed mostly of male (51.9%) non-Hispanic whites (56.0%). Most patients resided in the Middle Atlantic (34.9%) and East North Central (34.9%) geographical divisions, which mirrors the initial surge of cases in the USA. Patients had high rates of comorbidities: 58.6% had hypertension, 33.8% had diabetes, 26.6% had chronic pulmonary disease (CPD), 20.7% had renal disease, and the median CCI score was 1 (IQR: 0–3). The majority of patients were overweight (30%) or obese (48%). Median oxygen saturation was 96.0%, and 25% of patients had oxygen saturation lower than 94.0%.
A comparison of the training and test sets is provided in online supplemental file 1 section 6. There were no meaningful differences in demographics, comorbidities, vital signs or laboratory results.
Predictor effects
ORs from the multivariable logistic regression are displayed in figure 1. Age was an important predictor as the odds of death for a 75-year-old patient (75th percentile) were around six times more than for a 49-year-old patient (25th percentile). Mortality decreased over time as evidenced by the negative OR for calendar time. Since some of the predictor effects were non-linear, plots showing the non-linear predicted effects of the continuous variables on the log-odds scale are displayed in online supplemental file 1 section 7 . The log-odds plot shows, for instance, that mortality is higher at both lower and higher levels of temperature and systolic blood pressure, and that the strong negative relationship between oxygen saturation and mortality is only present below approximately 95%.
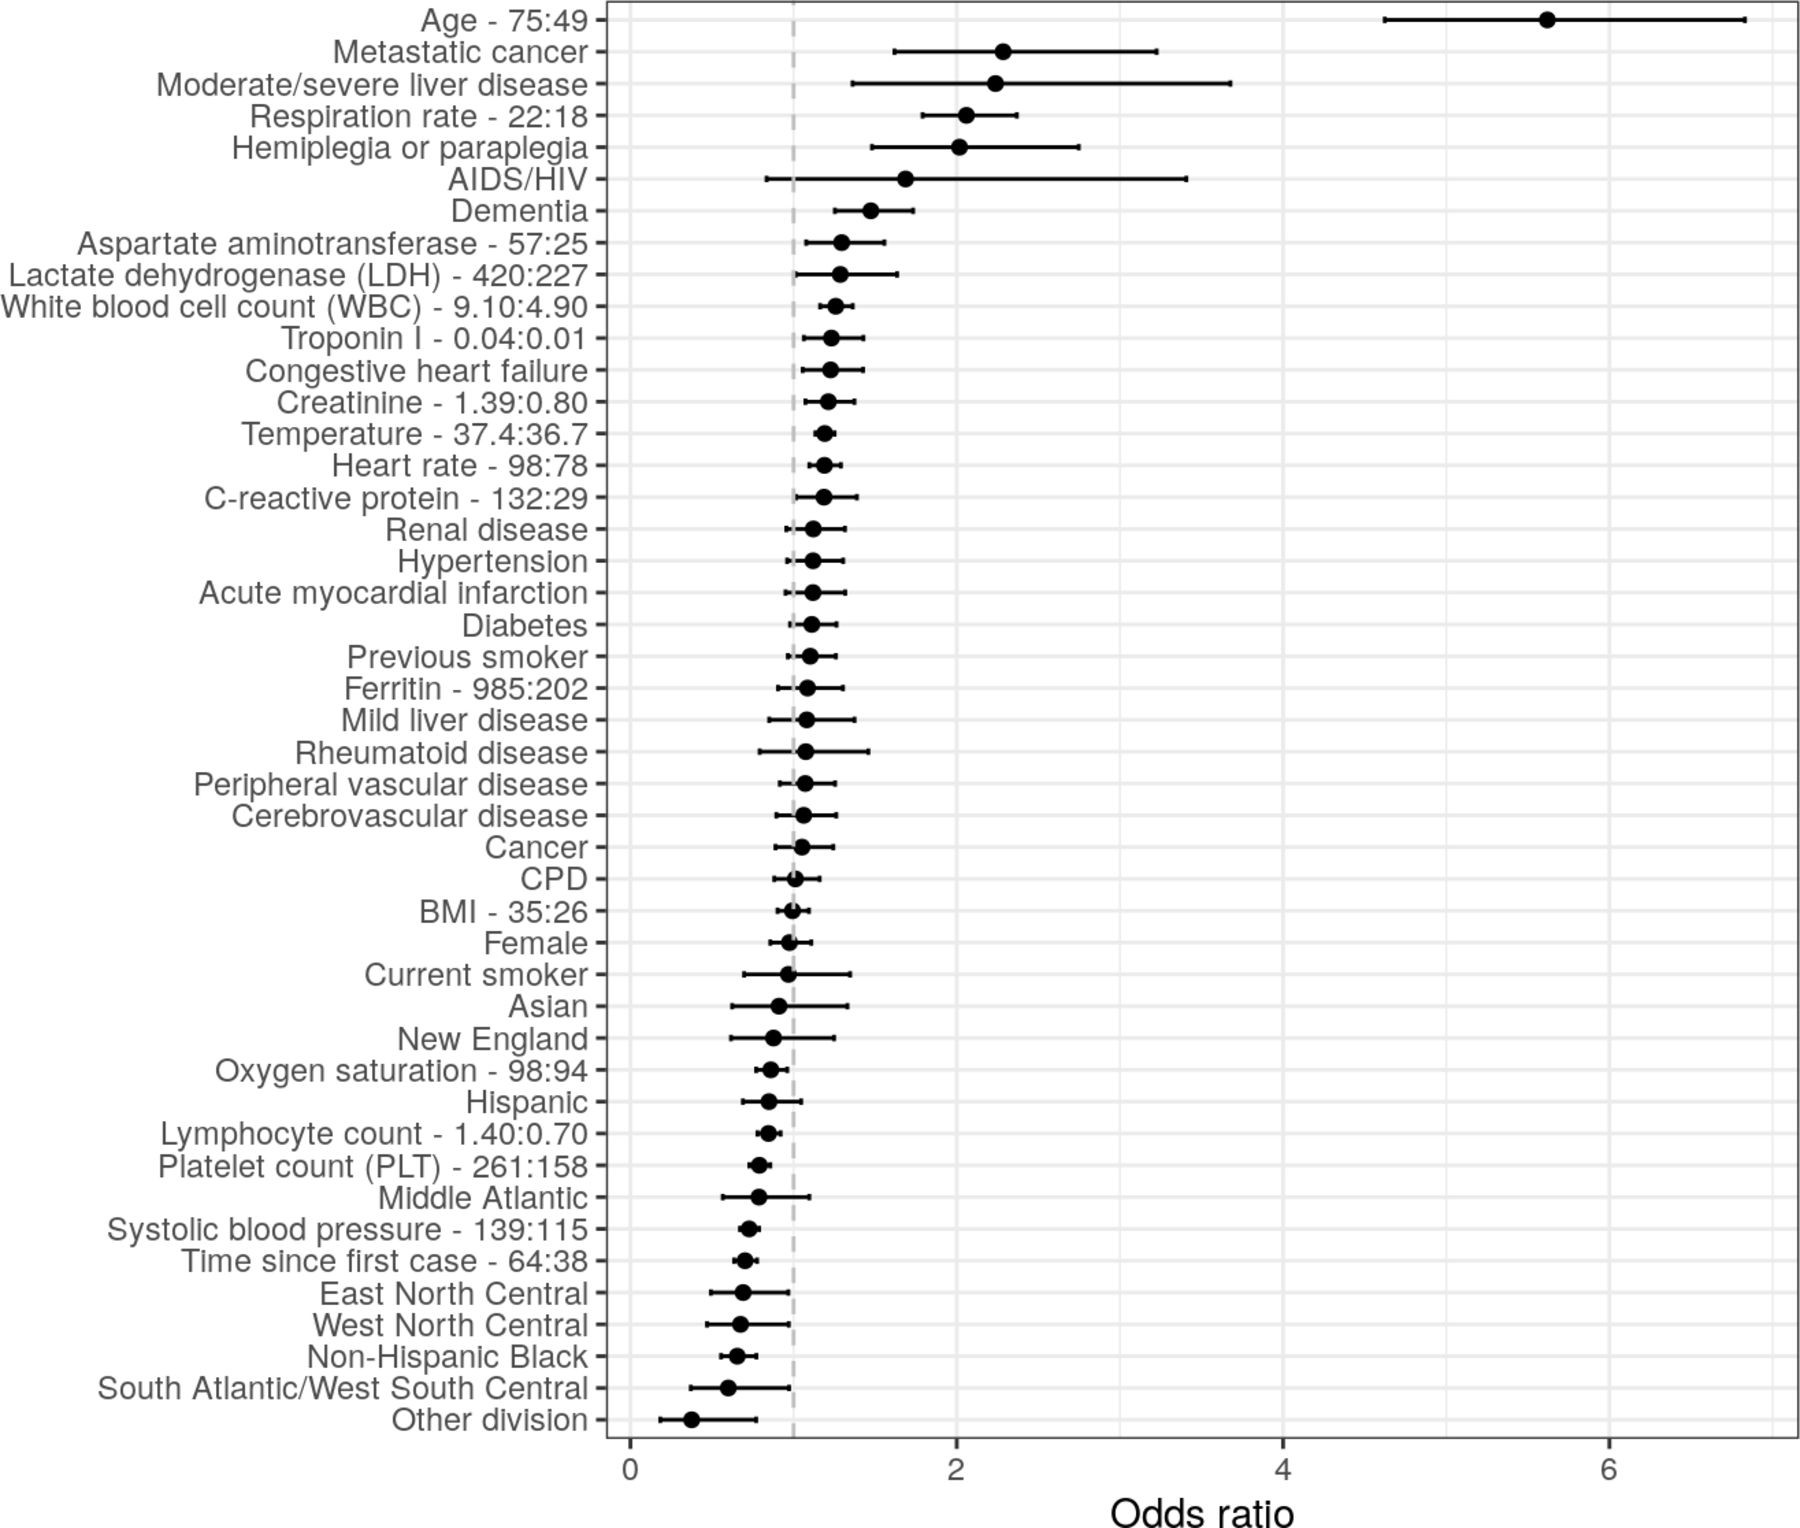
ORs of mortality from the full multivariable logistic regression. Error bars represent 95% CIs. IQR ORs are used for continuous predictors (upper quartile: lower quartile). Reference groups for categorical predictors are as follows: race/ethnicity=‘non-Hispanic white’, division=‘Pacific’, sex=‘male’, smoking =‘never smoker’. BMI, body mass index; CPD, chronic pulmonary disease.
Figure 2 displays the importance of each variable based on Wald tests. Age is the most important predictor by a considerable amount. Laboratory results and vital signs tend to be more important predictors than either comorbidities or demographics: impactful predictors include respiration rate, temperature, oxygen saturation, heart rate, WBC and LDH. Calendar time is also considered an important predictor.

Ranking of importance of predictors of mortality from the full multivariable logistic regression. A higher value of ‘Χ2 minus df’ implies that a predictor has a larger contribution to the fit of the model.
To assess the clinical impact of changes in predictors, it is helpful to assess predicted probabilities of mortality. These are displayed across levels of age and calendar time for a random sample of 1000 patients in figure 3. The effect of age on the probability scale is exponential and increased sharply with older ages. In March of 2020, a hospitalised patient aged 80 years old had a predicted probability of death of 34% whereas a patient aged 70 years old had a predicted probability of death around 10% points lower. The predicted probability of death for an 18-year-old patient at the same date was less than 2%. Mortality probabilities did decrease considerably over time with mortality rates for patients aged 80 years old approaching 20% by May 2020.
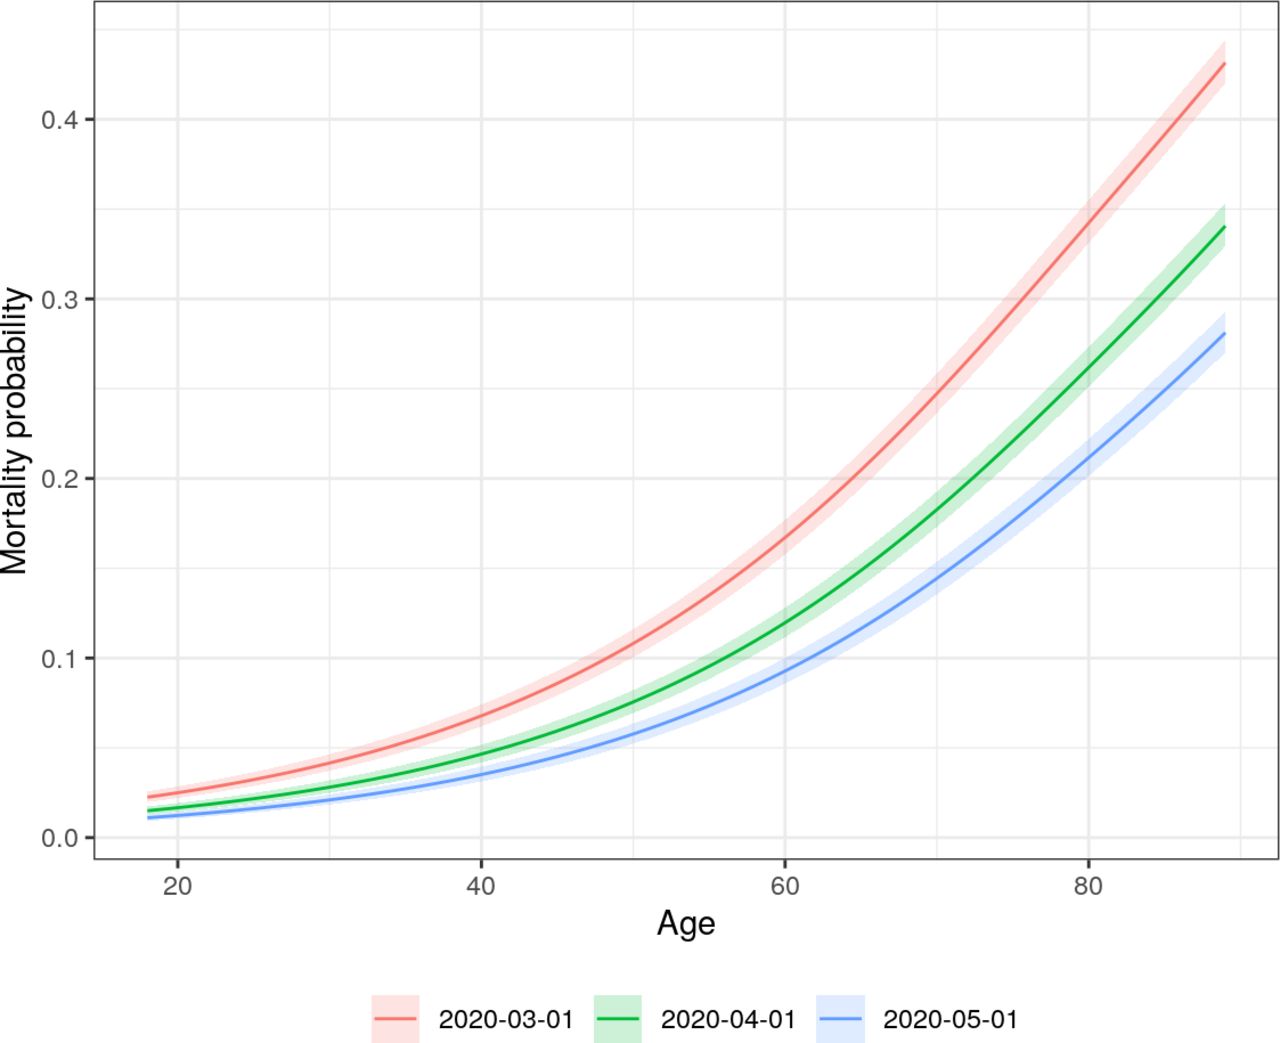
Predicted probability of mortality from the full multivariable logistic regression by age and calendar time. Each curve represents a specific hypothetical index date. Age and calendar time effects are adjusted for all variables in the full model. Predictions for each age and calendar time combination are averaged over a random sample of 1000 patients.
Validation and predictive performance
Calibration curves comparing predictive probabilities to actual probabilities among patients in the training and test sets are shown in online supplemental file 1 section 8 and figure 4, respectively. In the training set, the bias-adjusted and unadjusted curves were similar, and ‘optimism’ was approximately zero, suggesting that there was little overfitting; however, there was more overprediction for higher risk patients in the test set. In both cases, models including comorbidities tended to be poorly calibrated for more at-risk patients, while the full model was better calibrated.

Calibration curves from predictions of the logistic regression model on the test set by model specification. Points on the dashed 45° line imply that the predicted probability is equal to the actual probability.
Higher predicted probabilities of mortality were much more common in the full model than in any of the other models. In other words, the variance of the predictions was higher implying that the full model was better able to discriminate between patients. This was also reflected in table 2, which reported estimates of the C-index and Brier score. In the test set, the C-index improved from 0.756 in the age-only model to 0.874 in the full model and the Brier score decreased from 0.111 to 0.088. Results were similar in the training set. Notably, there was no appreciable difference in either the Brier score or the C-index between the age-only model, the demographics model, or the demographics and comorbidities model.
Summary of predictive performance in the training and test sets by model specification
The full model including laboratory results and vitals consequently performed best overall given that it was more discriminating than the competing models and was still well calibrated. The parameter estimates used to predict mortality with the full model are available in online supplemental file 1 section 9.
Discussion
We aimed to develop a rigorous model that was both clinically interpretable and had good predictive performance. We quantified the relative importance of different predictors to identify risk factors that would be most important for assessing prognosis. One of the most striking findings from our study is that the most parsimonious model—one that only includes age—is highly predictive; in fact, age is nearly as prognostic as all other information on demographic and comorbidities. This does not mean that age alone is sufficient for prediction, but it does suggest that simply knowing a patient’s age is very informative. Vital signs and laboratory results do improve model predictions which use age alone, meaningfully increasing the C-index and decreasing the Brier score.
Comparison with other studies
A living systematic review of existing prognostic models has been conducted by Wynants et al5 and 50 prognostic models have been identified to date. A subset of those predict mortality among hospitalised patients.
Most prognostic models are based on data from China,19–24 although others have been developed with data from the UK,25–27 Mexico,28 South Korea,29 Israel,30 the USA31–33 and a mix of countries.34 Our study differs from the other US studies in that it includes a broader cohort of patients encompassing all geographical regions. Our results may then help inform the extent to which models trained using narrower cohorts can generalise across heterogeneous populations.
Models have typically been trained on smaller datasets, with most consisting of <1000 patients and a few with sample sizes ranging from 1000 to 3000.29 31 32 Only two studies, to our knowledge, had a sample size larger than 10 000 and both were based outside of the USA.27 28 Smaller sample sizes not only increase the likelihood of overfitting, but also reduce the ability to detect important risk factors.
One advantage of our approach compared with more ‘black box’ prediction models is that the effects of the predictors were interpretable.35 36 For instance, we used splines15 16 37 to plot the non-linear effect of each predictor in the model and predict mortality by different values of important predictors like age and calendar time. As we discuss below, the model parameters had a reasonable clinical interpretation, which, in turn, increases confidence that our findings will generalise to other settings. Although prior analyses have focused on clinical interpretation, they tended to report measures of relative effect such as ORs or HRs, which cannot be used to directly assess the relative importance of categorical and continuous variables or of transformed continuous variables. Therefore, we also reported metrics that quantified the relative importance of each predictor.
The strength of the relationship between mortality and age was consistent with other studies including Gupta et al,26 who evaluated the performance of models from 19 studies (14 of which were COVID-19 specific) on an independent dataset of 411 patients hospitalised for COVID-19 in the UK and found that no other variables added additional incremental value beyond age. Age may be a strong predictor because while it is correlated with the comorbidities specified in the model, it also likely captures other unspecified comorbidities that may be associated with worse outcomes. Additionally, age may be associated with altered immune function that could result in slower viral clearance, or a hyperactive immune response that could contribute to severe clinical manifestations of the disease.38
Our results also differ from Gupta et al26 in that laboratory results and vital signs added non-negligible incremental value to the discriminative ability of our predictions. Oxygen saturation, temperature and respiration rate were among the most important risk factors in the model, which is consistent with other models of mortality, both among patients with COVID-1922 25 39 and in more general populations.40–42 The positive relationship between higher levels of BMI and mortality was consistent with prior research.43 44
Troponin I, LDH and PLT were among the most important laboratory results, which has been documented elsewhere.5 45 46 Troponin and LDH elevations may reflect more severe microvascular dysfunction which could lead to myocardial and other end-organ injury. Lower PLT counts could reflect increased consumption due to macrothromboses and microthromboses, which have been described clinically and in autopsy studies,47 and which may be associated with and exacerbate microvascular dysfunction. Of note, the lasso model selected WBC and lymphocyte count for inclusion and excluded neutrophil count. We explored this further by running a separate model omitting WBC and found that neutrophil count had similar variable importance to WBC in this specification. Neutrophil count also had a strong relationship with mortality in univariate fits (online supplemental file 1 section 3). Our results are therefore consistent with prior work showing that mortality is associated with lower lymphocyte and higher neutrophil counts.48 49 We did not find an association between ferritin and mortality despite studies showing that severe illness is characterised by hyperferritinaemia.50
Finally, while comorbidities added little prognostic information beyond age, it is important to distinguish these findings from those based on a general population diagnosed with COVID-19, since risk factors that are predictive of hospitalisation (or death in the general population) may not be predictive of mortality conditional on hospitalisation. Petrilli et al45 provide some evidence consistent with this in that comorbidities were more important predictors of hospital admission than of severe illness and mortality among hospitalised patients.
On the other hand, a number of studies have also found evidence that even in hospitalised populations, comorbidities such as hypertension, cardiovascular disease, CPD, and diabetes were predictive of severe illness or mortality.43 51–54 One potential reason that comorbidities were less important in our model is that we controlled for laboratory results and vitals, which may be mediators for demographics and comorbidities (online supplemental file 1 section 10). We assessed this in online supplemental file 1 section 11 by removing laboratory results and vitals from the model: the ORs were very similar, although female sex was a notable exception as the OR changed from approximately 0.7 to almost 1. While including predictors for laboratory results and vitals does not seem to impact the qualitative interpretation of the predictor effects in most cases, it is worth emphasising that our findings are not necessarily inconsistent with the other studies since comorbidities and BMI tended to be ‘statistically significant’ despite not meaningfully improving predictive performance. Furthermore, the wide range of mortality reported in case series of patients with severe COVID-19 may indicate that factors that predict severe disease do not necessarily predict mortality.55 56
Implications of this study
The most obvious use case of the findings in this paper is to inform the development of mortality prediction models for patients admitted to the hospital in the USA. The variable importance rankings can be used for variable selection and the predictor effects can help guide specification of the functional forms of the included predictors. However, since mortality rates have changed over time, we would recommend re-estimating the model on more recent data prior to implementation in a clinical setting.
The findings related to variable selection and model specification are also relevant outside of prediction modelling. Observational studies that compare the efficacy of treatments for patients admitted to the hospital with severe disease are a good example. Such studies frequently use propensity score methods in order to minimise confounding and a number of studies recommend estimating the propensity score using the most important prognostic factors.57–59
Study limitations
This study is not without limitations. First, there were considerable missing data, especially for laboratory results. We attempted to overcome this limitation using multiple imputation, although the coefficient estimates are only guaranteed to be unbiased if the data are missing at random and the missing mechanism is known. While this is an untestable assumption, our diagnostics were not suggestive of problems in the imputation as the distribution of the observed and imputed data was very similar.
Second, many of the laboratory results contained outliers. Although we truncated these variables to improve fit, predictions for new patients with extreme laboratory values lying outside of the chosen bounds are inherently uncertain. The presence of outliers could also imply that some laboratory values have been miscoded. This miscoding is a form of measurement error that would attenuate the relationship between mortality and the laboratory values.60 61
Third, we did not have out-of-hospital mortality data. Mortality could have consequently been underestimated if patients were discharged from the hospital and later died at home from COVID-19. Evidence suggests that COVID-19 deaths outside the hospital comprise 38% of all deaths, but since the proportion of those 38% who were previously hospitalised is unknown, it is difficult to calibrate the extent of this potential bias.12 Estimates of in-hospital mortality might have also been underestimated if some patients had neither recovered nor died by the end of follow-up, although we did aim to mitigate this risk by dropping all observations with index dates less than 2 weeks from the data release date and controlling for calendar time in our models. Future work could consider time to event analyses to test the sensitivity of our results to right censoring. Since discharge is a competing risk for death, a competing risk framework should be used in cases where out-of-hospital mortality is unavailable.
Conclusion
We developed a prognostic model of mortality with a cohort of over 17 000 patients hospitalised with COVID-19 in the USA using information on demographic, comorbidities, laboratory results and vital signs. We addressed many of the limitations of prior studies by using a large geographically diverse US database, assessing calibration, performing validation using bootstrap resampling and a random training/test split, and providing detailed descriptions of the study population and statistical methods in the supplemental material . Age was the strongest predictor of mortality and the predictive performance of a model that only included age was nearly identical to a model containing additional demographic information (age, sex, race/ethnicity, geographical location, smoking status and calendar time) and a model containing information on both demographics and comorbidities. However, vital signs and laboratory results did add prognostic information beyond age. Overall, these results suggest that age, vital signs and laboratory results may be useful to assess the prognosis of hospitalised patients, although external validation on new data is needed.
Data availability statement
Data may be obtained from a third party and are not publicly available. Data for this study were licensed from Optum. While we are unfortunately not able to publicly share the data, an R Markdown HTML document (with all code and output for the manuscript as well as supplemental analyses) is available at https://github.com/phcanalytics/covid19-prognostic-model and in online supplemental file 2. Interested researchers may contact Optum for data access requests. All interested researchers can access the data in the same manner as the authors. The authors had no special access privileges.
Ethics statements
Ethics approval
The use of Optum de-identified COVID-19 database was reviewed by the New England Institutional Review Board (IRB) and was determined to be exempt from broad IRB approval, as this study did not involve human subject research.
References
Supplementary materials
Supplementary Data
This web only file has been produced by the BMJ Publishing Group from an electronic file supplied by the author(s) and has not been edited for content.
Footnotes
Contributors DI, SR, and XL designed the study, developed codes to create the cohorts and performed the statistical analyses. DI and SR drafted the manuscript. DI, SR, XL, LL, VY, DK and JC helped refine the methodology. DI, SR, XL, LL, VY, DK, JC and LT contributed to interpretation of the results and critically reviewed and revised drafts of the manuscript. DI is the guarantor.
Funding The authors have not declared a specific grant for this research from any funding agency in the public, commercial or not-for-profit sectors.
Competing interests All authors are employees of Genentech, a member of the Roche Group.
Provenance and peer review Not commissioned; externally peer reviewed.
Supplemental material This content has been supplied by the author(s). It has not been vetted by BMJ Publishing Group Limited (BMJ) and may not have been peer-reviewed. Any opinions or recommendations discussed are solely those of the author(s) and are not endorsed by BMJ. BMJ disclaims all liability and responsibility arising from any reliance placed on the content. Where the content includes any translated material, BMJ does not warrant the accuracy and reliability of the translations (including but not limited to local regulations, clinical guidelines, terminology, drug names and drug dosages), and is not responsible for any error and/or omissions arising from translation and adaptation or otherwise.