Article Text

Abstract
Objectives Multimorbidity is the coexistence of two or more health conditions in an individual. Multimorbidity in younger adults is increasingly recognised as an important challenge. We assessed the prevalence of secondary care multimorbidity in mid-life and its association with premature mortality over 15 years of follow-up, in the Aberdeen Children of the 1950s (ACONF) cohort.
Method A prospective cohort study using linked electronic health and mortality records. Scottish ACONF participants were linked to their Scottish Morbidity Record hospital episode data and mortality records. Multimorbidity was defined as two or more conditions and was assessed using healthcare records in 2001 when the participants were aged between 45 and 51 years. The association between multimorbidity and mortality over 15 years of follow-up (to ages 60–66 years) was assessed using Cox proportional hazards regression. There was also adjustment for key covariates: age, gender, social class at birth, intelligence at age 7, secondary school type, educational attainment, alcohol, smoking, body mass index and adult social class.
Results Of 9625 participants (51% males), 3% had multimorbidity. The death rate per 1000 person-years was 28.4 (95% CI 23.2 to 34.8) in those with multimorbidity and 5.7 (95% CI 5.3 to 6.1) in those without. In relation to the reference group of those with no multimorbidity, those with multimorbidity had a mortality HR of 4.5 (95% CI 3.4 to 6.0) over 15 years and this association remained when fully adjusted for the covariates (HR 2.5 (95% CI 1.5 to 4.0)).
Conclusion Multimorbidity prevalence was 3% in mid-life when measured using secondary care administrative data. Multimorbidity in mid-life was associated with premature mortality.
- multimorbidity
- premature mortality
- cohort
This is an open access article distributed in accordance with the Creative Commons Attribution Non Commercial (CC BY-NC 4.0) license, which permits others to distribute, remix, adapt, build upon this work non-commercially, and license their derivative works on different terms, provided the original work is properly cited, appropriate credit is given, any changes made indicated, and the use is non-commercial. See: http://creativecommons.org/licenses/by-nc/4.0/.
Statistics from Altmetric.com
Strengths and limitations of this study
We used a large population cohort, with detailed early and mid-life data which were linked to high-quality Scottish hospital episode and mortality data.
The advantages of using administrative data include being able to achieve a large sample size at relatively low cost, better population coverage and the ability to follow-up over long periods of time.
We did not have regular status updates for the study population; therefore, we acknowledge that some of our population may have temporarily resided outside of Scotland during the 5-year lookback period and thus any healthcare contacts would not be recorded.
Introduction
Multimorbidity is commonly defined as the coexistence of two or more health conditions within an individual.1 2 It is becoming an increasing challenge for individuals and health and social care services.3–6 Understanding its impact across the life course forms a crucial part of addressing its impact. However, there is a lack of longitudinal research into the determinants and outcomes of multimorbidity using large study populations.3 4 7
Studies have shown that while multimorbidity prevalence is higher in older adults, in terms of absolute numbers there are more multimorbid young and middle-aged people.8–10 A retrospective cohort study in Hong Kong, which used hospital data to measure multimorbidity, found that middle-aged patients with multimorbidity had a greater number of hospital admissions than older patients.11 There is recognition of the need for greater understanding of the determinants and outcomes of multimorbidity in middle-aged adults.11 12
Research in a variety of populations, using a range of multimorbidity definitions and measures, has found multimorbidity to be associated with increased mortality.3 13 14 However, the relationship between multimorbidity in mid-life and premature mortality (defined by the WHO as being less than 70 years)15 is less well characterised. Recent analyses have demonstrated that the trend for increasing life expectancy observed throughout the 20th century in high-income countries has stalled and in some cases reversed.16–19 Further to this, non-communicable diseases are a significant source of premature mortality,15 17 indicating that exploration of this for multimorbidity is important.
Multimorbidity can be measured in a variety of ways (eg, by self-report, using primary care data, using prescription data or hospital records) and each captures a different burden of multimorbidity.1 2 There is no gold-standard measure and so it is important that researchers are clear regarding the approach they have taken to allow interpretation.2 Multimorbidity measured using hospital (secondary care) data provides assessment of the burden placed on both individuals and health services. Using existing healthcare records (administrative data) is a cost-effective route to assess multimorbidity from these perspectives.20 Much multimorbidity research using secondary care records is based in patient populations and much is focused on older adults.11 21–25 Identifying whether multimorbidity measured using secondary care data in middle-aged adults in the general population is associated with premature mortality is a potential route by which to identify high-risk individuals and inform healthcare and public health research and action.
The Aberdeen Children of the 1950s (ACONF) is a large Scottish population-based birth cohort with very detailed early and mid-life information.26 Participants have been linked to their secondary care administrative data (from which secondary care multimorbidity can be measured) and mortality records. The aim of this study is to assess the prevalence of secondary care multimorbidity in mid-life, and its association with premature mortality over 15 years of follow-up, in the ACONF cohort.
Method
Study design and population
The study reporting followed the REporting of studies Conducted using Observational Routinely-collected Data (RECORD) guidelines.27 This was a prospective cohort study using linked electronic health and mortality records.
The ACONF is described in detail elsewhere.26 It contains 12 150 individuals born in Aberdeen in the North of Scotland, between 1950 and 1956. There are data on early life factors such as social class at birth and the results of cognitive testing. In 2001, 7184 participated in a postal questionnaire, providing self-reported information on health, well-being, social and environmental characteristics. The ACONF is flagged for deaths and embarks across the UK.
Patient and public involvement
No patients or public were directly involved in the development of the research question, selection of the outcome measures, design and implementation of the study or interpretation of the results.
Data linkage and data management
Healthcare in Scotland is delivered by the National Health Service (NHS), a free at the point of use nationally funded universal care system.28 We used Scottish Morbidity Record (SMR) hospital episode data from general/acute (SMR01) and psychiatric (SMR04) admissions to measure multimorbidity. We supplemented this with the Scottish Cancer Registry (SMR06) which includes data on dates of malignant cancer diagnoses.29The SMR01 and SMR04 are formed from discharge records. On discharge from hospital, the reason for admission and up to five supplementary conditions (these can include active and historical conditions) are coded using the International Classification of Disease (ICD) system. The SMRs are held nationally by the Information Services Division (ISD).30 Death certificate data (including the date of death) is held by the National Records of Scotland.31
In Scotland, ISD support the coding process and provide training, support, validation and quality assurance checks of data. In SMR01 (general and acute admissions), the accuracy rate of coding for the ‘Main Condition’ has been found to be 89% (not statistically significantly different from the ISD-recommended minimum standard of 90%).32 Specific checking of a range of common conditions (eg, stroke, alcohol misuse and diabetes) found that the overall accuracy rate was 96% but almost 20% were under-recorded.32
SMR04 (psychiatric admissions) accuracy is lower than SMR01, with ‘Main Condition’ found to be 78% nationally and ‘Other Conditions’ at 73%.33 Under-recording of key psychiatric and non-psychiatric diagnoses (including dementia and mood disorders) was almost 30%.33
The SMR06 cancer registry has not been quality assessed by ISD in the same manner. However, research suggests quality is high. A study found agreement in coding of the major tumour site category in 97% of cases, when comparing the registry to the medical record.34In our own assessment of the agreement between SMR01 and SMR06, we found it to be 99% with kappa statistic of 0.75 indicating substantial agreement (see online supplementary table 1).
Supplemental material
Linkage of individuals to electronic health and mortality records was achieved using the Community Health Index (CHI). The CHI number is a unique 10-digit identifier allocated to a patient on first registration with the NHS system. ISD conducted seeding (attaching CHI numbers) of the ACONF members’ data, with 89% of the original 12 150 seeded. ISD then conducted linkage between the ACONF and the SMRs and mortality data using the CHI number (deterministic matching).
The study population and the data linkage processes are summarised in figure 1. As multimorbidity is measured from Scottish SMR data in 2001, we included all ACONF participants living in Scotland on 30 September 2001, who were CHI seeded. Furthermore, to conduct survival analysis for mortality, study participants were those who had complete follow-up data to 2016 (were known to be resident in Scotland or the UK or who had a recorded death from Scotland or elsewhere). Those who were lost to follow-up or who embarked from the UK between 2001 and 2016 were excluded (n=50) as the precise date of loss to follow-up/embarkation was unknown and any subsequent death will not be detected.

Flow chart of ACONF study population and data linkage. *Lost to follow-up or embarked from the UK. ACONF, Aberdeen Children of the 1950s; CHI, Community Health Index; SMR, Scottish Morbidity Record.
The Grampian Data Safe Haven (DaSH) oversaw data management and security. To quality assure the linkage between the ACONF and administrative data, representatives from DaSH and ISD viewed a sample of the identifiers from the original cohort and the linked data sets, with no discrepancies found. The research team had access to an anonymised data set that contained all study participants and their linked SMR and death records. Data cleaning carried out by the study team included checking no admissions had occurred for an individual after their death, checking that gender from the SMR matched the gender recorded in the original ACONF data set and checking that prevalence figures (gender, postal questionnaire response and social class at birth) matched previous ACONF publications. Minor discrepancies were resolved after discussion with ISD and the ACONF study coordinator.
Exposure: multimorbidity
Multimorbidity was defined as two or more conditions from the Barnett multimorbidity measure, an emerging consensus measure of multimorbidity.8 It is a disease count measure, developed using Scottish primary care specific codes.8 A review of the coding literature was combined with codes used commonly by the NHS in Scotland to apply ICD codes to each condition. The list of conditions, the methodology and ICD codes are given in online supplementary table 2.
The index date was 30 September 2001 and a 5-year look back was used (to 1 October 1996). The index date was selected on the basis of being representative of mid-life. A 5-year look back means that any Barnett condition coded during the 5 years including and prior to the index date is recorded as part of the morbidity count. A condition was only counted once even if there had been multiple occurrences. A lookback period is standard practice when measuring the prevalence of morbidities using administrative data. It is needed because the record of the reasons for a single admission will likely miss conditions which are important but happen not to have been active during that admission. We set the look back at 5 years based on the evidence that it is of sufficient length to ascertain chronic disease status and to model outcomes such as mortality.35 36
The ICD is in its 10th revision (ICD-10), but the ICD-9 was used by ISD until 1996.37 Therefore, both ICD-9 and ICD-10 codes were used in this study.
Outcome: premature mortality
The mortality rate was based on deaths occurring from 1 October 2001 to 30 September 2016. The death dates were sourced from linked Scottish mortality data or from routine flagging for deaths in the rest of the UK. Premature mortality was defined as deaths occurring before 70 years of age. The full follow-up period available for ACONF was to between 60 and 66 years of age.
Early-life covariates
Social class at birth
Social class at birth was based on the father’s occupation at the birth of the participant and is coded using the General Register Office’s Occupational classification (1950).38 This information was sourced from participant birth records in the Aberdeen Maternity and Neonatal Databank. Social class categories ranged from I (professional) to V (unskilled) and there was an additional category for those whose fathers were unemployed, unknown, disabled or dead at the time of the participant’s birth. This latter category combines a diverse range of paternal status but all share the characteristic that the father is not providing income. Arguably the impact of each would be similar in the 1950s, where the father was traditionally the main source of financial income for a household. Social class is included as it is an important determinant of both multimorbidity and mortality.39 40
Childhood intelligence
Routine intelligence tests were carried out at the age of 7 in the 1950s and 1960s in Aberdeen. The test involved using the Moray House Picture Intelligence Tests (numbers 1 or 2) to screen for learning disability.26 41 The test was age-standardised for Scotland as a whole (mean of 100, SD of 15).41 Childhood intelligence is included as it is known to be linked to early mortality and with a range of morbidities including coronary heart disease and stroke.42–44
Postal questionnaire covariates
Educational attainment
Participants reported their highest qualification, ranging from ‘no formal qualifications’ through ‘degree level’. Attainment was summarised in five categories. Educational attainment has been found to be associated with multimorbidity and mortality.39 45
Secondary school type
Selective schooling for secondary education was in place in Aberdeen in the 1950s and 1960s. The results of childhood intelligence tests and teacher assessment were used to stream children into ‘elite schools’ (which included private schools) for those deemed to be more academically able and ‘non-elite schools’ for those defined as less academically able.46 ‘Elite’ schools consisted of three non-private and three private schools, ‘non-elite’ contained 12 non-private schools, 2 special needs schools and a convent. This is included as it influences educational attainment.46
Adult social class
The Registrar General’s social classes became the Standard Occupational Classification in 1990 (SOC90)47 and the adult social class categories were formed using SOC90. Adult social class was categorised in the same manner as that of the birth social class (other than not including a category for the father being unemployed, unknown, disabled or dead). Social class is associated with both multimorbidity and mortality.39 40
Adult body mass index (BMI), smoking status and alcohol-related hangover frequency
BMI, smoking status and alcohol consumption have been shown to be risk factors for morbidity, multimorbidity and mortality.48–52 BMI was derived from self-reported height and weight using the standard calculation: weight (kg)/height (m2). Normal weight is classed as a BMI between 18.5 and 24.9. BMI was a continuous variable. Smoking was categorised as current, past and never-smoked. There was no question about average alcohol consumption and as a proxy a question regarding the frequency of hangovers was used (a categorical variable).
Statistical analysis
Analyses were conducted using STATA V.13. Statistical significance was set at the 5% level. Baseline characteristics were summarised by frequencies, proportions and 95% CIs or means with SDs where appropriate. The prevalence of morbidities and of multimorbidity were presented. The relationship between each characteristic and multimorbidity was assessed using the χ2 test for nominal variables, the χ2 test for trend for ordinal variables and the independent t-test for normally distributed continuous variables.
For survival analysis, contributions of risk were censored at the earliest of the following: (1) death date recorded after 30 September 2001 and (2) 30 September 2016 (end of the follow-up period). The cohort survival by multimorbidity status, from 1 October 2001 to 30 September 2016, was presented in a Kaplan-Meier survival curve. The mortality rate per 1000 person-years was calculated. Cox proportional hazards regression was used to assess the association between multimorbidity in 2001 and mortality rate to 2016. The analysis was first conducted unadjusted and then with adjustment for age and gender. Finally, there was adjustment for these variables plus social class at birth, intelligence at age 7 and the postal questionnaire variables (highest educational attainment, secondary school type, adult social class, BMI, smoking status and hangover frequency). HRs with 95% CIs were presented.
Missing data
There were no missing data for the exposure or outcome, or for age and gender. In the model adjusted by further variables, those from the postal questionnaire were subject to missing data due to the questionnaire response rate. However, there was insufficient information in the data set to impute missing values (the data were missing not at random (MNAR)). Complete case analysis (CCA) was therefore conducted.
Ethical approval
The ACONF data set is registered with the National Research Ethics Service (NRES) as a research database. The North of Scotland NRES confirmed that no further ethical approval was required. We gained permission from the ACONF steering committee as well as from the national ‘Privacy Advisory Committee’ (now called the ‘Public Benefit and Privacy Panel for Health and Social Care’) to link and use Scottish administrative data.
Results
The cohort comprised 9625 individuals and contributed 146 472 person-years at risk over a 15-year follow-up period. The baseline characteristics of the population are shown in table 1. 51% were males and the mean age was 48 (range 45–51 years). The majority had a father in ‘social class III (skilled manual)’ at their own birth (44%). The mean intelligence score was 107 (SD 16.2). Almost 66% had responded to the postal questionnaire. The majority (72%) attended a ‘non-elite’ school. The single largest qualification category was ‘ordinary level’ (29%), and the largest adult social class category was ‘I/II (professional/managerial)’ (39%). The mean BMI was 27 (SD 4.8). The largest smoking category was ‘non-smoker’ (48%) and most reported having hangovers less than once a month (40%) or not at all in the last year (46%).
Baseline characteristics of ACONF cohort and association with MM status*
The prevalence of individual morbidities are presented in table 2. The most common conditions were ‘pain’ (5%), ‘alcohol misuse’ (1%) and cancer (1%). The least common (affecting less than 10 individuals) included Parkinson’s disease and dementia.
Frequency of Barnett conditions in the ACONF cohort in 2001, ordered from highest to lowest from left, down columns, to right
The baseline characteristics by multimorbidity are shown in table 1. The prevalence of multimorbidity was 2.6%. There was no association with age, gender, social class at birth, secondary school type, educational attainment, adult BMI or hangover frequency. The mean intelligence score at age 7 was lower in those with multimorbidity (mean of 100 (SD 16.5) compared with 107 (SD 16.2), p<0.001). Those who responded to the postal questionnaire had a lower prevalence of multimorbidity (2.3% (1.9%–2.7%) compared with 3.3% (2.7%–4.0%), p=0.003). Those with a lower adult social class had a higher prevalence of multimorbidity (p=0.043). For example, the prevalence in I/II (professional/managerial) was 1.6% (95% CI 1.2% to 2.2%) and the prevalence in V (unskilled) was 3.8% (95% CI 2.1% to 6.7%). There was an association between smoking status and multimorbidity (p<0.001). For example, those who were current smokers had a higher prevalence than those who were non-smokers (prevalence of 3.6% (95% CI 2.8% to 4.5%) in the former and 1.3% (95% CI 1.0% to 1.8%) in the latter).
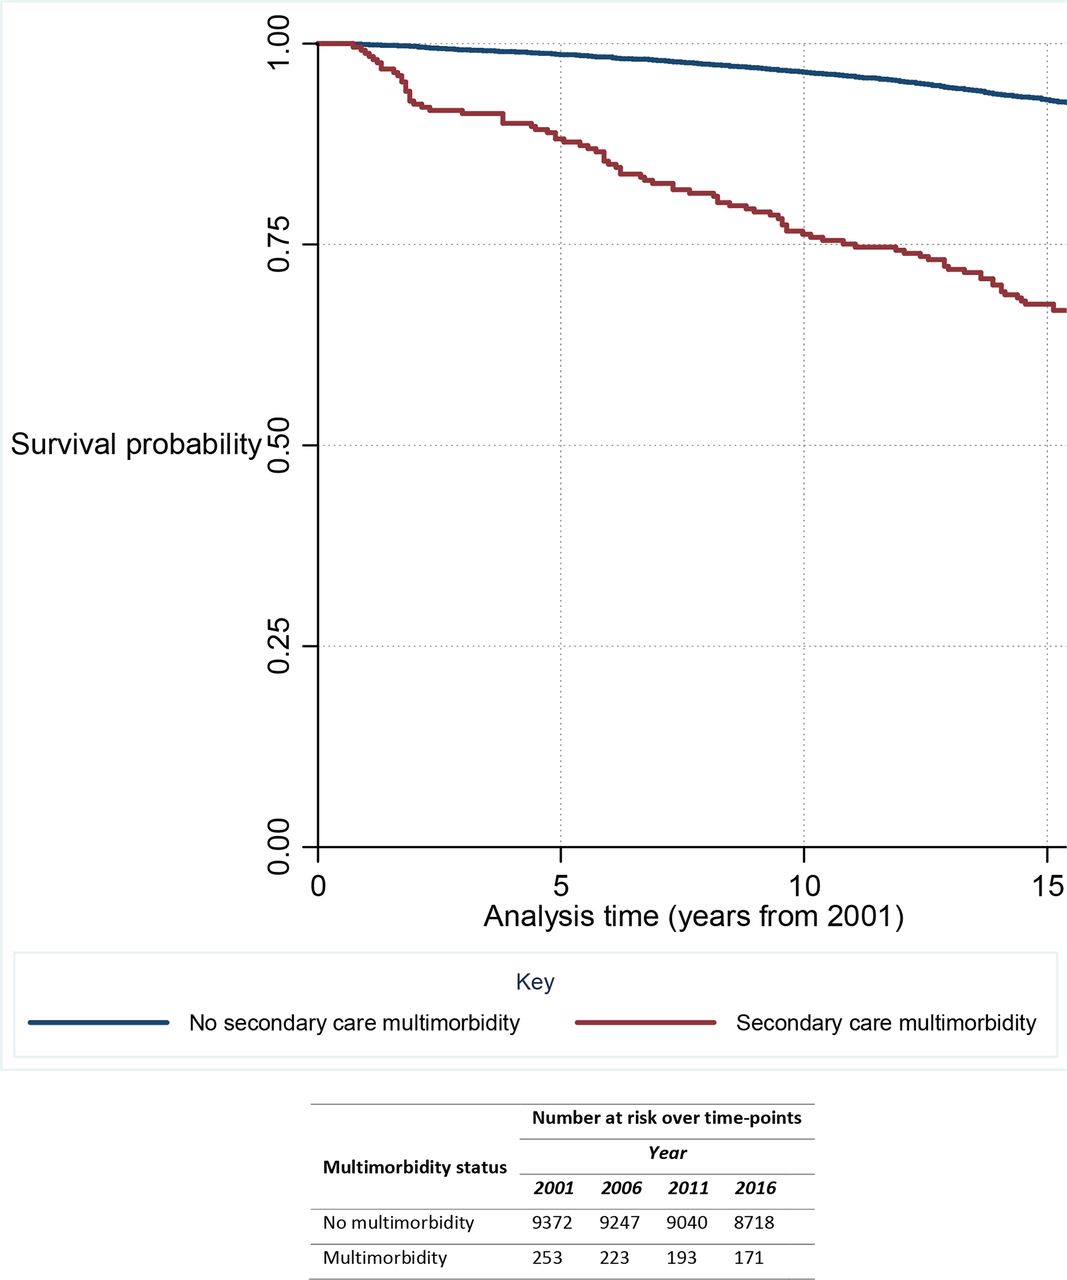
The survival curve for the relationship between multimorbidity and mortality is given in figure 2. Survival was lower in those with multimorbidity, and the gap between those with and without multimorbidity was widening over time. The death rate per 1000 person-years is illustrated in table 3. There were 911 deaths in total, of which 93 were in those with multimorbidity. The death rate per 1000 person-years was 28.4 (95% CI 23.2 to 34.8) in those with multimorbidity and 5.7 (95% CI 5.3 to 6.1) in those without multimorbidity.

Survival curve for multimorbidity from 2001 to 2016 with indication of number at risk over time.
Mortality rate per 1000 person-years in ACONF cohort by multimorbidity status (n=9625)
The Cox regression results of the association between multimorbidity and mortality is given in table 4. In the unadjusted model (n=9625), in relation to the reference group of no multimorbidity, those with multimorbidity in 2001 had a mortality HR of 4.5 (95% CI 3.4 to 6.0). This was broadly unchanged when adjusted by age and gender (HR 4.5 (95% CI 3.7 to 5.6)). When further adjusted by the remaining covariates (n=5534), the finding of an association with mortality did not change (HR 2.5 (95% CI 1.5 to 4.0)). All three models were statistically significant for the association between multimorbidity and mortality (p<0.001).
Association between multimorbidity and mortality rates in ACONF cohort
Discussion
In this large population-based cohort with 146 472 person-years of follow-up, multimorbidity in mid-life was associated with an increased risk of premature mortality over a 15-year follow-up period. Multimorbidity prevalence, as measured using secondary care data in mid-life with a 5 year lookback period, was close to 3%.
While our finding that multimorbidity is associated with mortality is consistent with others,3 13 14 the association between multimorbidity in younger adults and premature mortality is less well explored in the literature. A recent systematic review and meta-analysis by Nunes et al included 26 studies and concluded that multimorbidity (regardless of measure) increased mortality.14 However, it was limited to adults aged 60 years and older.14 The review found that hospital-based studies showed stronger associations than population-based studies; however, they found that studies generally did not adjust adequately for explanatory variables,14 unlike the approach our own study has taken.
Much of the literature in relation to multimorbidity and life expectancy discusses it in terms of multimorbidity becoming an increasing challenge as our population ages and people live longer with multiple conditions.3 14 22 23 Our study highlights that multimorbidity in younger adults needs to be considered when tackling the challenge of premature mortality. This is particularly important given evidence showing the absolute number of individuals with multimorbidity is higher in younger adults compared with older adults.8–10
Multimorbidity prevalence figures in the literature vary widely, frequently due to the heterogeneity of measures used. Differences between studies in terms of the population included, the source of the data and the design of healthcare systems also influence the prevalence. A systematic review of multimorbidity prevalence studies by Fortin and colleagues found figures ranged from just over 3% to almost 100%.1 None of the included measures were comparable to ours.
The Barnett study found that the prevalence of multimorbidity was 30% in those aged 45–64 years (the age range most comparable to this study).8 However, this was a primary care population and it is reasonable to hypothesise that individuals in mid-life are more likely to use primary care services than secondary care services. Evidence shows that as individuals age the likelihood they will develop conditions severe enough to warrant admission will increase.53 Furthermore, primary care services in Scotland not only provide a ‘gatekeeping’ role but also provide care for many acute and chronic conditions which have previously required hospital admission.54
In univariate analysis, we found that lower childhood intelligence was associated with secondary care multimorbidity. This is consistent with other studies of childhood intelligence and health,55 but has not been widely studied for multimorbidity specifically. We found an association between adult social class and multimorbidity, which is consistent with the literature.3 56 We did not find an association between multimorbidity and gender, social class at birth, secondary school type, educational attainment or hangover frequency. These findings are contrary to some other studies, for example those finding a relationship between multimorbidity and gender.3 56 Our previous work examining self-reported multimorbidity in the ACONF found that it was associated with birth social class and education.39 This highlights that different multimorbidity measures capture different aspects of its burden.
There are a number of strengths and weaknesses in our approach. We have contributed toward addressing the need for large-scale longitudinal studies of multimorbidity and have demonstrated the role multimorbidity in younger adults plays in premature mortality.3 4 7 56 We used a large population cohort, with detailed early and mid-life data which were linked to high-quality Scottish SMR and mortality data.30 The advantages of using administrative data include being able to achieve a large sample size at relatively low cost, better population coverage and the ability to follow-up over long periods of time.20 Our study was based in Scotland (with follow-up information available from the rest of the UK). The results are likely generalisable to other high-income countries with publicly funded healthcare systems. However, the ACONF participants are mainly of white British or white Scottish nationality, which may limit generalisability to more ethnically diverse settings.
We chose and adapted a tool sourced from an influential multimorbidity study.8 Given the heterogeneity of multimorbidity definitions and measures in the field, we have been careful to be explicit about our tool used and the reason for choosing it. This enables the comparison of findings across different settings and assists with developing consensus on the most appropriate measures to use in different scenarios.2 Similarly, we have been clear that our measure is one of ‘secondary care’ multimorbidity, since the data used to measure it are from hospital records. Individuals must have a hospital admission to be eligible for measurement of this form of multimorbidity. But crucially we know which individuals have not had a hospital admission (and thus do not have this form of multimorbidity) and so our study population is wider than solely hospitalised patients. We did not include hospitalisation frequency in our univariate analysis or survival model because multimorbidity is a derived variable from hospital admissions (and thus the two would be highly correlated leading to multicollinearity).
Each discharge record provides up to six recorded conditions and we recognise that if more conditions are recorded, the prevalence of multimorbidity may be greater. While the accuracy of coding in the data sets is reasonably high, there have been issues identified with under-recording. Again, the prevalence of multimorbidity may be greater. However, the use of a 5-year lookback period helps mitigate these issues as it allows more opportunities for conditions to be captured within an individual’s multimorbidity measure.
Another important consideration is that the time of coding of a condition does not necessarily reflect the incidence of that condition or show that it is currently active. For example, in the supplementary conditions coders are able to include any other condition documented in the entire patient case note. However, it is valid to include these given that conditions which are not currently active may still impact on individuals, their use of services and their outcomes.8 57 58 Thus while we use the term ‘prevalence’, like many other studies our assessment is more of the ‘burden’ of multimorbidity.
Premature mortality was defined as death before the age of 70. Our survival analysis was to between ages 60 and 66 years (using the full available follow-up of ACONF at the current time). Thus, we have likely underestimated the full burden of premature mortality in those with multimorbidity.
Missing data imputation techniques were not used to impute data for those without linked data or postal questionnaire data, as the data were deemed MNAR (ie, there was insufficient information in the data set to inform the mechanism of the missing data). This is the correct approach methodologically as imputing when data are MNAR may lead to as much, or even more, bias than CCA.59
We did not have regular status updates for the study population; therefore, we acknowledge that some of our population may have temporarily resided outside of Scotland during the 5-year lookback period and any healthcare contacts would not be recorded. This may underestimate the prevalence of multimorbidity. We hypothesise that the impact of this on our results would be low as it is known this cohort has a high degree of geographical stability.26
Our study focused on ACONF members who were Scottish residents to access linked hospital episode data. There is currently no capability to link ACONF members who are in the rest of the UK with their administrative data. However, any individuals who moved but remained in the UK or had a death anywhere in the UK after the index date could be included. A proportion of the population were excluded as they did not have full follow-up information to 2016 (0.5%), but this figure is low and so it is unlikely to impact on our findings significantly.
The findings have a number of implications. Recent concerning statistics show the slowing and reversing of life expectancy rises in high-income countries. Drivers for this are complex and multifactorial (with government austerity measures and rising inequality described cited as possible factors).16–19 Our results highlight that younger adults with multimorbidity represent an important group at risk of premature mortality. It has been highlighted that reductions in life expectancy are more marked among poorer socioeconomic groups.16–18 We also found an association between multimorbidity and adult socioeconomic status, indicating this group may contribute toward inequalities in life expectancy reductions.
With evidence also showing that younger adults with multimorbidity may have greater healthcare needs than older adults with multimorbidity,11 this population should be an important consideration for policy-makers, researchers, healthcare planners and practitioners. For example, geriatric healthcare services can offer comprehensive assessment and management of older individuals with multiple conditions, but an equivalent for younger multimorbid patients generally does not exist.
There is evidence showing that multimorbidity prevalence is increasing over time in all age groups.60 Thus, while our population had multimorbidity measured in mid-life in 2001, the same age group now may have a higher proportion of multimorbidity. This may not only lead to a higher burden of premature mortality in the future, but has significant implications for individuals and health and social care services.
We have shown that an administrative data count measure of multimorbidity, sourced from secondary care is associated with mortality. Studying health and well-being across the life course at scale can be prohibitively expensive. This study has implications for researchers in showing that these relatively low-cost sources of data can be an important resource for research. Because there may be under-recording of certain health conditions within the SMR data sets, efforts to supplement these data sets with other routinely collected secondary care data should be explored. For example, there is no national laboratory data set in Scotland, but this could be used to provide detail on conditions such as diabetes and chronic kidney disease.
In conclusion, secondary care multimorbidity in mid-life was associated with premature mortality over 15 years of follow-up in the ACONF study. We contribute toward addressing the need for large, longitudinal studies of the outcomes of multimorbidity and demonstrate the important role multimorbidity in younger adults plays in premature mortality.
Acknowledgments
We acknowledge the support of the DaSH who provided secure data storage and management. We thank the participants of the ACONF cohort study.
References
Footnotes
Contributors Study conception: MCJ. Study design: MCJ, CB, SWM, GJP and MAC. Study analysis: MCJ. Supervision and contribution to study analysis: CB, SWM, GJP and MAC. Drafting of article: MCJ. Critical revision of the article for important intellectual content: MCJ, CB, SWM, GJP and MAC. Final approval of article: MCJ, CB, SWM, GJP and MAC.
Funding MCJ was funded by a Clinical Academic Fellowship from the Chief Scientist Office, Scotland (CAF/13/03), and was a PhD student affiliated with the Farr Institute of Health Informatics and Research Scotland.
Competing interests None declared.
Patient and public involvement Patients and/or the public were not involved in the design, or conduct, or reporting, or dissemination plans of this research.
Patient consent for publication Not required.
Provenance and peer review Not commissioned; externally peer reviewed.
Data availability statement Data can be shared via the DaSH with accredited researchers who have appropriate approvals in place.