Article Text

Abstract
Objectives To examine the effect of short-term exposure to ambient fine particulate matter (PM2.5) on all-cause, cardiovascular and respiratory-related hospital admissions and readmissions among patients receiving outpatient haemodialysis.
Design Retrospective cohort study.
Setting Inpatient hospitalisation claims identified from the US Renal Data System in 530 US counties.
Participants All patients receiving in-centre haemodialysis between 2008 and 2014.
Primary and secondary outcome measures Risk of all-cause, cardiovascular and respiratory-related hospital admissions and 30-day all-cause and cause-specific readmission following an all-cause, cardiovascular, and respiratory-related discharges. Readmission risk was evaluated for early (1–7 days postdischarge) and late (8–30 days postdischarge) readmission time periods. Relative risk is expressed per 10 μg/m3 of PM2.5.
Results Same-day ambient PM2.5 was associated with increased hospital admission risk for cardiovascular causes (0.9%, 95% CI 0.2 to 1.7). Greater PM2.5-related associations were observed with 30-day readmission risk. Early-readmission risk was increased by 1.6%–1.8% following all-cause (1.6%, 95% CI 0.6% to 2.6%), cardiovascular (1.8%, 95% CI 0.4% to 3.2%) and respiratory (1.8%, 95% CI 0.4% to 3.2%) discharges; while late-readmission risk increased by 1.2%–1.3% following all-cause and cardiovascular discharges. PM2.5-related associations with readmission risk were greatest for certain cause-specific readmissions ranging 4.0%–6.5% for dysrhythmia and conduction disorder, heart failure, chronic obstructive pulmonary disease, other non-cardiac chest pain or respiratory syndrome and pneumonia. Following all-cause discharges, the cause-specific early-readmission risk was increased by 6.5% (95% CI 3.5% to 9.6%) for pneumonia, 4.8% (95% CI 2.3% to 7.4%) for dysrhythmia and conduction disorder, 3.7% (95% CI 1.4% to 6.0%) for heart failure and 2.7% (95% CI 1.2% to 4.2%) for other non-cardiac chest pain or respiratory syndrome-related causes.
Conclusions Daily ambient PM2.5 was associated with an increased risk of cardiovascular admissions and 30-day readmissions following cardiopulmonary-related discharges in a vulnerable end-stage renal disease population. In the first week following discharge, greater PM2.5-related risk of rehospitalisation was identified for some diagnoses.
- epidemiology
- public health
- nephrology
This is an open access article distributed in accordance with the Creative Commons Attribution Non Commercial (CC BY-NC 4.0) license, which permits others to distribute, remix, adapt, build upon this work non-commercially, and license their derivative works on different terms, provided the original work is properly cited, appropriate credit is given, any changes made indicated, and the use is non-commercial. See: http://creativecommons.org/licenses/by-nc/4.0/.
Statistics from Altmetric.com
Strengths and limitations of this study
Nearly complete representation of hospitalisation records (>1.8 million inpatient admissions), identified using the US Renal Data System, of patients undergoing in-centre haemodialysis between 2008 and 2014.
Location of last dialysis visit was linked with daily population-weighted air pollution.
Admission risk estimated using time and county stratified design to control for county-level time trends.
Cox proportional hazard model with time-varying exposure was used to estimate readmission risk associated with daily fluctuations in ambient particulate matter (PM2.5) controlled for time-varying confounders.
Potential diagnosis misclassification from using diagnosis codes to classify cause-specific hospitalisations and exposure misclassification related to PM2.5 exposure not captured by ambient air quality near dialysis centres.
Introduction
Ambient fine particulate matter (PM2.5) is a leading risk factor for all-cause mortality,1–4 accounting for millions of premature deaths each year.5 Daily variation in ambient PM2.5 is also associated with increased rates of unplanned hospital admissions, urgent care visits and medication usage.6 7 Greater health impacts have been observed consistently in sensitive populations, including the elderly and individuals with chronic health conditions such as chronic kidney disease (CKD).3 8–11 Additionally, PM2.5 exposure during wildfire periods has been shown to increase the risk of mortality among patients managing their end-stage renal disease (ESRD) with haemodialysis.12 However, the role of short-term PM2.5 exposure at ambient levels on progression of disease and cause-specific morbidities has not been characterised.
CKD is a progressive condition that affects 8%–16% of the population worldwide,13–15 and in the final stage, ESRD, many patients are transitioned to haemodialysis to prolong life. Patients receiving dialysis represent a particularly vulnerable population because of high rates of comorbidities, including diabetes and cardiovascular disease, which may contribute to the greater likelihood of hospital admission and readmission following PM exposure. In the USA, patients on haemodialysis average 1.7 inpatient admissions annually with a 30-day readmission rate twice that of other Medicare beneficiaries,16 contributing to a substantial economic impact.17 In 2016, US$35.4 billion in Medicare fee-for-service costs were attributed to ESRD,16 motivating health promotion and cost-containment efforts to slow the progression of CKD and reduce hospitalisations and readmissions.18 While many current strategies to reduce hospitalisations focus on care processes and patient-level factors,19–22 there is a knowledge gap on the role of modifiable environmental risk factors—specifically ambient PM2.5.2 23–25
In this study, we examined the risk of daily hospitalisation and subsequent 30-day readmission in relation to daily ambient PM2.5 using data from the US Renal Data System (USRDS) over a 7-year period. We focused on all-cause, cardiovascular and respiratory hospitalisations and estimated changes in risk for early (1–7 days postdischarge) and late (8–30 days postdischarge) readmission accounting for the influence of different causal factors (ie, acute and chronic illness burden) that may influence early versus late readmissions.26 27
Methods
Setting and study population
Using patient-level data from the USRDS, we constructed an open cohort of individuals receiving in-centre haemodialysis between 2008 and 2014. USRDS is a national data registry for dialysis services and includes records of patient demographic characteristics, hospitalisations and provider information on all patients receiving haemodialysis. Baseline demographic characteristics (sex, birth date, race and smoking status) recorded at the initiation of dialysis were extracted from the Medical Evidence Form CMS-2728 for each patient. For every inpatient hospital visit, we extracted the admission date, discharge date, discharge diagnoses codes and discharge status.
For the analysis of 30-day readmission risk, we considered only admissions where patients were discharged alive. Each readmission was counted once as a readmission relative to the prior index admission and was then considered as a new index admission. Thus, each admission could serve as both an index admission and readmission, consistent with previous studies.28 An admission that occurred on the same day as a discharge was combined with the previous admission. These readmissions are likely to represent facility transfers for which we were not able to obtain information. Discharges occurring within 30 days of the end of the study period were excluded, as 30 days of follow-up data were not available. For both admissions and readmissions, patients could be represented more than once if they were admitted multiple times during the study period.
Health outcomes
The primary outcomes included daily counts of all-cause, respiratory and cardiovascular-related admissions and the time to readmission following the cause-specific discharges. All-cause and cause-specific readmissions were examined separately. Readmissions were classified further as early readmissions, occurring within 1–7 days of an index hospitalisation discharge and late readmissions, occurring 8–30 days postdischarge.
International Classification of Diseases, 9th Revision (ICD-9) codes were used to identify cause-specific hospitalisations. Cardiovascular-related diagnoses included hypertension (ICD-9 codes 401–405), myocardial infarction (410), ischaemic heart disease (410–411, 413), pulmonary embolism (415), dysrhythmia and conduction disorder (426–427), heart failure (428) and peripheral arterial disease (444). Respiratory-related diagnoses included asthma (493), chronic obstructive pulmonary disease (COPD) (491–492, 496), pneumonia (480–486) and other non-cardiac chest pain or respiratory syndrome (786).
Environmental data
Daily concentrations of fine PM2.5 were estimated using a previously described exposure prediction model.29 30 Briefly, this model estimates daily PM2.5 on a 1 km grid for the entire continental USA by incorporating satellite aerosol optical depth measurements, chemical transport model simulations, meteorology, land use and other variables. Gridded PM2.5 estimates were subsequently converted to population-weighted county-level estimates using 2010 Census tract population values. To enable adjustment for potential confounding by weather conditions, temperature and relative humidity data were obtained from the National Centers for Environmental Information’s Global Historical Climatology Network (Global Surface Summary of the Day)31 and using the Community Multiscale Air Quality model, respectively. The study area was restricted to all counties containing at least one land surface station from the Global Historical Climatology Network (n=530).
Daily PM2.5 was linked to patient hospitalisations based on the county of their last dialysis visit. Previous work has shown that patients in the USRDS cohort that receive in-centre dialysis three times a week have a median travel distance of 5.7 miles to their initial dialysis centre.32 33
Study design and statistical analysis
Daily county hospital admissions
The relative risks of hospital admissions associated with daily PM2.5 were estimated using a case-crossover design with conditional Poisson models for each of the three health outcomes separately (all-cause, cardiovascular, respiratory). Aggregated counts of daily admissions were time stratified by county-day, where each county served as its own control. For each county-day strata, PM2.5 on the day of admission was compared with PM2.5 concentrations on control days. Control days were defined as occurring on the same day of the week in the same month and year. This, by design, enabled us to control for differences in county characteristics, such as population size and risk characteristics, and the influence of day of the week, seasonal and long-term time trends.34
The relative risk of hospital admissions related to daily PM2.5 for each health outcome was estimated using daily counts with respect to county-time strata, adjusted for meteorological conditions (temperature and humidity). Temperature and humidity effects were averaged over lag days 0, 1 and 2 and modelled using natural splines (df=3) to allow for non-linear effects.35
We evaluated immediate (same day) and delayed PM2.5 effects on all-cause and cause-specific hospital admissions. Unconstrained distributed lag models were used to assess the delayed effects of short-term exposures to PM2.5. Delayed exposure up to 14 days and models stratified on county socioeconomic status were considered. To assess the impact of county socioeconomic level, we used the percent of individuals below poverty from the 2010 US Census. Associations were assessed for counties both above and below the median poverty level (12.5%).
Early and late readmissions occurring within 30 days of discharge
Cox proportional hazards models were used to assess the relative risk of early (1–7 days postdischarge) and late (8–30 days postdischarge) readmission associated with daily PM2.5 following all-cause and cause-specific index hospitalisations. Early-readmission models were censored at 7 days and late-readmission models at 30 days.
Models for readmissions incorporated both time-dependent and time-independent risk factors. Time-dependent variables included daily PM2.5, daily temperature, daily relative humidity and day-of-the-week. Time-independent factors included patient-specific, hospitalisation event-specific and county socioeconomic variables. Patient-specific variables included indicator of sex, race, baseline smoking status, whether the patient had three or more previous hospital visits in the year prior and age at discharge. Event-specific variables included whether the discharge occurred on a holiday and length of stay. To adjust for county socioeconomic level, the per cent of individuals below poverty was included as a covariate. Models were also adjusted for patient-specific clusters to account for repeated measures by individual. Lastly, models were adjusted for the competing cause of death by including death as an additional censoring criteria. The presented models represent the cause-specific readmission hazard. Non-linear PM2.5 associations were also explored.
Daily county admission and readmission risks were expressed as the rate ratio (RR) per 10-μg/m3 increase in PM2.5. The proportion hospital admissions and readmissions associated with PM2.5 is reported as the attributable fraction (AF), where AF = (RR-1) / RR.36 All statistical analyses were performed with R software (V.3.6.0).37
Results
Characterisation of clinical cohort and daily PM2.5
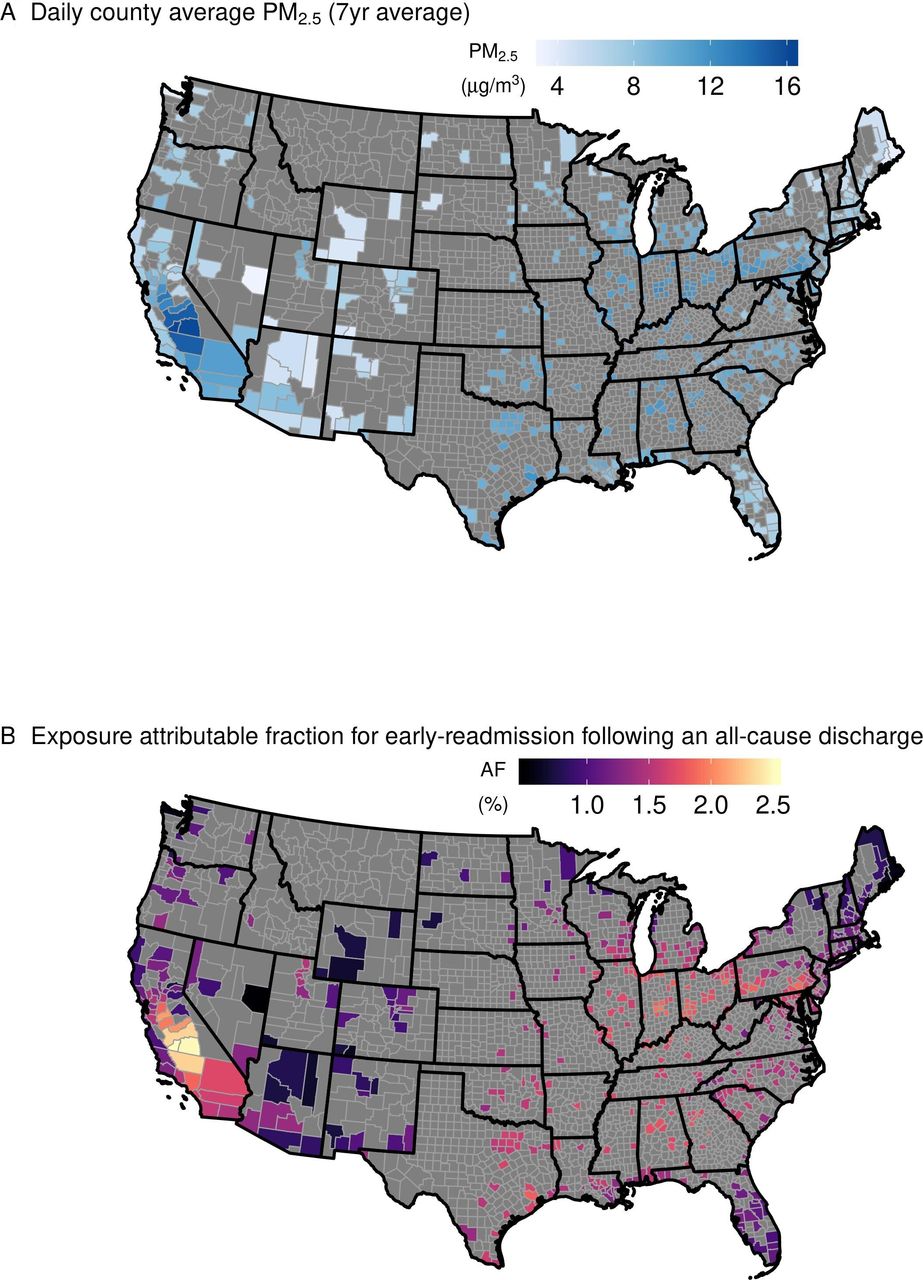
Among 361 568 patients who were hospitalised during the study period, 10 274 were excluded due to missing baseline demographic values, with 351 294 patients remaining. Demographic descriptions are in table 1. Patients had on average 2.97 hospital visits in the year prior to an admission and more than 70% of patients had at least one hospital admission related to cardiovascular and respiratory causes (table 2). The average daily county-level PM2.5 concentration was 9.3 μg/m3 (range: 0.05–155.16 µg/m3) (online supplemental table S1). The highest daily county-level PM2.5 was observed in California (online supplemental figure S1).
Supplemental material
Baseline demographic characteristics of the study population between 2008 and 2014 by hospital admission category
Hospital admission characteristics among the study population between 2008 and 2014
Description of clinical events, hospital admissions and readmissions
In total, there were 1 801 966 hospital admissions, of which 1 493 795 recorded the patient as alive at discharge. Of admissions that were discharged alive, 11.8% were readmitted within 7 days and 21.3% were readmitted 8 to 30 days postdischarge. The mean length of stay for all-cause, cardiovascular and respiratory admissions was 7.0, 7.0 and 7.1 days, respectively (table 2).
Associations between PM2.5 and readmission
Early readmission
Daily PM2.5 was positively associated with increased risk for early readmission following all-cause, cardiovascular and respiratory-related discharges. Same day (lag 0) PM2.5 was associated with a 1.6% (95% CI 0.6% to 2.6%), 1.8% (95% CI 0.4% to 3.2%) and 1.8% (95% CI 0.4% to 3.2%) increased risk of an early readmission for any cause following all-cause, cardiovascular and respiratory-related discharges, respectively (figure 1 and online supplemental table S2).

The relative risk (RR, 95% CI) for an all-cause early and late-readmission following all-cause and cause-specific discharges. Discharges are colour coded: all-cause discharges are indicated in black, cardiovascular causes in orange and respiratory causes in blue. Early readmissions are indicated with filled in circles, late readmissions with open circles. RR is expressed per 10 µg/m3 increase in particulate matter (PM2.5).
PM2.5 associated early-readmission risk was greater for certain cause-specific outcomes. Following all-cause discharges, same day (lag 0) PM2.5 was associated with increased early-readmission risk for dysrhythmia and conduction disorder (4.8%, 95% CI 2.3% to 7.4%), heart failure (3.7%, 95% CI 1.4% to 6.0%]), pneumonia 6.5%, (95% CI 3.5% to 9.6%) and other non-cardiac chest pain or respiratory syndrome (2.7%, 95% CI 1.2% to 4.2%) causes. PM2.5 associated early-readmission risk was greatest for pneumonia-related readmissions following cardiovascular-related discharges (7.5%, 95% CI 3.5% to 11.7%). Other cause-specific early-readmission risks following cardiovascular and respiratory-related discharges were similar to estimates observed following discharge for any cause (figure 2 and online supplemental table S2).

The relative risk (RR, 95% CI) of cause-specific early and late-readmission following all-cause discharge. Readmission causes are colour coded: all-cause readmissions are indicated in black, cardiovascular causes in orange and respiratory causes in blue. RR is expressed per 10 µg/m3 increase in particulate matter (PM2.5). COPD, chronic obstructive pulmonary disease; RR, rate ratio.
An average AF at 10 μg/m3 of PM2.5 at lag 0 was 1.5% (95% CI 0.6% to 2.5%), 1.7% (95% CI 0.4% to 3.1%) and 1.7% (95% CI 0.3% to 3.2%) for an early-readmission for any cause following all-cause, cardiovascular and respiratory discharges, respectively (figure 3). County AF ranged 0.5%–2.5%, 0.6%–2.8% and 0.6%–2.8% for an early-readmission following all-cause, cardiovascular and respiratory-related discharges, respectively (figure 4).
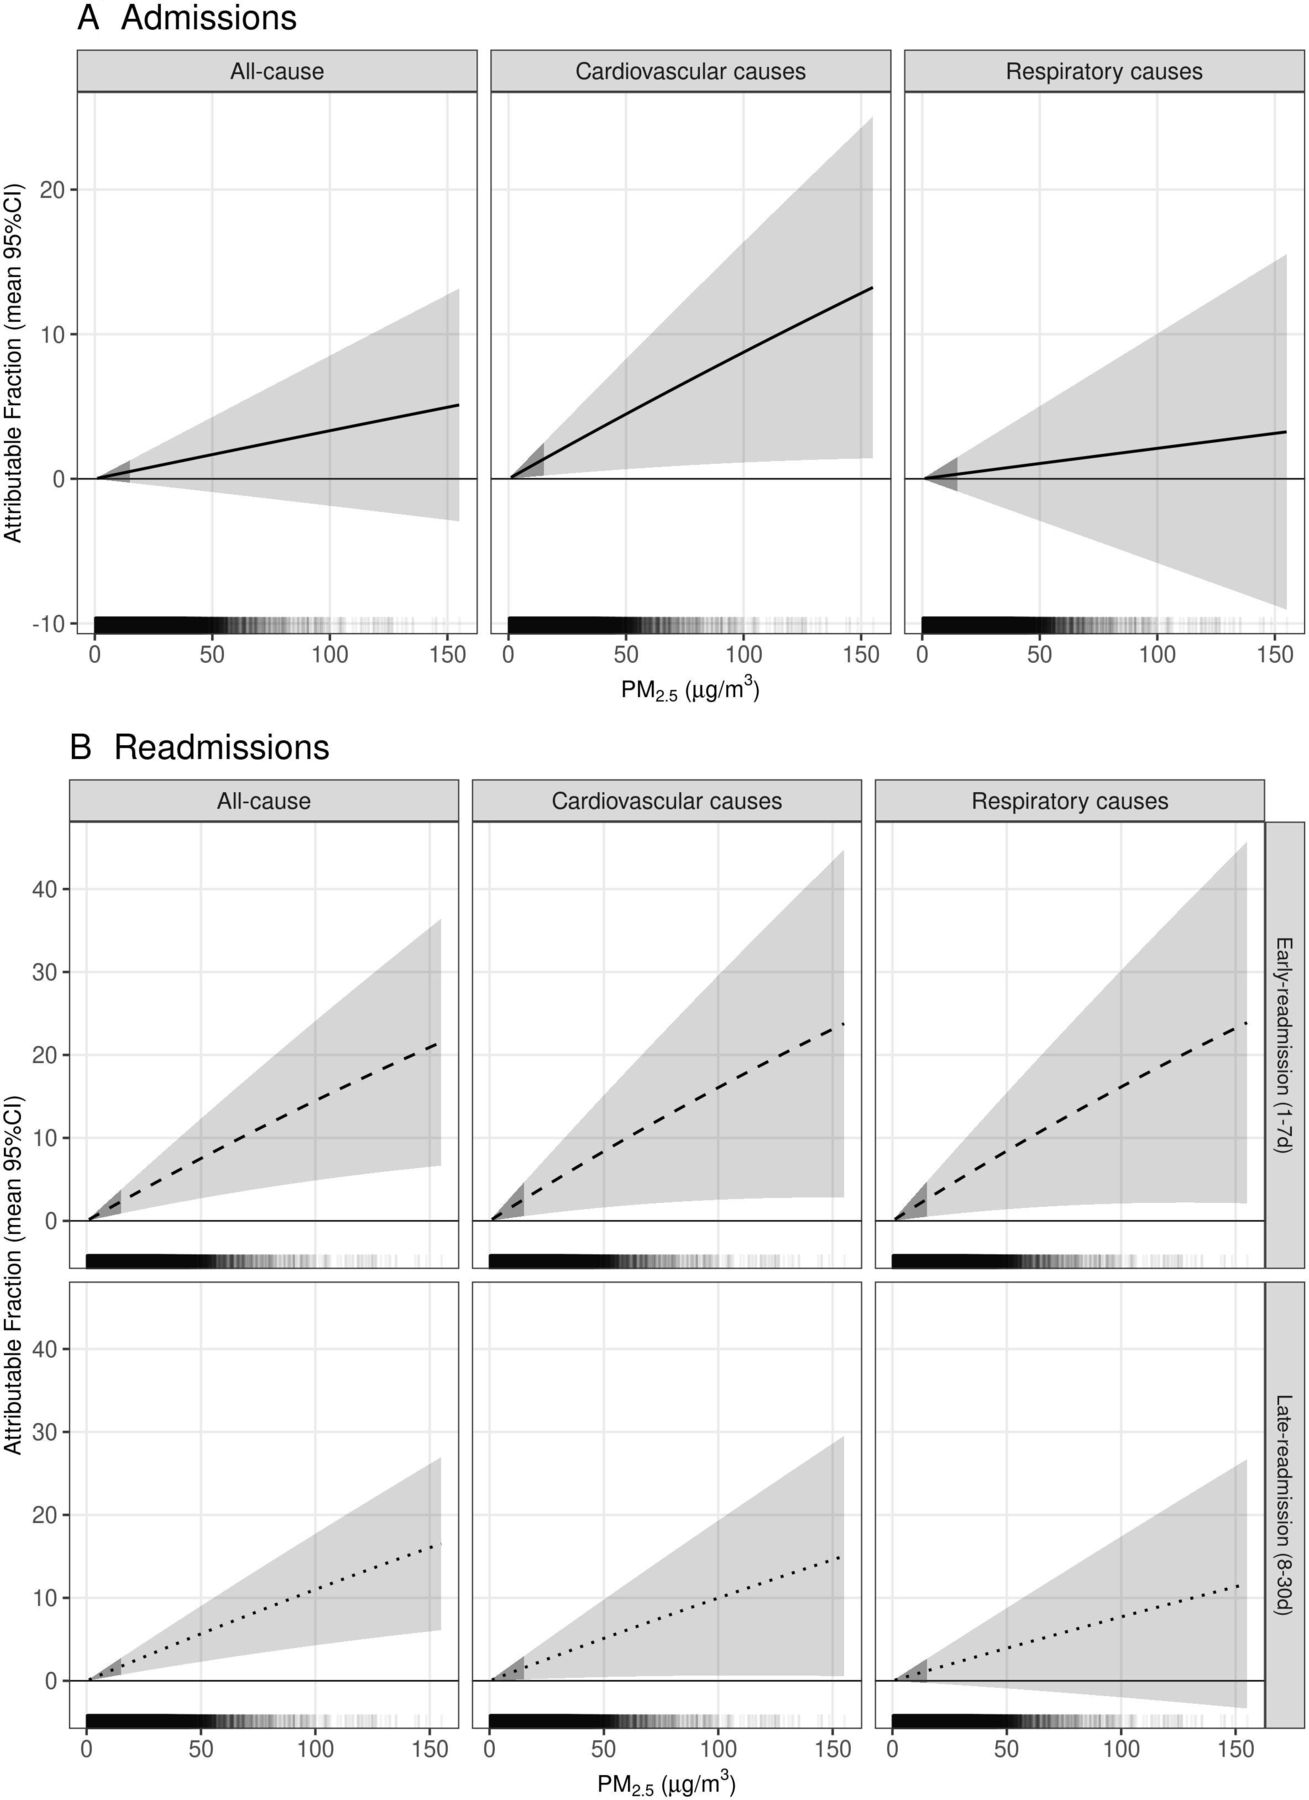
Mean proportion (95% CI) of all-cause and cause-specific hospital admissions, early readmissions (1–7 days) and late readmissions (8–30 days) with respect to particulate matter (PM2.5) (µg/m3). Hash marks above the x-axis represent the density of daily county PM2.5. The 95% CI under 15.9 µg/m3 is shaded darker to indicate where 90% of the data falls.

Average daily county particulate matter (PM2.5) (µg/m3) between 2008 and 2014 (A) and the attributable fraction (AF) for early-readmission following an all-cause discharge based on the average PM2.5 (B) for the 530 counties included in the study.
Late readmission
Daily PM2.5 was also associated with increased risk of late-readmission following all-cause, cardiovascular and respiratory-related discharges and the magnitude of risk related to all-cause readmissions was similar to that observed with early-readmission. Same day PM2.5 was associated with a 1.3% (95% CI 0.6% to 2.0%), 1.2% (95% CI 0.3% to 0.2.2%) and 1.0% (95% CI 0.01% to 2.0%) increased risk of a late all-cause readmission following all-cause, cardiovascular and respiratory-related discharges, respectively (figure 1 and online supplemental table S2).
Similar to observations made for early-readmissions, PM2.5 associated late-readmission risk was greater for certain cause-specific outcomes. Following all-cause discharges, a 10 μg/m3 increase in same day (lag 0) PM2.5 was associated with increased late-readmission risk for dysrhythmia and conduction disorder (3.1%, 95% CI 1.3% to 5.0%), heart failure (4.1%, 95% CI 2.5% to 5.8%), COPD (4.6%, 95% CI 1.7% to 7.6%), pneumonia (5.9%, 95% CI 3.7% to 8.2%) and other non-cardiac chest pain or respiratory syndrome (3.0%, 95% CI 1.9% to 4.1%) (figure 2 and online supplemental table S2).
The average AF at 10 μg/m3 was 0.1% (95% CI 0.5% to 1.8%) and 1.0% (95% CI 0.1% to 2.0%) for a late readmission following all-cause and cardiovascular discharges, respectively (figure 3). County AF ranged 0.3%–1.9% for a late readmission following any cause (data not shown).
Associations between PM2.5 and daily admissions
Same day PM2.5 was associated with an increase in RR of 0.3% (95% CI −0.2% to 0.9%) for all-cause admissions and 0.9% (95% CI 0.2% to 1.7%) for cardiovascular admissions (online supplemental figure S2 and table S3). We estimated 0.9% (95% CI 0.1% to 1.7%) of cardiovascular admissions could be attributed to 10 μg/m3 ambient PM2.5 (figure 3). Across counties, exposures accounted for 0.3%–1.5% of cardiovascular admissions when evaluated at the average daily PM2.5 for each county (data not shown).
No change in risk of all-cause and cardiovascular admissions was observed related to prior exposure (lags 1–14). Similarly, no change in risk for respiratory admissions was observed with same day exposure (lag 0) or prior exposure (lags 1–14) (online supplemental figure S2 and table S3). The model with a dose-specific association for PM2.5 (non-linear dose-response function) did not improve model fit. Models stratified on median percent below poverty were similar (online supplemental figure S2 and table S3). In a sensitivity analysis, changing the number of df considered for temperature and relative humidity had a negligible effect (online supplemental figures S3 and S4).
Discussion
In a nationwide cohort study of 351 294 patients with ESRD managed with haemodialysis, we evaluated the association between 1.8 million inpatient admissions and nearly 0.5 million corresponding 30-day readmissions and the variation in daily ambient PM2.5 in the USA over 7 years, 2008–2014. Daily variation in PM2.5 was associated with increased risk of hospital admission and even greater risk of rehospitalisation. Following all-cause, cardiovascular and respiratory-related discharges, the early-readmission risk for any cause was increased by 1.6, 1.8, 1.8%, respectively per 10 μg/m3 increase in daily PM2.5. Importantly, readmissions related to some cardiorespiratory diagnoses had the greatest PM2.5 attributed readmission risk that was observed to be elevated for both early and late readmissions. The early-readmission risk following all-cause discharges was increased by 6.5, 4.8, 3.7 and 2.7% for pneumonia, dysrhythmia and conduction disorder, heart failure, and other non-cardiac chest pain or respiratory syndrome-related readmissions, respectively. Overall, these results suggest that at 10 μg/m3, 1.5%–1.7% of early-readmissions for any cause were attributable to short-term exposure. In the context of the daily PM2.5 National Ambient Air Quality Standard (35 μg/m3), this AF would be 5.3%–6.0%.
Our findings are consistent with previous studies that observed increased admission risks in elderly populations6 9 38–42 and patients with cardiovascular health complications,7 43 and increased readmission risk following cardiovascular-related admissions.7 43 44 Studies in the Medicare population similarly observed a 1%–2% increase in cardiovascular hospital admissions associated with same-day PM2.5 concentrations.6 9 38 40 Risk appears to vary by diagnosis, as the increased risk was slightly less (0.13%) for ST-elevation myocardial infarction related admissions in a Chinese population7 and greater (29%) for incident heart failure admissions in an Australian population.43 Increases in respiratory admissions (1%–2%) have been noted in the Medicare population,6 9 38–40 but were not observed in this study. Prior studies provide evidence that air pollution exposure is associated with adverse health outcomes including increased infection rates, acute lung edema and elevated concentrations of systematic inflammation markers.45–47 Despite known associations between PM exposure and adverse cardiovascular and respiratory health outcomes, previous studies have not evaluated the impacts on hospital readmissions among individuals with ESRD.
Few studies have examined PM2.5-related effects on readmissions, and those that have report on the long-term (>1 year) risk following cardiovascular-related admissions. Following cardiovascular hospitalisation, greater PM2.5-related rehospitalisation risk was observed for some cardiac and respiratory readmissions (dysrhythmia, pneumonia) compared with our observations of all-cause readmissions (4.3%–7.5% vs 1.6%).
Studies in other populations have noted similar same-day cardiovascular-related readmission risks of 5.5%–7.7% and 2.6% associated with PM2.57 and PM10,44 respectively. Additionally, one study in an Australian population with very low ambient air pollution concentrations (mean PM2.5=2.9 µg/m3) found no relationship between PM2.5 and all-cause readmissions after an incident heart failure hospitalisation.43 In some instances, short-term readmission risks were greater in comparison to the long-term readmission risks, suggesting the week following a discharge to be a window of heightened vulnerability. Prior work indicates that factors related to index hospitalisations and acute illness burden are predictive of an early readmission.26 27 This may indicate that hospital readmissions related to certain acute illness burdens may be more susceptible to PM2.5 exposure.
Our study contributes to the currently limited literature on the association between air pollution and health impacts among haemodialysis patients and shines a light on the vulnerability in this clinical population related to ambient airborne PM2.5. The 30-day rehospitalisation rate is 33% in this population, which is twice that of older Medicare beneficiaries without a kidney disease diagnosis.16 As many as 70% of readmissions are thought to be unnecessary,48 prompting efforts to improve outcomes. Economic healthcare costs associated with short-term increases in PM2.5 are considerable; annual inpatient and postacute care costs related to a 10 μg/m3 in daily PM2.5 ranges US$30–US$70 million for cardiovascular and respiratory-related diseases.49 PM2.5 is a modifiable risk factor and reductions in short-term exposures could contribute to reduced healthcare costs. Our findings suggest that short-term increases in PM2.5 contribute to healthcare usage through unplanned admissions and readmissions.
Additionally, the findings of the study may have a broader public health implication. In the conceptual framework for public health action, ambient airborne PM2.5 fits well into the base of a 5-tiered pyramid as a socioeconomic or social determinant of health.50 Interventions that address the base of the pyramid may provide the greatest potential impact given the widespread population exposure of such a determinant of health like ambient airborne PM2.5. Mitigation strategies would need to include policy initiatives to curb the expulsion of airborne pollutants, as well as education of persons, patients, hospital staff and others. Areas with the higher concentrations of ambient airborne PM2.5 may see the greatest benefit from mitigation strategies.
Strengths and limitations
This study included a nearly complete cohort of US patients undergoing in-centre haemodialysis. To our knowledge, this is the largest analysis of short-term exposure to air pollution in the USA in this highly vulnerable population. The USRDS registry provides a complete registry of all hospitalisations and contains detailed information regarding demographics, dialysis, hospitalisation, rehospitalisation and comorbid conditions. Second, ambient PM2.5 was estimated using a prediction model with highly resolved spatial and temporal resolution with proven accuracy.29 30 Third, the time-stratified design allowed for county matching that reduced the potential confounding by factors that very slowly with time and those that are time-invariant. Fourth, the use of time-dependent risk factors in the Cox proportional hazard model allowed for readmission risk estimates to reflect the risk associated with daily fluctuations in ambient PM2.5 and time-varying confounders.
This study also had some limitations. First, there was the potential for exposure misclassification as the location of the last dialysis visit was used to estimate individual level exposures. PM2.5 around dialysis centres could differ from concentrations around hospitals and patient residences. However, given that patients generally reside less than six miles from their initial dialysis centre, differences in temporal variation of exposure should be small and not likely to contribute a systematic bias favouring an association between ambient PM2.5 and clinical events.32 33 Second, diagnosis misclassification was possible but was not likely to confound the relationship because it is not likely to vary on the same temporal scale as PM2.5. Third, there is the possibility that some unmeasured time variant factors may have confounded our estimates (smoking status, medication usage, behaviours, lipid levels, C reactive protein levels, etc). Data availability restricted the consideration of some patient-level confounders, such as smoking status, to values recorded at baseline. We used a time stratified design to control for time-varying confounding for time scales larger than a month, such as the number of patients enrolled in the USRDS. At scales smaller than a month, the control of person time was not possible. Lastly, generalisation of the results is limited to the Medicare population with ESRD managed with haemodialysis treatment. Future studies are needed to understand PM2.5-related impacts on specific health conditions, and if health impacts vary based on race, socioeconomic indicators or other individual and population factors.
Conclusion
In conclusion, this US-wide cohort study identified increased risk in patients receiving in-centre haemodialysis associated with short-term increases in ambient air particle pollution. Elevated PM2.5 concentrations were found to be associated with increased inpatient hospital admissions related to cardiovascular causes, and an increased likelihood of hospital readmission following cardiovascular and respiratory-related hospitalisations. Medicare spending for beneficiaries with ESRD is high. Traditional efforts to reduce the burden of disease focus on patient factors; however, these data suggest that air particle pollution is a factor that contributes to increased risks for hospital admission and subsequent readmission. To reduce PM2.5-related morbidities, we echo the recommendations made in the Million Hearts initiative, that healthcare systems, insurers, physicians, and healthcare professionals should incorporate health risks related to ambient PM into patient care.
Acknowledgments
The patient data reported here have been supplied by the US Renal Data System (USRDS). We are grateful for the high resolution ambient PM2.5 data provided by Drs Joel Schwartz and Qian Di. The interpretation and reporting of these data are the responsibility of the author(s) and in no way should be seen as an official policy or interpretation of the US government.
References
Supplementary materials
Supplementary Data
This web only file has been produced by the BMJ Publishing Group from an electronic file supplied by the author(s) and has not been edited for content.
Footnotes
Contributors LW and AGR conceived and designed the study. TW, WEC and AK provided subject expert input into the study design and interpretation of evidence. AK, QD and CW-C provided access to the data for the study; LW managed and analysed the data and AGR oversaw the analysis. LW and AGR wrote the first draft of the manuscript. LW, YX, AK, CW-C, TW, WEC and AGR critically contributed to the manuscript and approved the final draft. LW and AGR are the guarantors. The corresponding author attests that all listed authors meet authorship criteria and that no others meeting the criteria have been omitted.
Funding This work was supported by an internal US Environmental Protection Agency grant (grant number not applicable).
Disclaimer The research described in this article has been reviewed by the Center for Public Health and the Environment, US Environmental Protection Agency, and approved for publication. Approval does not signify that the contents necessarily reflect the views and policies of the Agency, nor does the mention of trade names of commercial products constitute endorsement or recommendation for use. The source of funding had no role in study design, data collection, analyses, interpretation, and decision to submit the article for publication.
Map disclaimer The depiction of boundaries on this map does not imply the expression of any opinion whatsoever on the part of BMJ (or any member of its group) concerning the legal status of any country, territory, jurisdiction or area or of its authorities. This map is provided without any warranty of any kind, either express or implied.
Competing interests All authors have completed the ICMJE uniform disclosure form at www.icmje.org/coi_disclosure.pdf and declare: no support from any organisation for the submitted work; no financial relationships with any organisations that might have an interest in the submitted work in the previous three years; no other relationships or activities that could appear to have influenced the submitted work.
Patient consent for publication Not required.
Ethics approval This study was reviewed by the institutional review board at the University of North Carolina at Chapel Hill and determined to be exempt based on the study design involving secondary data analysis (IRB Number: 20-0984).
Provenance and peer review Not commissioned; externally peer reviewed.
Data availability statement The USRDS data may be obtained from a third party and are not publicly available to researchers. Data access to USRDS data sets is through an internal data use agreement with the University of North Carolina at Chapel Hill’s Cecil G. Sheps Center. PM2.5 data were obtained through collaboration with Drs Joel Schwartz (Harvard TH Chan School of Public Health) and QD (Tsinghua University). For general data sharing inquiries contact rappold.ana{at}epa.gov or wyatt.lauren{at}epa.gov.
Supplemental material This content has been supplied by the author(s). It has not been vetted by BMJ Publishing Group Limited (BMJ) and may not have been peer-reviewed. Any opinions or recommendations discussed are solely those of the author(s) and are not endorsed by BMJ. BMJ disclaims all liability and responsibility arising from any reliance placed on the content. Where the content includes any translated material, BMJ does not warrant the accuracy and reliability of the translations (including but not limited to local regulations, clinical guidelines, terminology, drug names and drug dosages), and is not responsible for any error and/or omissions arising from translation and adaptation or otherwise.