Article Text

Abstract
Objectives We aimed to investigate the long-term absolute risk of hypertension and cardiovascular disease after kidney donation in living kidney donors.
Design Living kidney donors were matched to 10 controls from the general population.
Setting Multiple Danish national registries were used to identify living kidney donors from 1 January 1996 to 31 December 2017 nationwide.
Participants 1262 living kidney donors and 12 620 controls.
Main outcome measures Hypertension, cardiovascular disease and diabetes.
Results The median age of living kidney donors was 52 (men 43%). Hypertension developed in 50 (4%) and 231 (1.8%) with a median follow-up of 7 years (IQR 3.3–12.1 years with a maximum follow-up of 22 years) and 6.9 years (IQR 3.2–11.7 years and maximum follow-up of 22 years) for donors and controls, respectively. The absolute risk of hypertension was 2.3% (95% CI 1.4% to 3.2%) and 1.2% (95% CI 1.0% to 1.4%), 4.2% (95% CI 2.8% to 5.7%) and 2.4% (95% CI 2.1% to 2.8%), 8.6% (95% CI 6.0% to 11.3%) and 3.3% (95% CI 2.8% to 3.8%) within 5, 10, 15 years for donors and controls, respectively. The ratio of the 10-year absolute risks for hypertension was 1.64 (95% CI 1.44 to 1.88) for donors compared with the controls. Two donors and four controls developed renal replacement therapy requiring end-stage renal disease during follow-up. The absolute risk of cardiovascular disease and diabetes was 7.3% (95% CI 5.7% to 9.5%) and 8.3% (95% CI 7.7% to 9.0%), 1.7% (95% CI 0.7% to 2.8%) and 3.2% (95% CI 2.7% to 3.6%) at 10 years for donors and controls, respectively.
Conclusions Living kidney donors have an increased long-term absolute risk of hypertension compared with controls from the general population.
- renal transplantation
- hypertension
- cardiology
This is an open access article distributed in accordance with the Creative Commons Attribution Non Commercial (CC BY-NC 4.0) license, which permits others to distribute, remix, adapt, build upon this work non-commercially, and license their derivative works on different terms, provided the original work is properly cited, appropriate credit is given, any changes made indicated, and the use is non-commercial. See: http://creativecommons.org/licenses/by-nc/4.0/.
Statistics from Altmetric.com
Strengths and limitations of this study
This study is limited by the observational design.
Data on body mass index (BMI), smoking, family history and blood pressure were not available.
The registries applied in the present study are nationwide, the follow-up was complete and long term, every patient record was assessed on individual level, and the registry used to track the drugs administered in the treatment of hypertension is accurate and valid.
The study includes a risk of observation bias. Many patients with hypertension are unaware of their disease, and kidney donors could be more aware and more often have their blood pressure controlled.
Introduction
Kidney transplantation has expanded worldwide since the first kidney transplantation in 1954.1 Living donor kidney transplantation is the preferred treatment of choice in most end-stage renal disease patients as the outcomes as patient and graft survival are better with living kidney donation.2 The risk of end-stage kidney disease after living kidney donation is comparable to the general population in older studies, whereas recent studies report an increased risk of end-stage kidney disease after living kidney donation as compared with their healthy matched controls.3–6 The life expectancy after living kidney donation seems to be similar to the general population.3 5 7 8 The available data on the risk of hypertension are highly variable in living kidney donors after kidney donation and have been reported in the range of 16.3%–57% with mean follow-up between 6.2 and 16.6 years in the studied populations of kidney donors.3 9–12 The present evidence on the risk of hypertension in kidney donors is either characterised by small study populations, single-centre studies, insufficient data on living kidney donors at baseline or during follow-up, dated study populations or reference populations assembled and followed in time periods different from the living kidney donor populations.3 9–11 13
The current study aimed to investigate and clarify the long-term absolute risk of hypertension, occurrence of end-stage kidney disease, cardiovascular disease, diabetes and cause of death in a nationwide population of living kidney donors after kidney donation.
Materials and methods
Data sources
All residents in Denmark are provided with a permanent personal identification number at birth or immigration that allows linkage between nationwide administrative registries at individual level. Four of these registries were accessed to retrieve data. The Danish National Patient Registry contains information on all hospital admissions, outpatient appointments, diagnoses and procedural codes since 1978. Each hospital admission and outpatient appointment is at discharge or end of appointment coded with one primary diagnosis, and if appropriate one or more secondary diagnosis according to the International Classification of Diseases (ICD)—until 1994, the eight revision was used (ICD-8), and from 1994, the 10th revision (ICD-10) was applied.14 The codes used for accessing comorbidities are considered valid.15 The procedural codes are registered according to The Nordic Medico-Statistical Committee Classification of Surgical Procedures since 1996. The National Civil Registry comprises information on vital status for all residents in Denmark within 2 weeks from death. The Danish National Prescription Registry was established in 1995 and contains information on every dispensed prescription in Denmark including date of purchase and package size coded according to the Anatomic Therapeutic Classification system. The registry is considered accurate and valid.16 The Danish Registry of Causes of Death holds information on cause of death in all deceased residents in Denmark on individual level since 1970—coded according to ICD-10 from 1994.17
Population
The Danish National Patient Registry was accessed to identify living kidney donors in the period from 1 January 1996 to 31 December 31 2017. The donors were identified according to hospital admission with following procedural codes: KYKA00, KYKA01, KKAC00, KKAC01. Patients were excluded, if one or more secondary diagnoses related to the nephrectomy were coded at discharge during the admission for nephrectomy (see online supplemental table 1). Finally, each patient was cross-linked in pairs with a living kidney transplant recipient by transplanting hospital and date of kidney transplantation for confirmation of the identified living kidney donor population. The living kidney transplant recipients were identified in the period from 1 January 1996 to 31 December 2017 according to the hospital admission with the discharge procedural code KKAS20 as recorded in The Danish National Patient Registry. The controls were retrieved from the general population in the period from 1 January 1996 to 31 December 2017. Renal replacement therapy requiring end-stage kidney disease, diabetes, cardiovascular disease and hypertension was not allowed for controls at index.
Supplemental material
Renal function
All available serum creatinine measurements for living kidney donors between 1996 and 2017 were included from hospital laboratories in three counties of Denmark and the General Practitioner Laboratory of Copenhagen. Serum creatinine measurements were available for a subset of the living kidney donors and more than one serum creatinine measurement was available in 845 (67%) living kidney donors at any given point in time during follow-up. The estimated glomerular filtration rate (eGFR) was calculated using the Chronic Kidney Disease Epidemiology Collaboration equation.
Outcome
The main outcome of interest was hypertension in living kidney donors after kidney donation in the period 1996–2017. Hypertension was defined as a combination of at least two of the following drugs used in the treatment of hypertension as registered in the Danish National Prescription Registry with the Anatomic Therapeutic Classification: α adrenergic blockers (C02A, C02B, C02C), non-loop diuretics (C02DA, C02L, C03A, C03B, C03D, C03E, C03X, C07C, C07D, C08G, C09BA, C09DA, C09XA52), vasodilators (C02DB, C02DD, C02DG, C04, C05), β blockers (C07), calcium channel blockers (C07F, C08, C09BB, C09DB) and renin–angiotensin system inhibitors (C09). This definition has been validated in a previous randomly selected cohort in the Danish population and reached a positive predictive value of 80% for predicting hypertension, when treated with two drugs used in the treatment of hypertension.18 The subjects were followed until event, death or study end. Information on cardiovascular disease and diabetes was derived from The Danish National Patient Registry from index to event, death or study end. The diagnoses of diabetes were additionally augmented as redemption of antidiabetic drug prescriptions with the Anatomic Therapeutic Classification A10 as recorded in The Danish National Prescription Registry (see online supplemental table 1). The date of death and cause of death were retrieved from The National Civil Registry and The Danish Registry of Causes of Death, respectively. Renal replacement therapy was identified as receiving the procedure of dialysis for at least 90 days and 12 times or receiving the procedure of kidney transplantation as registered in The Danish National Patient Registry19 (see online supplemental table 1).
Statistical analyses
Continuous variables were presented as mean±SD or median with IQR. The eGFR measurements were presented as spaghetti diagram. Paired t-test was performed to test for difference in eGFR measurements at 1-year and 10-year follow-up compared with the baseline eGFR measurements. Reverse Kaplan-Meier was used to estimate median follow-up. The living kidney donors were matched with 10 controls from the general population at the date of the donation, birthyear and sex. The Aalen-Johansen method was used to estimate the absolute risk of hypertension, cardiovascular disease, diabetes and renal replacement therapy accounting for the competing risk of death. Gray’s test was performed to test for differences in absolute risk between cases and matched controls. We also reported the ratio of the 10-year risks of hypertension comparing cases and matched controls. Living kidney donors with hypertension at index were excluded from the analyses of hypertension. Log rank test was applied to test for difference in overall mortality between cases and matched controls. The statistical analyses were performed using R V.3.6.1.
Patient and public involvement
Patients or the public were not involved in the study.
Results
From 1 January 1996 to 31 December 31 2017, a total number of 1262 were identified as living kidney donors, figure 1. Of these, 33 (2.6%) had hypertension at the time of kidney donation. A total of 12 620 controls were included in the study. The median age in the living kidney donors was 52 years (IQR 44–60 years), and 538 (43%) were men. The median age in the controls was 52 years (IQR 44–60), and 5380 (43%) were men (table 1).

Flowchart.
Baseline characteristics of the study population
Hypertension
The median follow-up for hypertension was 7 years (IQR 3.3–12.1 years with a maximum follow-up of 22 years) and 6.9 years (IQR 3.2–11.7 years and maximum follow-up of 22 years) for donors and controls, respectively.
Hypertension was defined as a combination of two drugs used in the treatment of hypertension. At kidney donation, 87 (7%) living kidney donors were treated with one drug used in the treatment of hypertension with the following distribution: non-loop diuretic 23 (1.8%), calcium channel blockers 29 (2.3%), α adrenergic blockers ≤3 (≤0.2%), β blockers 12 (0.9%), renin–angiotensin system inhibitors 22 (1.8%).
During the follow-up period, 50 (4%) living kidney donors and 231 (1.9%) controls developed hypertension and were treated with different combinations of drugs used in the treatment of hypertension (table 2). Six of the living kidney donors were in treatment with one drug used in treatment of hypertension at kidney donation. The absolute risk of hypertension was 2.3% (95% CI 1.4% to 3.2%) and 1.2% (95% CI 1.0% to 1.4%) at 5 years; 4.2% (95% CI 2.8% to 5.7%) and 2.4% (95% CI 2.1% to 2.8%) at 10 years; 8.6% (95% CI 6.0% to 11.3%) and 3.3% (95% CI 2.8% to 3.8%) at 15 years for donors and controls, respectively (figure 2). The absolute risk of hypertension in living kidney donors was higher than the matched controls, p<0.001. The absolute risk ratio for hypertension was 1.64 (95% CI 1.44 to 1.88) for living kidney donors compared with the matched controls at 10 years after living kidney donation.
Drug combinations used for living kidney donors and controls in treatment of hypertension developed during follow-up

Absolute risks of hypertension after living kidney donation. *P value indicates the difference in absolute risks by Gray’s test.
Other comorbidities
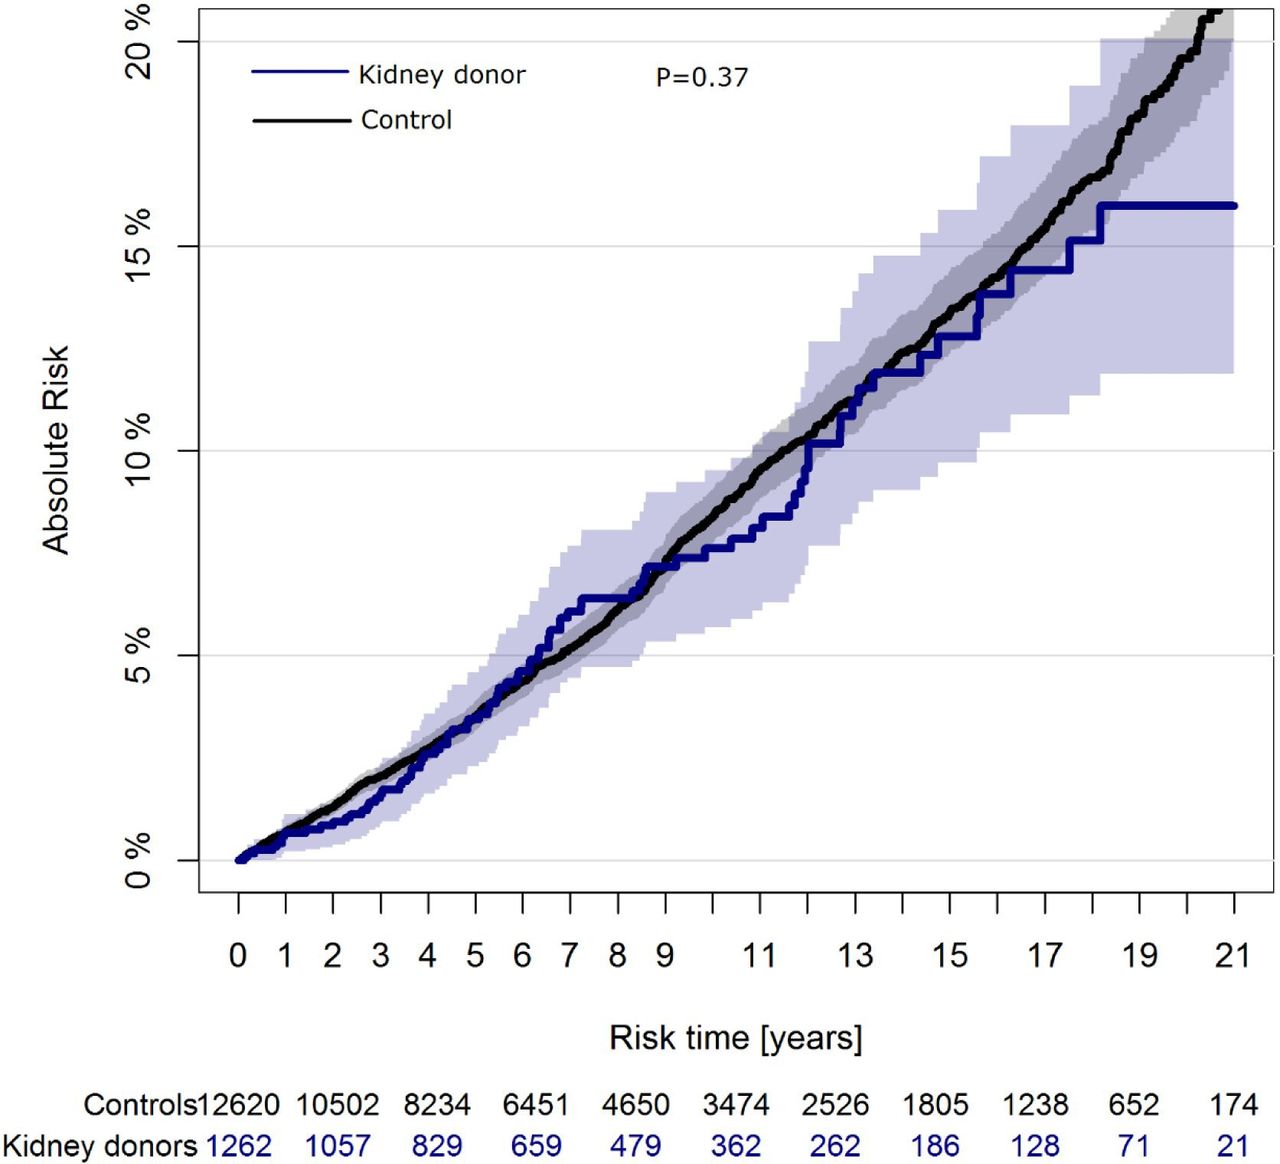
Cardiovascular disease occurred in 82 (6.5%) donors and 899 (7.1%) controls during follow-up. Diabetes was observed in 25 (2%) donors and 361 (2.9%) controls during the study period. The absolute risk of cardiovascular disease was 7.3% (95% CI 5.7% to 9.5%) and 8.3% (95% CI 7.7% to 9.0%) at 10-year follow-up for donors and controls, respectively (figure 3). The absolute risk for diabetes was 1.7% (95% CI 0.7% to 2.8%) in donors and 3.2% (95% CI 2.7% to 3.6%) in controls at 10 years (figure 4). There was no significant difference for cardiovascular disease (p=0.37) and diabetes (p=0.07) between the donors and the controls during follow-up, respectively.

Absolute risks of cardiovascular disease after living kidney donation. *P value indicates the difference in absolute risks by Gray’s test.
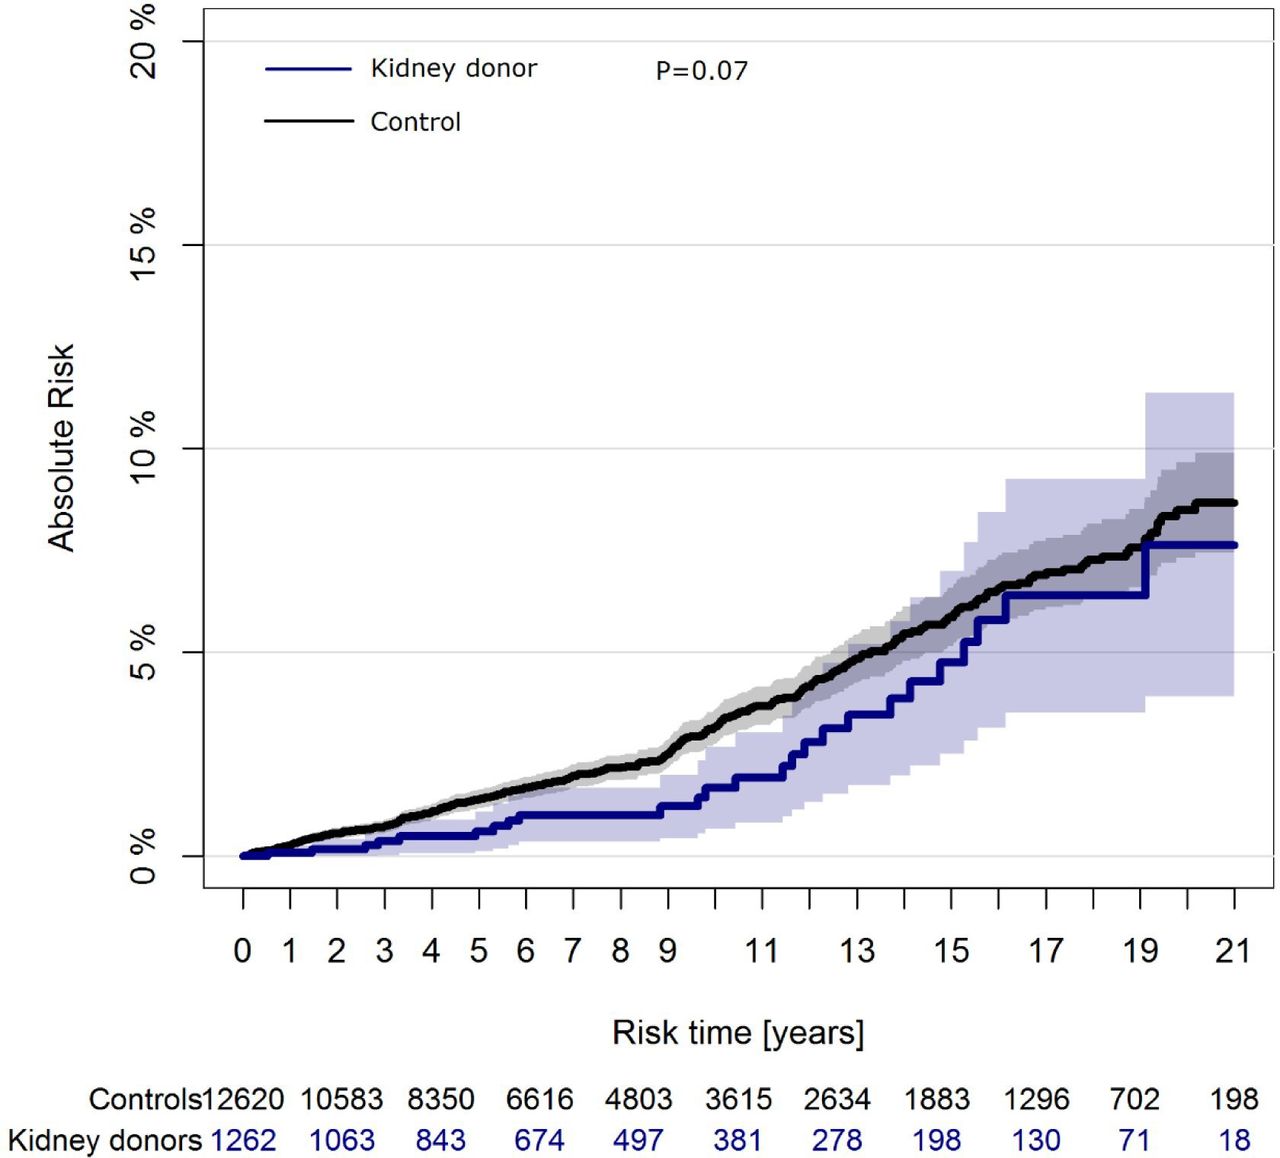
Absolute risks of diabetes after living kidney donation. *P value indicates the difference in absolute risks by Gray’s test.
Cause of death
In the observation period, 30 (2.4%) living kidney donors and 423 (3.4%) controls died, p=0.001. The causes of death in the living kidney donors were in descending frequency malignancy (14/1.1%), gastrointestinal bleeding (3/0.2%), pneumonia (≤3/≤0.2%), cardiovascular disease (≤3/≤0.2%), status asthmaticus (≤3/≤0.2%), neuromuscular disease (≤3/≤0.2%) and unknown in six kidney donors. The causes of death in controls were malignancy (224/1.8%), cardiovascular disease (68/0.5%), liver cirrhosis (20/0.1%), chronic obstructive lung disease and respiratory insufficiency (16/0.1%), neuromuscular disease (17/0.1%), suicide (12/0.1%), pneumonia (8/0.06%), sepsis (4/0.03%), diabetes (≤3/≤0.02%), acute abdomen (≤3/≤0.02%), gastrointestinal bleeding (≤3/≤0.02%), acute kidney insufficiency (≤3/≤0.02%) and unknown in 49 (0.4%) controls.
Renal replacement therapy
Less than three living kidney donors and four controls developed renal replacement therapy requiring end-stage renal disease during follow-up, p=0.29. Less than three controls received a kidney transplant in the study period.
Renal function
The eGFR (mean±SD) was 89.4±16.7 mL/min/1.73 m2 and age (median, IQR) was 55, 45–62 years (n=812), 59.4±13.1 mL/min/1.73 m2 and age (median, IQR) was 56, 46–64 years (n=410), 65.4±15.2 mL/min/1.73 m2 and age (median, IQR) was 63, 54–71 years (n=145) at baseline, 1–10 years after living kidney donation, respectively. The change in eGFR was significant at 1-year (n=560) and 10-year (n=68) follow-up compared with baseline eGFR, p<0.0001 (figure 5).

eGFR measurements of the living kidney donor population after kidney donation. Values are indicated when available with lines drawn between observations for each individual. eGFR, estimated glomerular filtration rate.
Discussion
In this nationwide study of living kidney donors with complete and long-term follow-up in the period 1996–2017, the long-term absolute risk of hypertension was higher in the living kidney donors than the matched controls from the general population.
Comparison with other studies
Previous studies have addressed the prevalence of hypertension in living kidney donors.3 9–11 Sanchez et al analysed a series of 3700 living kidney donors during 1963–2014 at a single centre and presented from self-reported surveys a prevalence of hypertension in 4% and 10% at 5 and 10 years, respectively.9 The study was subjected to information bias and had incomplete data on hypertension at baseline and follow-up in 17.4% of the studied population. Likewise, Ibrahim et al reported hypertension in 32.1% at mean 12.2 years in a study population of 255 (7% of all living kidney donations in the study period) living kidney donors during the period 1963–2007 at a single centre.3 However, this study included only living kidney donors who were alive at the conduction of the study and with accessible contact information. In a small cohort including 21 living kidney donors, Lenihan et al observed hypertension in 57% living kidney donors at median, 6.1 years.11 The study was small and had a short follow-up period. Hence, previous studies are characterised by limited generalisability, incomplete baseline or follow-up data on hypertension and subjected to information bias.
In a retrospective study of living kidney donors, Ekholm et al reported a lower risk of end-stage renal disease in living kidney donors than the general population.5 The study included 1112 living kidney donors during 1965–2005. Of these, six patients developed end-stage renal disease 16–27 years after kidney donation in an age range of 73–89 years except from one, who developed end-stage renal disease 14 years after donation at an age of 45 years related to renal carcinoma. On contrary, the results from Mjøen et al4 and Muzaale et al6 indicated an increased risk of end-stage renal disease in living kidney donors as compared with their healthy matched controls. However, neither study could match their controls for baseline factors as time of inclusion or location as end-stage renal disease in fact is partly related to the environment. The present study found a low frequency of renal replacement therapy requiring end-stage kidney disease in living kidney donors as well as in controls.
The majority of living kidney donors was in a combination treatment with renin–angiotensin system inhibitors for hypertension in the present study, which is in line with current guidelines for treatment of hypertension.20
The prevalence of diabetes and cardiovascular disease were consistent with the previous literature.9
In a retrospective case series, Okamoto et al7 studied 601 living kidney donors through 1970–2006 at a single centre. The distribution of malignancy as cause of death in living kidney donors during follow-up was comparable to our present data.
Conclusion
The long-term absolute risk of hypertension is increased in living kidney donors compared with the matched controls from the general population. No significant difference was observed for cardiovascular disease and diabetes between living kidney donors and controls.
References
Supplementary materials
Supplementary Data
This web only file has been produced by the BMJ Publishing Group from an electronic file supplied by the author(s) and has not been edited for content.
Footnotes
Contributors MC and CT-P conceived and designed the study. MC and CT-P performed the statistical analyses. MC wrote the first version of the manuscript. MC, GHG, ELF, LK, TAG, CT-P interpreted the results, edited and approved the final version of the manuscript. The corresponding author attests that all listed authors meet authorship criteria and that no others meeting the criteria have been omitted.
Funding The authors have not declared a specific grant for this research from any funding agency in the public, commercial or not-for-profit sectors.
Competing interests None declared.
Patient consent for publication Not required.
Ethics approval The present observational study was registered at The Danish Data Protection Agency (ref. 2007-58-0015 / internal ref. GEH-2014-015 I-suite no. 02733). Ethical approval is not required for observational studies in Denmark. Work with nationwide data requires that individuals are protected. Part of this requirement is that data on one to three individuals are not disclosed. Therefore such numbers are presented as ‘≤’.
Provenance and peer review Not commissioned; externally peer reviewed.
Data availability statement Data are available upon reasonable request. Data may be obtained from a third party and are not publicly available. The data that support the findings of this study are available from Statistics Denmark, but restrictions apply to the availability of these data, which were used under license for the current study, and so are not publicly available. Data are however available from the authors upon reasonable request and with permission of Statistics Denmark.
Supplemental material This content has been supplied by the author(s). It has not been vetted by BMJ Publishing Group Limited (BMJ) and may not have been peer-reviewed. Any opinions or recommendations discussed are solely those of the author(s) and are not endorsed by BMJ. BMJ disclaims all liability and responsibility arising from any reliance placed on the content. Where the content includes any translated material, BMJ does not warrant the accuracy and reliability of the translations (including but not limited to local regulations, clinical guidelines, terminology, drug names and drug dosages), and is not responsible for any error and/or omissions arising from translation and adaptation or otherwise.